Estimated zip code population in 2022: 745 Zip code population in 2010: 710 Zip code population in 2000: 794
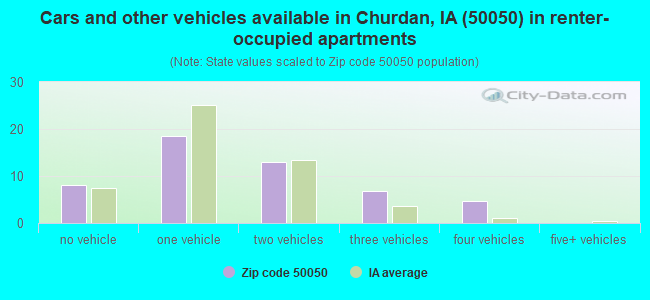
Houses and condos: 339 Renter-occupied apartments: 51
% of renters here:
16%
State:
28%
March 2022 cost of living index in zip code 50050: 82.1 (low, U.S. average is 100)
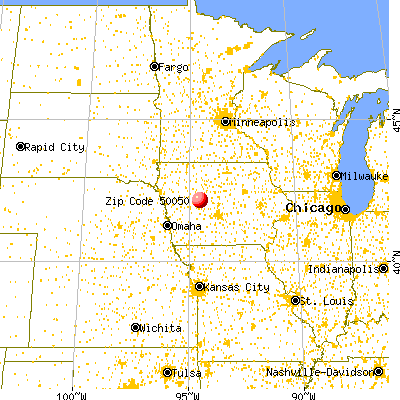
Land area: 76.3 sq. mi. Water area: 0.0 sq. mi.
Population density: 10 people per square mile
(very low).
OSM Map
General Map
Google Map
MSN Map
OSM Map
General Map
Google Map
MSN Map
OSM Map
General Map
Google Map
MSN Map
OSM Map
General Map
Google Map
MSN Map
Please wait while loading the map...
Real estate property taxes paid for housing units in 2022:
This zip code:
1.2% ($1,133)
Iowa:
1.4% ($2,724)
Median real estate property taxes paid for housing units with mortgages in 2022: $1,476 (1.3%) Median real estate property taxes paid for housing units with no mortgage in 2022: $743 (0.8%)
Business Search- 14 Million verified businesses
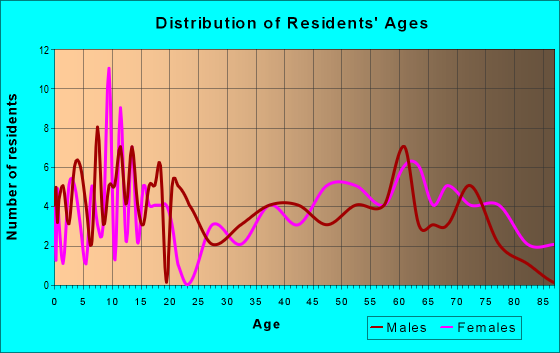
Males: 400
(53.7%)
Females: 345
(46.3%)
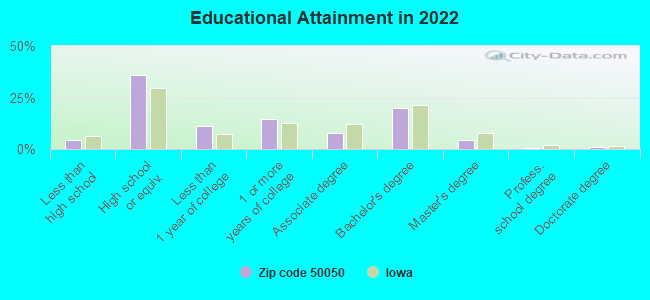
For population 25 years and over in 50050:
High school or higher: 94.5%
Bachelor's degree or higher: 26.2%
Graduate or professional degree: 6.5%
Unemployed: 5.4%
Mean travel time to work (commute): 25.2 minutes
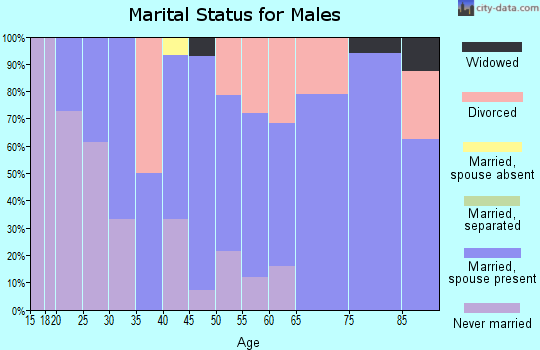
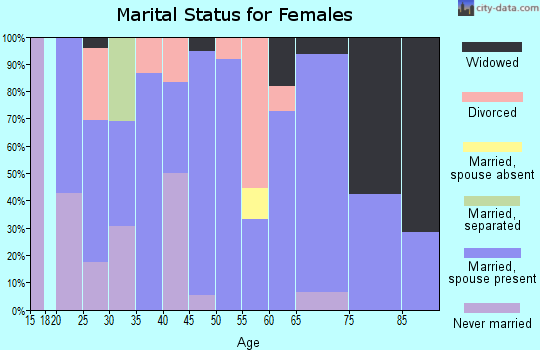
For population 15 years and over in 50050:
Never married: 33.5%
Now married: 47.1%
Separated: 0.0%
Widowed: 9.1%
Divorced: 10.3%
Zip code 50050 compared to state average:
Median house value below state average.
Unemployed percentage above state average.
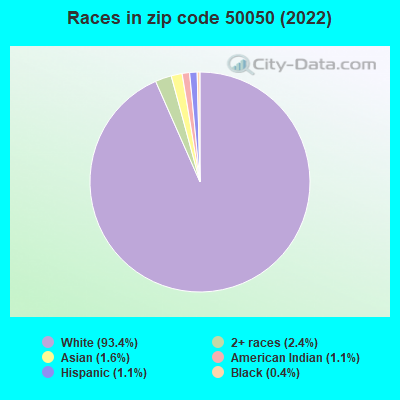
Black race population percentage significantly below state average.
Hispanic race population percentage significantly below state average.
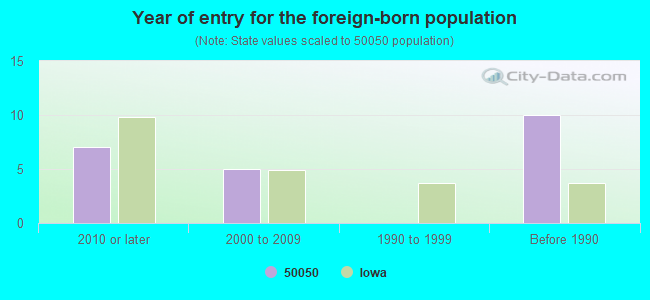
Foreign-born population percentage below state average.
Estimated median house/condo value in 2022: $95,800
50050:
$95,800
Iowa:
$194,600
According to our research of Iowa and other state lists, there was 1 registered sex offender living in 50050 zip code as of April 28, 2024. The ratio of all residents to sex offenders in zip code 50050 is 716 to 1. The ratio of registered sex offenders to all residents in this zip code is lower than the state average.
Median resident age:
This zip code:
42.0 years
Iowa median age:
38.9 years
Average household size:
This zip code:
2.3 people
Iowa:
2.3 people
Averages for the 2020 tax year for zip code 50050, filed in 2021:
Average Adjusted Gross Income (AGI) in 2020: $60,393 (Individual Income Tax Returns)
Here:
$60,393
State:
$71,087
Salary/wage: $42,865 (reported on 76.7% of returns)
Here:
$42,865
State:
$57,361
(% of AGI for various income ranges: 1233.3% for AGIs below $25k, 3884.0% for AGIs $25k-50k, 6570.0% for AGIs $50k-75k, 4740.0% for AGIs $75k-100k)
Taxable interest for individuals: $767 (reported on 40.0% of returns)
This zip code:
$767
Iowa:
$1,633
(% of AGI for various income ranges: 21.7% for AGIs below $25k, 14.0% for AGIs $25k-50k, 143.3% for AGIs $50k-75k, 12.5% for AGIs $75k-100k)
Ordinary dividends: $1,800 (reported on 26.7% of returns)
Here:
$1,800
State:
$5,432
(% of AGI for various income ranges: 46.7% for AGIs below $25k, 100.0% for AGIs $50k-75k)
Net capital gain/loss in AGI: +$7,550 (reported on 20.0% of returns)
Here:
+$7,550
State:
+$15,243
(% of AGI for various income ranges: 32.0% for AGIs $25k-50k)
Profit/loss from business: +$4,600 (reported on 10.0% of returns)
Here:
+$4,600
State:
+$11,763
(% of AGI for various income ranges: 276.0% for AGIs $25k-50k)
Taxable individual retirement arrangement distribution: $6,225 (reported on 13.3% of returns)
50050:
$6,225
Iowa:
$17,324
(% of AGI for various income ranges: 830.0% for AGIs $50k-75k)
Earned income credit: $3,433 (reported on 10.0% of returns)
Here:
$3,433
State:
$2,195
(% of AGI for various income ranges: 171.7% for AGIs below $25k)
Percentage of individuals using paid preparers for their 2020 taxes: 100.0%
Here:
100%
State:
95%
(% for various income ranges: 100.0% for AGIs below $25k, 100.0% for AGIs $25k-50k, 100.0% for AGIs $50k-75k, 100.0% for AGIs $75k-100k, 100.0% for AGIs $100k-200k)
Averages for the 2012 tax year for zip code 50050, filed in 2013:
Average Adjusted Gross Income (AGI) in 2012: $50,097 (Individual Income Tax Returns)
Here:
$50,097
State:
$58,860
Salary/wage: $31,038 (reported on 81.2% of returns)
Here:
$31,038
State:
$46,659
(% of AGI for various income ranges: 65.3% for AGIs below $25k, 65.8% for AGIs $25k-50k, 62.8% for AGIs $50k-75k, 63.7% for AGIs $75k-100k, 27.4% for AGIs $100k-200k)
Taxable interest for individuals: $769 (reported on 40.6% of returns)
This zip code:
$769
Iowa:
$1,537
(% of AGI for various income ranges: 1.1% for AGIs below $25k, 0.7% for AGIs $25k-50k, 1.0% for AGIs $50k-75k, 0.5% for AGIs $100k-200k)
Ordinary dividends: $1,489 (reported on 28.1% of returns)
Here:
$1,489
State:
$4,542
(% of AGI for various income ranges: 0.8% for AGIs $25k-50k, 0.5% for AGIs $50k-75k, 1.5% for AGIs $100k-200k)
Net capital gain/loss in AGI: +$3,580 (reported on 15.6% of returns)
Here:
+$3,580
State:
+$11,802
Profit/loss from business: +$4,320 (reported on 15.6% of returns)
Here:
+$4,320
State:
+$10,509
Taxable individual retirement arrangement distribution: $3,300 (reported on 9.4% of returns)
50050:
$3,300
Iowa:
$11,773
Total itemized deductions: $18,233 (22% of AGI, reported on 18.8% of returns)
Here:
$18,233
State:
$21,278
Here:
22.4% of AGI
State:
18.9% of AGI
Charity contributions: $1,425 (reported on 12.5% of returns)
Here:
$1,425
State:
$4,044
Taxes paid: $6,300 (reported on 18.8% of returns)
50050:
$6,300
State:
$8,846
Earned income credit: $1,517 (reported on 18.8% of returns)
Here:
$1,517
State:
$2,098
(% of AGI for various income ranges: 6.1% for AGIs below $25k)
Percentage of individuals using paid preparers for their 2012 taxes: 87.5%
Here:
88%
State:
65%
(% for various income ranges: 75.0% for AGIs below $25k, 88.9% for AGIs $25k-50k, 100.0% for AGIs $50k-75k, 100.0% for AGIs $75k-100k, 100.0% for AGIs $100k-200k)
Averages for the 2004 tax year for zip code 50050, filed in 2005:
Average Adjusted Gross Income (AGI) in 2004: $32,358 (Individual Income Tax Returns)
Here:
$32,358
State:
$43,875
Salary/wage: $26,779 (reported on 76.7% of returns)
Here:
$26,779
State:
$38,265
(% of AGI for various income ranges: 89.8% for AGIs below $10k, 61.2% for AGIs $10k-25k, 71.7% for AGIs $25k-50k, 71.4% for AGIs $50k-75k, 43.6% for AGIs $75k-100k)
Taxable interest for individuals: $1,415 (reported on 57.0% of returns)
This zip code:
$1,415
Iowa:
$1,768
(% of AGI for various income ranges: 7.6% for AGIs below $10k, 4.7% for AGIs $10k-25k, 3.4% for AGIs $25k-50k, 0.6% for AGIs $50k-75k, 1.2% for AGIs $75k-100k)
Taxable dividends: $690 (reported on 26.4% of returns)
Here:
$690
State:
$2,510
(% of AGI for various income ranges: 1.1% for AGIs below $10k, 1.4% for AGIs $10k-25k, 0.3% for AGIs $25k-50k, 0.2% for AGIs $50k-75k, 0.7% for AGIs $75k-100k)
Net capital gain/loss: +$1,697 (reported on 20.0% of returns)
Here:
+$1,697
State:
+$6,139
(% of AGI for various income ranges: 0.9% for AGIs $10k-25k, 1.3% for AGIs $25k-50k, 0.3% for AGIs $50k-75k, 1.6% for AGIs $75k-100k)
Profit/loss from business: +$2,022 (reported on 13.6% of returns)
Here:
+$2,022
State:
+$8,574
(% of AGI for various income ranges: 4.7% for AGIs below $10k, 2.3% for AGIs $10k-25k, 1.6% for AGIs $50k-75k)
Profit/loss from farming: +$6,882 (reported on 20.6% of returns)
Here:
+$6,882
State:
-$74
Total itemized deductions: $13,820 (31% of AGI, reported on 15.2% of returns)
Here:
$13,820
State:
$16,976
Here:
31.0% of AGI
State:
20.8% of AGI
Charity contributions deductions: $2,342 (6% of AGI, reported on 11.5% of returns)
Here:
$2,342
State:
$3,089
Here:
5.6% of AGI
State:
3.6% of AGI
Total tax: $3,598 (reported on 75.5% of returns)
50050:
$3,598
State:
$6,177
(% of AGI for various income ranges: 5.1% for AGIs below $10k, 3.8% for AGIs $10k-25k, 6.6% for AGIs $25k-50k, 9.2% for AGIs $50k-75k, 13.0% for AGIs $75k-100k)
Earned income credit: $1,611 (reported on 16.4% of returns)
Here:
$1,611
State:
$1,540
Percentage of individuals using paid preparers for their 2004 taxes: 86.7%
Here:
87%
State:
70%
(% for various income ranges: 82.5% for AGIs below $10k, 85.4% for AGIs $10k-25k, 89.9% for AGIs $25k-50k, 88.6% for AGIs $50k-75k, 85.7% for AGIs $75k-100k)
Household received Food Stamps/SNAP in the past 12 months: 26 Household did not receive Food Stamps/SNAP in the past 12 months: 291
Women who had a birth in the past 12 months: 1 (1 now married, 0 unmarried) Women who did not have a birth in the past 12 months: 139 (50 now married, 89 unmarried)
Housing units in zip code 50050 with a mortgage: 121 (2 second mortgage) Houses without a mortgage: 1
Median monthly owner costs for units with a mortgage: $928 Median monthly owner costs for units without a mortgage: $484
Residents with income below the poverty level in 2022:
This zip code:
20.4%
Whole state:
11.0%
Residents with income below 50% of the poverty level in 2022:
This zip code:
11.9%
Whole state:
5.5%
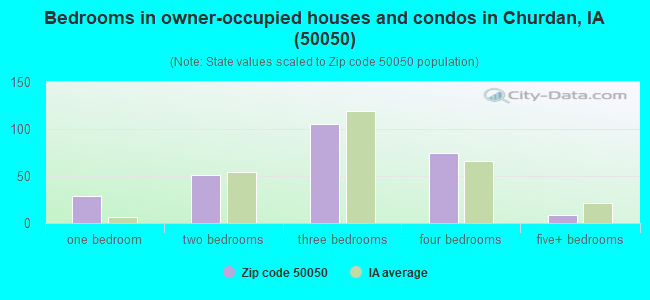
Median number of rooms in houses and condos:
Here:
6.6
State:
6.8
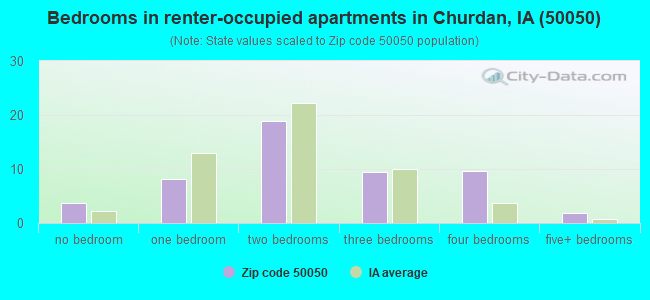
Median number of rooms in apartments:
Here:
5.6
State:
4.2
Notable locations in this zip code not listed on our city pages
Notable locations in zip code 50050: Northville (A), Churdan Library (B), Churdan City Hall (C), Churdan Fire and Rescue (D). Display/hide their locations on the map
Churches in zip code 50050 include: First Baptist Church (A), United Methodist Church (B), Saint Columbkill's Catholic Church (C), Saint Patricks Church (D). Display/hide their locations on the map
Size of family households: 106 2-persons, 30 3-persons, 20 4-persons, 28 5-persons, 9 6-persons
Size of nonfamily households: 114 1-person, 8 2-persons
117 married couples with children.
69 single-parent households (40 men, 29 women).
96.1% of residents of 50050 zip code speak English at home.
1.5% of residents speak Spanish at home (18% well, 82% not well).
0.4% of residents speak other Indo-European language at home (100% very well).
1.1% of residents speak Asian or Pacific Island language at home (100% very well).
0.8% of residents speak other language at home (100% very well).
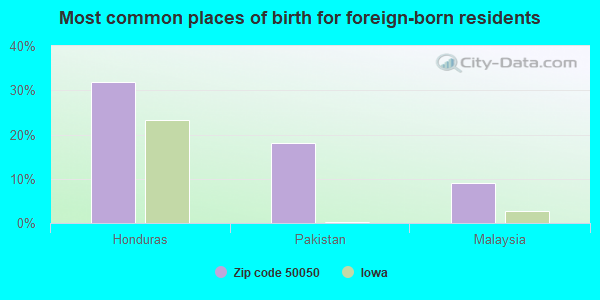
Foreign born population: 23 (3.1%) (14.1% of them are naturalized citizens)
This zip code:
3.1%
Whole state:
6.0%
32%Honduras
18%Pakistan
9%Malaysia
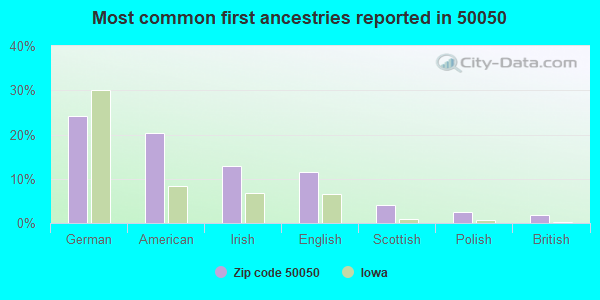
24%German
20%American
13%Irish
12%English
4%Scottish
2%Polish
2%British
Year of entry for the foreign-born population
72010 or later
52000 to 2009
01990 to 1999
10Before 1990
Facilities with environmental interests located in this zip code:
PATON CHURDAN SCH DIST (606 ADRIAN ST in CHURDAN, IA)
(Integrated Compliance Information System) - ICIS-07-1987-0111, FORMAL ENFORCEMENT ACTION COMPLIANCE ACTIVITY (Tracking inspections of insecticide, fungicide, and rodenticide, and toxic substances) Alternative names: PATON-CHURDAN C S D, PATON-CHURDAN CSD, PATON CHURDAN SCHOOLS
PATON-CHURDAN ELEMENTARY (606 ADRIAN ST. in CHURDAN, IA)
(National Center for Education Statistics) - STATE ID-375139 418 Organizations: PATON-CHURDAN COMM SCHOOL DISTRICT (SCHOOL DISTRICT)
PATON-CHURDAN JR-SR HIGH SCHOOL (606 ADRIAN ST in CHURDAN, IA)
(National Center for Education Statistics) - STATE ID-375139 172 Organizations: PATON-CHURDAN COMM SCHOOL DISTRICT (SCHOOL DISTRICT)
CHURDAN HOT RODS (900 FITZPATRICK ST in CHURDAN, IA)
USED OIL PROGRAM (Resource Conservation and Recovery Act (tracking hazardous waste)) - ICIS-, ENFORCEMENT/COMPLIANCE ACTIVITY Business NAICS classification: GENERAL AUTOMOTIVE REPAIR. Alternative names: III WAY SALES & SERVICE
CHURDAN CITY OF STP (EAST OF TOWN ON SAND STREET in CHURDAN, IA)
National Pollutant Discharge Elimination System NON-MAJOR (Tracking pollutant discharge elimination systems) - permit Business SIC classification: SEWERAGE SYSTEMS Organizations: CITY OF CHURDAN (CONTACT/OWNER)
CHURDAN FARMERS COOP (NO STREET ADDRESS in CHURDAN, IA)
AIR MINOR (AIRS/AFS)
PATON-CHURDAN CSD (PO BOX 157 in CHURDAN, IA)
COMPLIANCE ACTIVITY (Tracking inspections of insecticide, fungicide, and rodenticide, and toxic substances)
Housing units lacking complete plumbing facilities: 5.2%
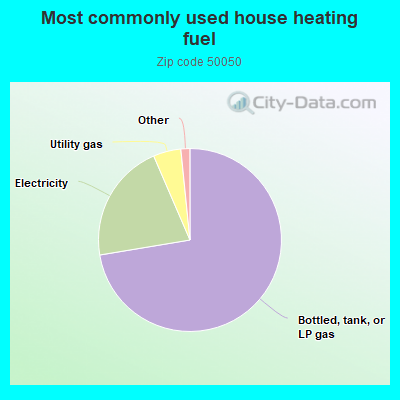
72.6%Bottled, tank, or LP gas
21.2%Electricity
4.9%Utility gas
1.0%Wood
0.7%Other fuel
Population in 1990: 797.
Place of birth for U.S.-born residents:
This state: 622
Northeast: 9
Midwest: 50
South: 6
West: 33
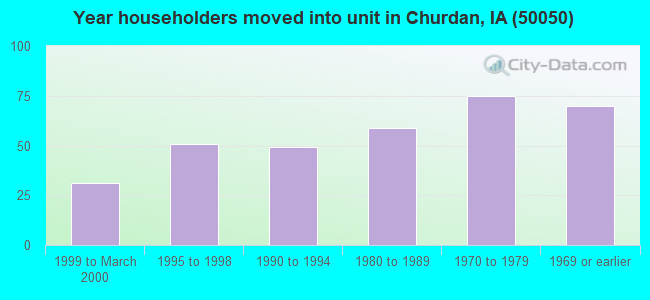
74% of the 50050 zip code residents lived in the same house 5 years ago. Out of people who lived in different houses, 41% lived in this county. Out of people who lived in different counties, 50% lived in Iowa.
90% of the 50050 zip code residents lived in the same house 1 year ago. Out of people who lived in different houses, 46% moved from this county. Out of people who lived in different houses, 48% moved from different county within same state. Out of people who lived in different houses, 6% moved from abroad.
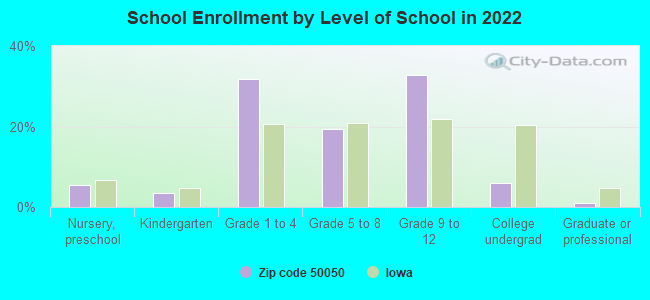
Private vs. public school enrollment:
Students in private schools in grades 1 to 8 (elementary and middle school): 29
Here:
29.2%
Iowa:
10.6%
Students in private schools in grades 9 to 12 (high school): 2
Here:
4.5%
Iowa:
7.9%
Students in private undergraduate colleges:
Here:
0.0%
Iowa:
23.9%
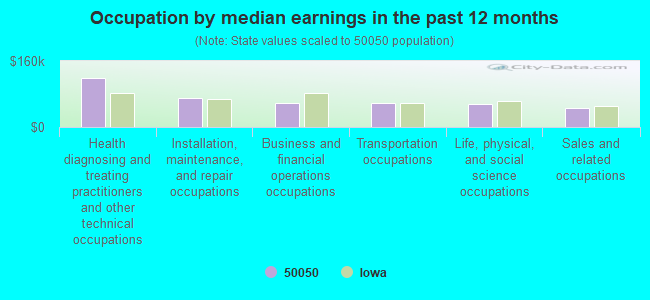
Occupation by median earnings in the past 12 months ($)
117,856Health diagnosing and treating practitioners and other technical occupations
69,185Installation, maintenance, and repair occupations
57,996Business and financial operations occupations
57,150Transportation occupations
55,720Life, physical, and social science occupations
45,779Sales and related occupations
Top industries in this zip code by the number of employees in 2005:
Health Care and Social Assistance: Child Day Care Services (5-9 employees: 1 establishment)
Construction: Poured Concrete Foundation and Structure Contractors (5-9: 1)
Finance and Insurance: Commercial Banking (5-9: 1)
Other Services (except Public Administration): Religious Organizations (1-4: 3)
Other Services (except Public Administration): Commercial and Industrial Machinery and Equipment (except Automotive and Electronic) Repair and Maintenance (1-4: 1)
Finance and Insurance: Sales Financing (1-4: 1)
Fatal accident statistics in 2011:
Fatal accident count: 1
Vehicles involved in fatal accidents: 2
Fatal accidents caused by drunken drivers: 0
Fatalities: 1
Persons involved in fatal accidents: 4
Pedestrians involved in fatal accidents: 0
2002 - 2018 National Fire Incident Reporting System (NFIRS) incidents
Based on the data from the years 2002 - 2018 the average number of fires per year is 6. The highest number of reported fire incidents - 33 took place in 2011, and the least - 0 in 2005. The data has a declining trend.
When looking into fire subcategories, the most reports belonged to: Outside Fires (56.4%), and Structure Fires (23.8%).
Fire incident types reported to NFIRS in Zip Code 50050


+$6,882
-$74
 Nearest zip codes: 51453, 50538, 51462, 51459, 50129, 51451.
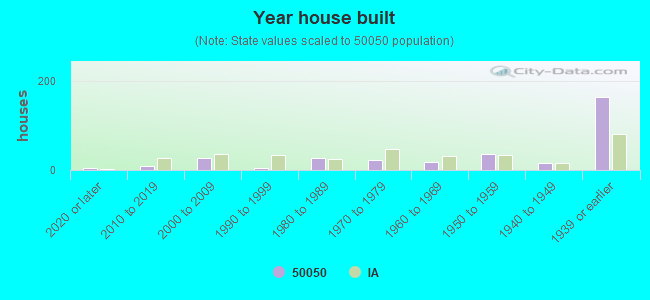


 Based on the data from the years 2002 - 2018 the average number of fires per year is 6. The highest number of reported fire incidents - 33 took place in 2011, and the least - 0 in 2005. The data has a declining trend.
 When looking into fire subcategories, the most reports belonged to: Outside Fires (56.4%), and Structure Fires (23.8%).