Estimated zip code population in 2022: 1,012 Zip code population in 2010: 1,118 Zip code population in 2000: 1,008
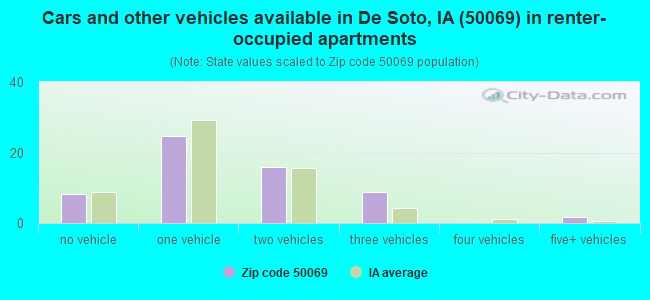
Houses and condos: 429 Renter-occupied apartments: 59
% of renters here:
15%
State:
28%
March 2022 cost of living index in zip code 50069: 82.9 (low, U.S. average is 100)
Land area: 5.1 sq. mi. Water area: 0.0 sq. mi.
Population density: 198 people per square mile
(very low).
OSM Map
General Map
Google Map
MSN Map
OSM Map
General Map
Google Map
MSN Map
OSM Map
General Map
Google Map
MSN Map
OSM Map
General Map
Google Map
MSN Map
Please wait while loading the map...
Real estate property taxes paid for housing units in 2022:
This zip code:
1.5% ($3,159)
Iowa:
1.4% ($2,724)
Median real estate property taxes paid for housing units with mortgages in 2022: $3,325 (1.4%) Median real estate property taxes paid for housing units with no mortgage in 2022: $2,692 (1.5%)
Business Search- 14 Million verified businesses
Males: 474
(46.9%)
Females: 537
(53.1%)
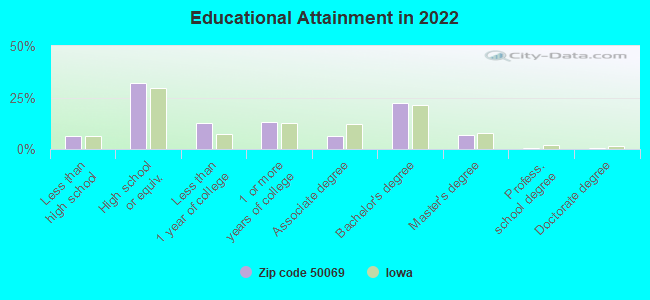
For population 25 years and over in 50069:
High school or higher: 94.4%
Bachelor's degree or higher: 30.1%
Graduate or professional degree: 7.8%
Unemployed: 2.7%
Mean travel time to work (commute): 24.8 minutes
For population 15 years and over in 50069:
Never married: 24.8%
Now married: 63.5%
Separated: 0.0%
Widowed: 5.2%
Divorced: 6.5%
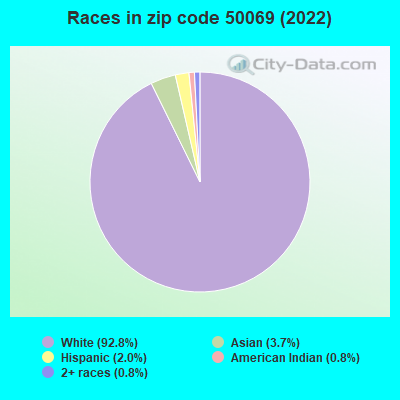
Zip code 50069 compared to state average:
Black race population percentage significantly below state average.
Hispanic race population percentage significantly below state average.
Renting percentage below state average.
Length of stay since moving in significantly above state average.
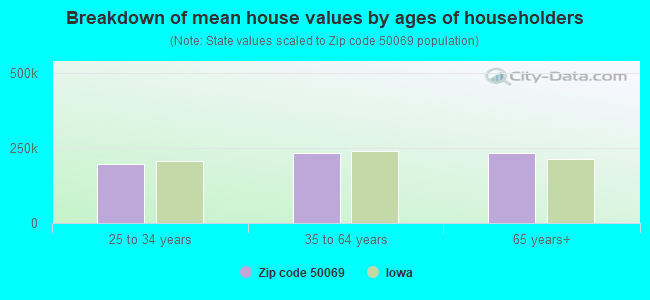
Estimated median house/condo value in 2022: $214,639
50069:
$214,639
Iowa:
$194,600
According to our research of Iowa and other state lists, there were 2 registered sex offenders living in 50069 zip code as of April 26, 2024. The ratio of all residents to sex offenders in zip code 50069 is 584 to 1. The ratio of registered sex offenders to all residents in this zip code is lower than the state average.
Median resident age:
This zip code:
35.7 years
Iowa median age:
38.9 years
Average household size:
This zip code:
2.6 people
Iowa:
2.3 people
Averages for the 2020 tax year for zip code 50069, filed in 2021:
Average Adjusted Gross Income (AGI) in 2020: $65,541 (Individual Income Tax Returns)
Here:
$65,541
State:
$71,087
Salary/wage: $56,902 (reported on 85.7% of returns)
Here:
$56,902
State:
$57,361
(% of AGI for various income ranges: 1376.7% for AGIs below $25k, 3479.1% for AGIs $25k-50k, 6314.3% for AGIs $50k-75k, 8765.0% for AGIs $75k-100k, 18178.3% for AGIs $100k-200k)
Taxable interest for individuals: $454 (reported on 26.5% of returns)
This zip code:
$454
Iowa:
$1,633
(% of AGI for various income ranges: 10.9% for AGIs $25k-50k, 12.9% for AGIs $50k-75k, 63.3% for AGIs $100k-200k)
Ordinary dividends: $2,588 (reported on 16.3% of returns)
Here:
$2,588
State:
$5,432
(% of AGI for various income ranges: 72.9% for AGIs $50k-75k, 260.0% for AGIs $100k-200k)
Net capital gain/loss in AGI: +$3,143 (reported on 14.3% of returns)
Here:
+$3,143
State:
+$15,243
(% of AGI for various income ranges: 104.3% for AGIs $50k-75k, 245.0% for AGIs $100k-200k)
Profit/loss from business: +$8,843 (reported on 14.3% of returns)
Here:
+$8,843
State:
+$11,763
(% of AGI for various income ranges: 299.1% for AGIs $25k-50k, 725.0% for AGIs $75k-100k)
Taxable individual retirement arrangement distribution: $10,525 (reported on 8.2% of returns)
50069:
$10,525
Iowa:
$17,324
(% of AGI for various income ranges: 601.4% for AGIs $50k-75k)
Total itemized deductions: $24,900 (reported on 6.1% of returns)
Here:
$24,900
State:
$33,775
(% of AGI for various income ranges: 1067.1% for AGIs $50k-75k)
Taxes paid: $7,267 (reported on 6.1% of returns)
50069:
$7,267
State:
$7,704
(% of AGI for various income ranges: 311.4% for AGIs $50k-75k)
Earned income credit: $2,171 (reported on 14.3% of returns)
Here:
$2,171
State:
$2,195
(% of AGI for various income ranges: 75.6% for AGIs below $25k, 76.4% for AGIs $25k-50k)
Percentage of individuals using paid preparers for their 2020 taxes: 98.0%
Here:
98%
State:
95%
(% for various income ranges: 91.7% for AGIs below $25k, 100.0% for AGIs $25k-50k, 100.0% for AGIs $50k-75k, 100.0% for AGIs $75k-100k, 100.0% for AGIs $100k-200k)
Averages for the 2012 tax year for zip code 50069, filed in 2013:
Average Adjusted Gross Income (AGI) in 2012: $55,678 (Individual Income Tax Returns)
Here:
$55,678
State:
$58,860
Salary/wage: $44,902 (reported on 93.9% of returns)
Here:
$44,902
State:
$46,659
(% of AGI for various income ranges: 79.6% for AGIs below $25k, 78.5% for AGIs $25k-50k, 81.7% for AGIs $50k-75k, 82.2% for AGIs $75k-100k, 66.8% for AGIs $100k-200k)
Taxable interest for individuals: $729 (reported on 28.6% of returns)
This zip code:
$729
Iowa:
$1,537
(% of AGI for various income ranges: 0.4% for AGIs below $25k, 0.5% for AGIs $25k-50k, 0.2% for AGIs $50k-75k, 1.0% for AGIs $75k-100k, 0.1% for AGIs $100k-200k)
Ordinary dividends: $1,667 (reported on 18.4% of returns)
Here:
$1,667
State:
$4,542
(% of AGI for various income ranges: 3.7% for AGIs below $25k, 0.5% for AGIs $50k-75k, 0.5% for AGIs $100k-200k)
Net capital gain/loss in AGI: +$15,840 (reported on 10.2% of returns)
Here:
+$15,840
State:
+$11,802
Profit/loss from business: +$5,350 (reported on 12.2% of returns)
Here:
+$5,350
State:
+$10,509
Taxable individual retirement arrangement distribution: $6,500 (reported on 8.2% of returns)
50069:
$6,500
Iowa:
$11,773
Total itemized deductions: $19,138 (20% of AGI, reported on 32.7% of returns)
Here:
$19,138
State:
$21,278
Here:
20.2% of AGI
State:
18.9% of AGI
(% of AGI for various income ranges: 11.7% for AGIs $25k-50k, 11.3% for AGIs $50k-75k, 10.6% for AGIs $75k-100k, 13.5% for AGIs $100k-200k)
Charity contributions: $2,442 (reported on 24.5% of returns)
Here:
$2,442
State:
$4,044
(% of AGI for various income ranges: 1.2% for AGIs $25k-50k, 0.5% for AGIs $50k-75k, 1.2% for AGIs $75k-100k, 1.5% for AGIs $100k-200k)
Taxes paid: $7,719 (reported on 32.7% of returns)
50069:
$7,719
State:
$8,846
(% of AGI for various income ranges: 2.7% for AGIs $25k-50k, 3.9% for AGIs $50k-75k, 4.3% for AGIs $75k-100k, 6.8% for AGIs $100k-200k)
Earned income credit: $2,343 (reported on 14.3% of returns)
Here:
$2,343
State:
$2,098
(% of AGI for various income ranges: 6.2% for AGIs below $25k, 1.0% for AGIs $25k-50k)
Percentage of individuals using paid preparers for their 2012 taxes: 57.1%
Here:
57%
State:
65%
(% for various income ranges: 53.3% for AGIs below $25k, 53.8% for AGIs $25k-50k, 55.6% for AGIs $50k-75k, 50.0% for AGIs $75k-100k, 83.3% for AGIs $100k-200k)
Averages for the 2004 tax year for zip code 50069, filed in 2005:
Average Adjusted Gross Income (AGI) in 2004: $43,771 (Individual Income Tax Returns)
Here:
$43,771
State:
$43,875
Salary/wage: $40,227 (reported on 94.2% of returns)
Here:
$40,227
State:
$38,265
(% of AGI for various income ranges: 106.3% for AGIs below $10k, 85.2% for AGIs $10k-25k, 88.6% for AGIs $25k-50k, 89.4% for AGIs $50k-75k, 92.0% for AGIs $75k-100k, 60.4% for AGIs over 100k)
Taxable interest for individuals: $338 (reported on 45.2% of returns)
This zip code:
$338
Iowa:
$1,768
(% of AGI for various income ranges: 1.6% for AGIs below $10k, 0.9% for AGIs $10k-25k, 0.6% for AGIs $25k-50k, 0.2% for AGIs $50k-75k, 0.1% for AGIs $75k-100k, 0.1% for AGIs over 100k)
Taxable dividends: $306 (reported on 19.1% of returns)
Here:
$306
State:
$2,510
(% of AGI for various income ranges: 0.4% for AGIs below $10k, 0.1% for AGIs $25k-50k, 0.2% for AGIs $50k-75k, 0.3% for AGIs $75k-100k)
Profit/loss from business: +$5,234 (reported on 14.4% of returns)
Here:
+$5,234
State:
+$8,574
(% of AGI for various income ranges: 4.6% for AGIs $10k-25k, -0.2% for AGIs $25k-50k, 3.2% for AGIs $50k-75k, 1.2% for AGIs $75k-100k)
Total itemized deductions: $13,789 (19% of AGI, reported on 29.9% of returns)
Here:
$13,789
State:
$16,976
Here:
18.9% of AGI
State:
20.8% of AGI
(% of AGI for various income ranges: 8.2% for AGIs $25k-50k, 9.7% for AGIs $50k-75k, 13.6% for AGIs $75k-100k, 11.2% for AGIs over 100k)
Charity contributions deductions: $1,518 (2% of AGI, reported on 24.7% of returns)
Here:
$1,518
State:
$3,089
Here:
2.0% of AGI
State:
3.6% of AGI
(% of AGI for various income ranges: 0.6% for AGIs $25k-50k, 0.7% for AGIs $50k-75k, 1.8% for AGIs $75k-100k, 1.0% for AGIs over 100k)
Total tax: $4,643 (reported on 79.3% of returns)
50069:
$4,643
State:
$6,177
(% of AGI for various income ranges: 2.4% for AGIs below $10k, 4.6% for AGIs $10k-25k, 6.4% for AGIs $25k-50k, 8.7% for AGIs $50k-75k, 9.5% for AGIs $75k-100k, 13.2% for AGIs over 100k)
Earned income credit: $1,357 (reported on 12.6% of returns)
Here:
$1,357
State:
$1,540
Percentage of individuals using paid preparers for their 2004 taxes: 62.5%
Here:
62%
State:
70%
(% for various income ranges: 49.3% for AGIs below $10k, 57.8% for AGIs $10k-25k, 60.3% for AGIs $25k-50k, 70.5% for AGIs $50k-75k, 91.3% for AGIs $75k-100k)
Household received Food Stamps/SNAP in the past 12 months: 9 Household did not receive Food Stamps/SNAP in the past 12 months: 385
Women who had a birth in the past 12 months: 27 (15 now married, 11 unmarried) Women who did not have a birth in the past 12 months: 228 (121 now married, 107 unmarried)
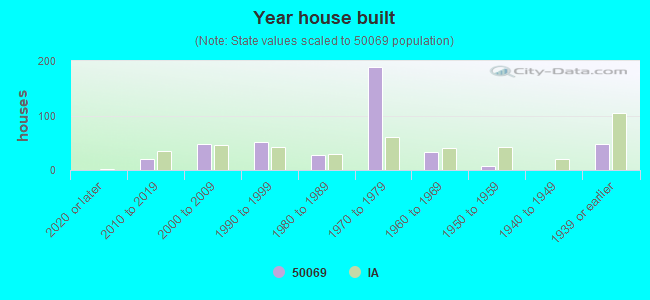
Housing units in zip code 50069 with a mortgage: 188 (26 second mortgage, 6 home equity loan, 20 both second mortgage and home equity loan) Houses without a mortgage: 7
Median monthly owner costs for units with a mortgage: $1,417 Median monthly owner costs for units without a mortgage: $612
Residents with income below the poverty level in 2022:
This zip code:
5.5%
Whole state:
11.0%
Residents with income below 50% of the poverty level in 2022:
This zip code:
1.7%
Whole state:
5.5%
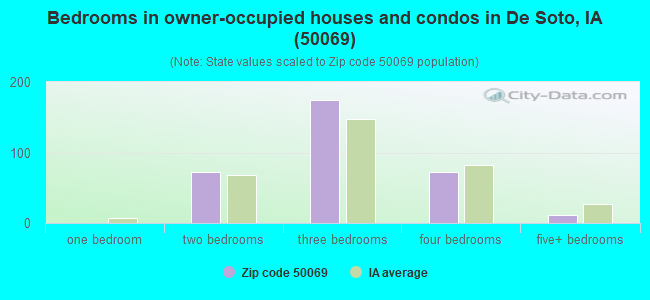
Median number of rooms in houses and condos:
Here:
6.4
State:
6.8
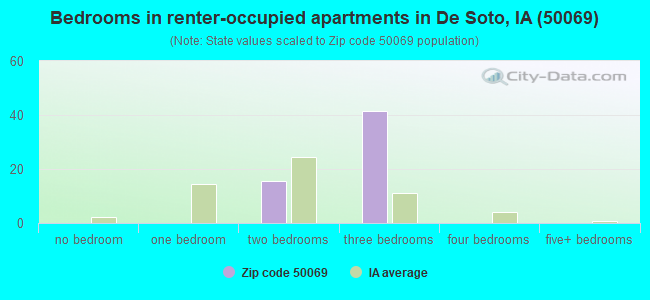
Median number of rooms in apartments:
Here:
5.7
State:
4.2
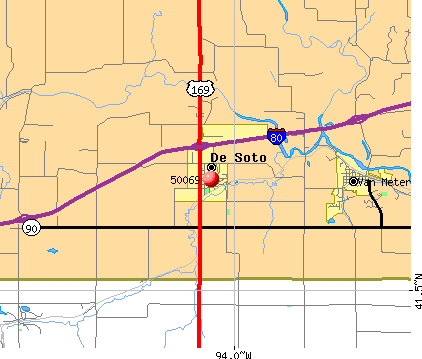
Notable locations in this zip code not listed on our city pages
Notable locations in zip code 50069: De Soto Elevator Incorporated Elevator (A), De Soto (B), De Soto Fire and Rescue Department (C), De Soto Public Library (D), De Soto City Hall (E). Display/hide their locations on the map
Size of family households: 126 2-persons, 60 3-persons, 62 4-persons, 18 5-persons, 8 6-persons, 7 7-or-more-persons
Size of nonfamily households: 74 1-person, 32 2-persons
233 married couples with children.
56 single-parent households (23 men, 33 women).
94.7% of residents of 50069 zip code speak English at home.
4.6% of residents speak other Indo-European language at home (81% very well, 19% well).
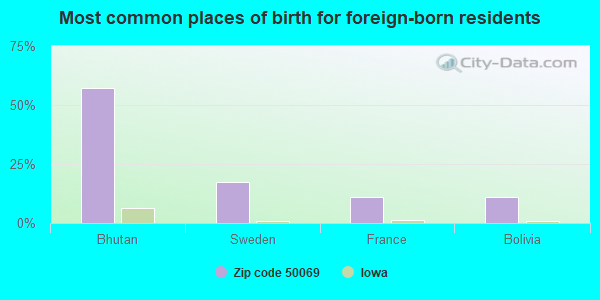
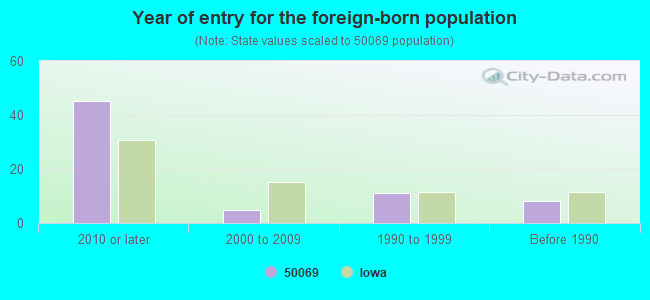
Foreign born population: 66 (6.5%) (41.2% of them are naturalized citizens)
This zip code:
6.5%
Whole state:
6.0%
57%Bhutan
17%Sweden
11%France
11%Bolivia
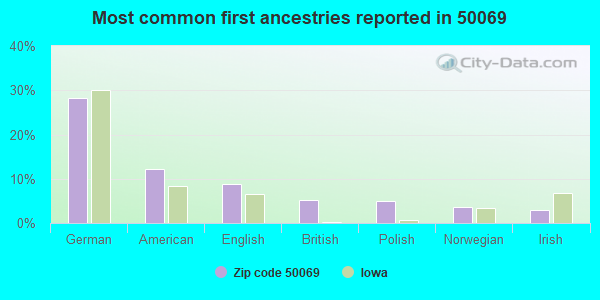
28%German
12%American
9%English
5%British
5%Polish
4%Norwegian
3%Irish
Year of entry for the foreign-born population
452010 or later
52000 to 2009
111990 to 1999
8Before 1990
Facilities with environmental interests located in this zip code:
BUTCH'S TIRE & REPAIR (909 GUTHRIE in DE SOTO, IA)
(Resource Conservation and Recovery Act (tracking hazardous waste)) - ICIS-, ENFORCEMENT/COMPLIANCE ACTIVITY Organizations: DAROLD M OSTRANDER (CONTACT/OWNER)
Alternative names: HI-WAY SERVICE
DESOTO INTERMEDIATE SCHOOL (317 SPRUCE ST in DESOTO, IA)
(National Center for Education Statistics) - STATE ID-250027 418 Organizations: ADEL-DESOTO-MINBURN COMM SCHOOL DISTRICT (SCHOOL DISTRICT)
DESOTO CITY OF STP (CITY CLERK in DE SOTO, IA)
National Pollutant Discharge Elimination System NON-MAJOR (Tracking pollutant discharge elimination systems) - permit Business SIC classification: SEWERAGE SYSTEMS Organizations: CITY OF DESOTO (CONTACT/OWNER)
DESOTO ELEVATOR COMPANY (418 ELM STREET in DE SOTO, IA)
AIR MINOR (AIRS/AFS) COMPLIANCE ACTIVITY (Tracking inspections of insecticide, fungicide, and rodenticide, and toxic substances) Business SIC classification: NONCLASSIFIABLE ESTABLISHMENTS
BROWER CONSTRUCTION CO-FORMER SITE OF (I-80 AND COUNTY ROAD P-58 in DE SOTO, IA)
(Resource Conservation and Recovery Act (tracking hazardous waste)) Business NAICS classification: ASPHALT PAVING MIXTURE AND BLOCK MANUFACTURING.
DALLAS BRADFORD RESIDENCE (616 DALLAS STREET in DE SOTO, IA)
ENFORCEMENT/COMPLIANCE ACTIVITY (Integrated Compliance Information System)
Housing units lacking complete plumbing facilities: 0.4% Housing units lacking complete kitchen facilities: 0.4%
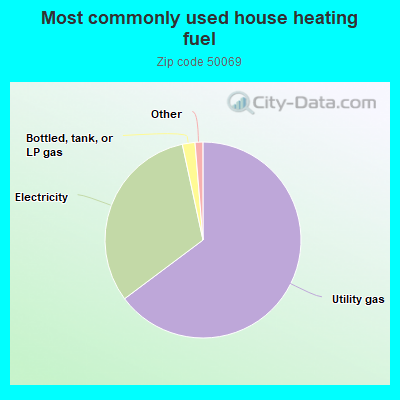
65.1%Utility gas
32.0%Electricity
2.1%Bottled, tank, or LP gas
0.8%Coal or coke
0.5%No fuel used
Population in 1990: 1,535.
Place of birth for U.S.-born residents:
This state: 781
Northeast: 6
Midwest: 89
South: 19
West: 51
59% of the 50069 zip code residents lived in the same house 5 years ago. Out of people who lived in different houses, 43% lived in this county. Out of people who lived in different counties, 50% lived in Iowa.
92% of the 50069 zip code residents lived in the same house 1 year ago. Out of people who lived in different houses, 9% moved from this county. Out of people who lived in different houses, 82% moved from different county within same state. Out of people who lived in different houses, 11% moved from different state.
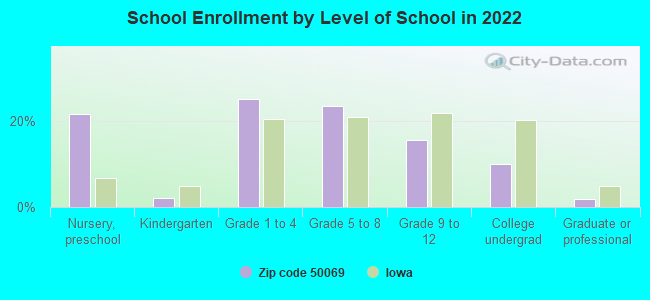
Private vs. public school enrollment:
Students in private schools in grades 1 to 8 (elementary and middle school): 3
Here:
2.7%
Iowa:
10.6%
Students in private schools in grades 9 to 12 (high school):
Here:
0.0%
Iowa:
7.9%
Students in private undergraduate colleges: 3
Here:
12.4%
Iowa:
23.9%
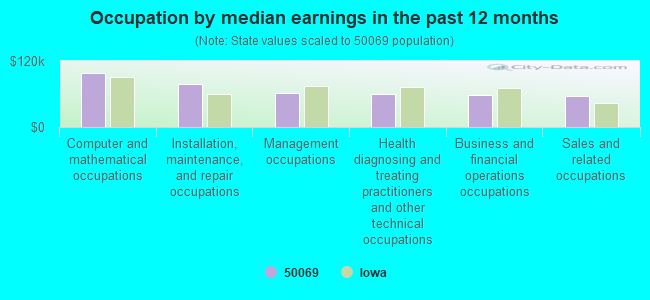
Occupation by median earnings in the past 12 months ($)
98,174Computer and mathematical occupations
77,780Installation, maintenance, and repair occupations
61,950Management occupations
60,076Health diagnosing and treating practitioners and other technical occupations
57,364Business and financial operations occupations
56,551Sales and related occupations
Top industries in this zip code by the number of employees in 2005:
Health Care and Social Assistance: Child Day Care Services (10-19 employees: 1 establishment)
Construction: Drywall and Insulation Contractors (5-9: 1)
Mining: Crushed and Broken Limestone Mining and Quarrying (5-9: 1)
Construction: Painting and Wall Covering Contractors (5-9: 1)
Finance and Insurance: Commercial Banking (5-9: 1)
Accommodation and Food Services: Hotels (except Casino Hotels) and Motels (1-4: 2)
Construction: Commercial and Institutional Building Construction (1-4: 2)
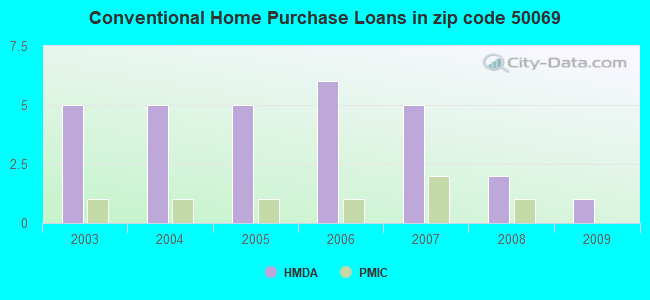
Home Mortgage Disclosure Act Aggregated Statistics For Year 2009 (Based on 2 partial tracts)
A) FHA, FSA/RHS & VA Home Purchase Loans
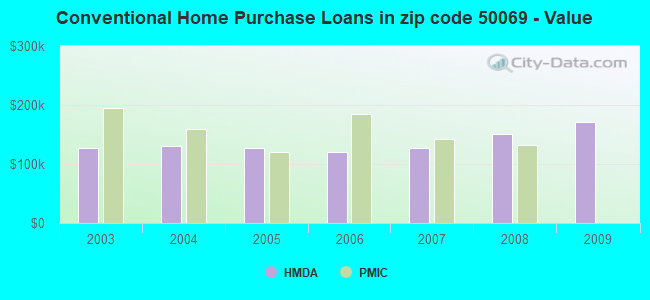
B) Conventional Home Purchase Loans
C) Refinancings
D) Home Improvement Loans
Number
Average Value
Number
Average Value
Number
Average Value
Number
Average Value
LOANS ORIGINATED
1
$195,150
1
$171,560
8
$145,710
1
$16,040
APPLICATIONS APPROVED, NOT ACCEPTED
0
$0
0
$0
1
$108,120
0
$0
APPLICATIONS DENIED
0
$0
0
$0
2
$140,905
0
$0
APPLICATIONS WITHDRAWN
0
$0
0
$0
1
$199,530
0
$0
FILES CLOSED FOR INCOMPLETENESS
0
$0
0
$0
0
$0
0
$0
Aggregated Statistics For Year 2008 (Based on 2 partial tracts)
A) FHA, FSA/RHS & VA Home Purchase Loans
B) Conventional Home Purchase Loans
C) Refinancings
D) Home Improvement Loans
Number
Average Value
Number
Average Value
Number
Average Value
Number
Average Value
LOANS ORIGINATED
1
$160,100
2
$151,270
4
$149,602
1
$51,720
APPLICATIONS APPROVED, NOT ACCEPTED
0
$0
0
$0
1
$85,560
0
$0
APPLICATIONS DENIED
0
$0
0
$0
2
$153,835
1
$53,420
APPLICATIONS WITHDRAWN
0
$0
0
$0
1
$160,040
0
$0
FILES CLOSED FOR INCOMPLETENESS
0
$0
0
$0
0
$0
0
$0
Aggregated Statistics For Year 2007 (Based on 2 partial tracts)
B) Conventional Home Purchase Loans
C) Refinancings
D) Home Improvement Loans
F) Non-occupant Loans on < 5 Family Dwellings (A B C & D)
Number
Average Value
Number
Average Value
Number
Average Value
Number
Average Value
LOANS ORIGINATED
5
$126,754
5
$142,352
1
$52,190
1
$70,330
APPLICATIONS APPROVED, NOT ACCEPTED
0
$0
1
$113,180
0
$0
0
$0
APPLICATIONS DENIED
1
$100,200
3
$137,050
1
$30,500
0
$0
APPLICATIONS WITHDRAWN
0
$0
1
$135,480
0
$0
0
$0
FILES CLOSED FOR INCOMPLETENESS
0
$0
0
$0
0
$0
0
$0
Aggregated Statistics For Year 2006 (Based on 2 partial tracts)
B) Conventional Home Purchase Loans
C) Refinancings
D) Home Improvement Loans
Number
Average Value
Number
Average Value
Number
Average Value
LOANS ORIGINATED
6
$119,660
5
$109,458
1
$30,840
APPLICATIONS APPROVED, NOT ACCEPTED
0
$0
1
$127,560
0
$0
APPLICATIONS DENIED
1
$79,570
4
$104,955
0
$0
APPLICATIONS WITHDRAWN
0
$0
2
$88,530
0
$0
FILES CLOSED FOR INCOMPLETENESS
0
$0
1
$129,370
0
$0
Aggregated Statistics For Year 2005 (Based on 2 partial tracts)
A) FHA, FSA/RHS & VA Home Purchase Loans
B) Conventional Home Purchase Loans
C) Refinancings
D) Home Improvement Loans
Number
Average Value
Number
Average Value
Number
Average Value
Number
Average Value
LOANS ORIGINATED
1
$81,100
5
$127,670
5
$123,442
1
$50,400
APPLICATIONS APPROVED, NOT ACCEPTED
0
$0
0
$0
1
$138,040
0
$0
APPLICATIONS DENIED
0
$0
1
$88,650
3
$138,040
1
$30,360
APPLICATIONS WITHDRAWN
0
$0
0
$0
1
$183,830
0
$0
FILES CLOSED FOR INCOMPLETENESS
0
$0
0
$0
1
$113,670
0
$0
Aggregated Statistics For Year 2004 (Based on 2 partial tracts)
B) Conventional Home Purchase Loans
C) Refinancings
D) Home Improvement Loans
Number
Average Value
Number
Average Value
Number
Average Value
LOANS ORIGINATED
5
$130,204
6
$108,388
1
$12,700
APPLICATIONS APPROVED, NOT ACCEPTED
0
$0
1
$126,660
0
$0
APPLICATIONS DENIED
1
$53,220
3
$102,893
0
$0
APPLICATIONS WITHDRAWN
0
$0
1
$142,240
0
$0
FILES CLOSED FOR INCOMPLETENESS
0
$0
1
$97,520
0
$0
Aggregated Statistics For Year 2003 (Based on 2 partial tracts)

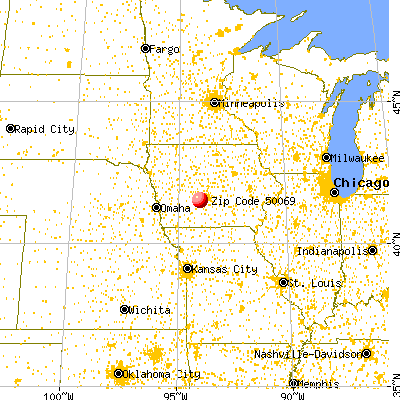


 Nearest zip codes: 50003, 50072, 50261, 50038, 50263, 50273.