Estimated zip code population in 2022: 15,927 Zip code population in 2010: 15,113 Zip code population in 2000: 18,590
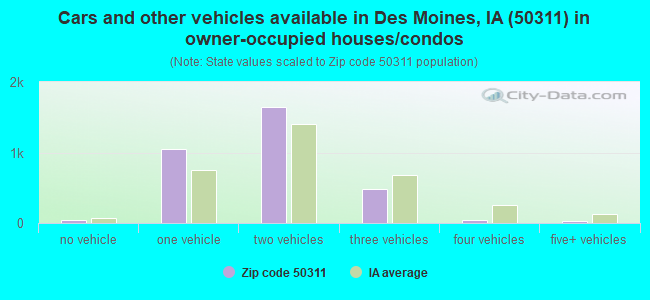
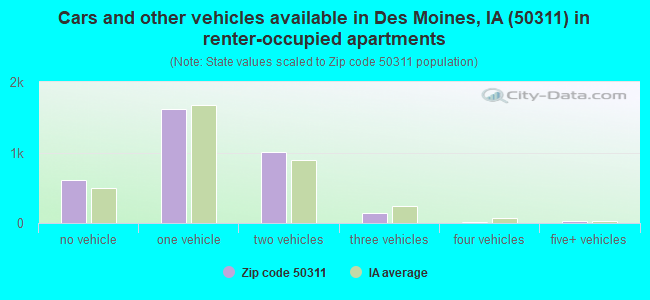
Houses and condos: 7,120 Renter-occupied apartments: 3,414
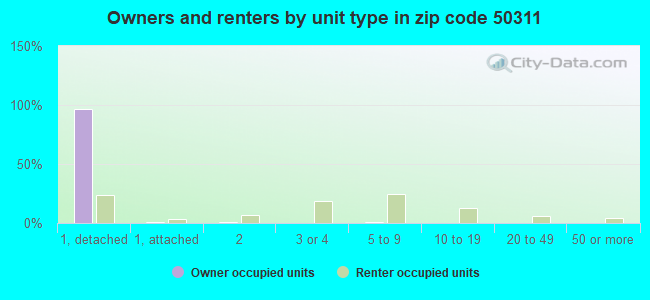
% of renters here:
51%
State:
28%
March 2022 cost of living index in zip code 50311: 90.0 (less than average, U.S. average is 100)
Land area: 2.5 sq. mi. Water area: 0.0 sq. mi.
Population density: 6,335 people per square mile
(high).
OSM Map
General Map
Google Map
MSN Map
OSM Map
General Map
Google Map
MSN Map
OSM Map
General Map
Google Map
MSN Map
OSM Map
General Map
Google Map
MSN Map
Please wait while loading the map...
Real estate property taxes paid for housing units in 2022:
This zip code:
1.8% ($4,109)
Iowa:
1.4% ($2,724)
Median real estate property taxes paid for housing units with mortgages in 2022: $4,166 (1.8%) Median real estate property taxes paid for housing units with no mortgage in 2022: $3,975 (1.8%)
Business Search- 14 Million verified businesses
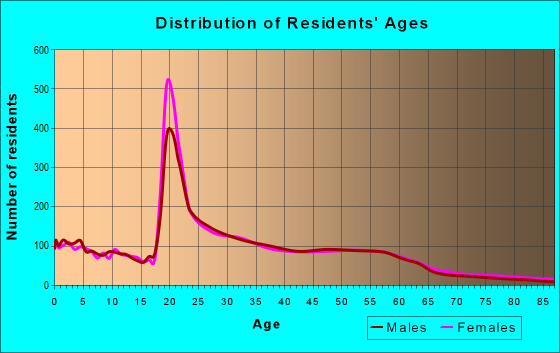
Males: 7,954
(49.9%)
Females: 7,972
(50.1%)
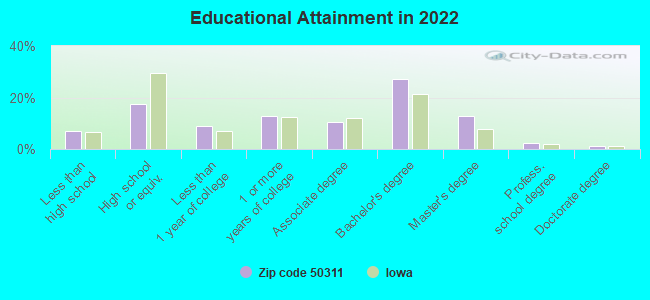
For population 25 years and over in 50311:
High school or higher: 94.1%
Bachelor's degree or higher: 44.1%
Graduate or professional degree: 16.4%
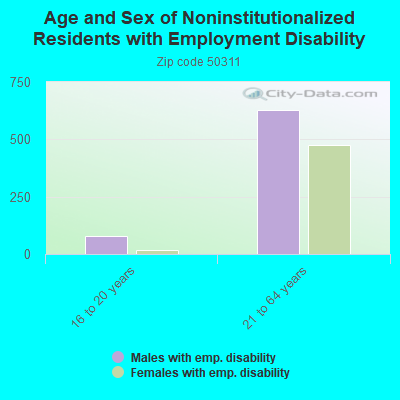
Unemployed: 6.5%
Mean travel time to work (commute): 17.7 minutes
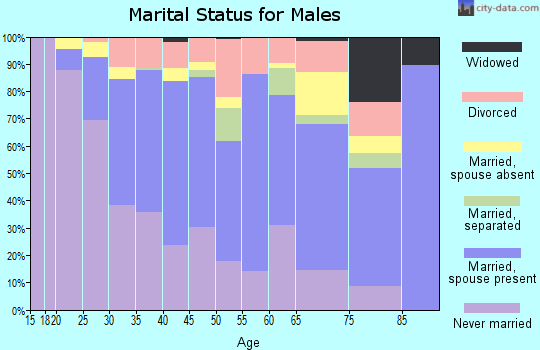
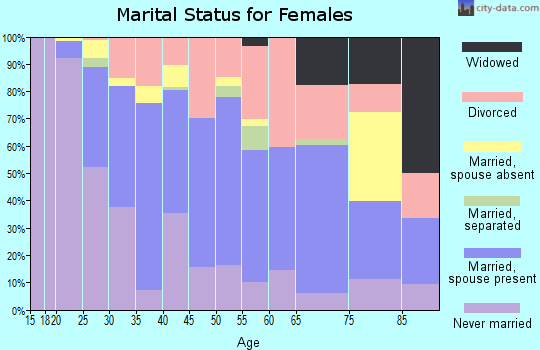
For population 15 years and over in 50311:
Never married: 50.5%
Now married: 35.3%
Separated: 1.1%
Widowed: 2.9%
Divorced: 10.3%
Zip code 50311 compared to state average:
Unemployed percentage above state average.
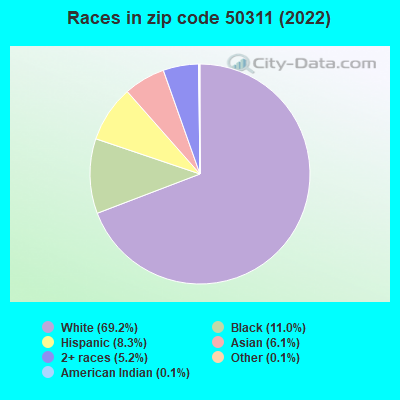
Black race population percentage significantly above state average.
Median age below state average.
Foreign-born population percentage above state average.
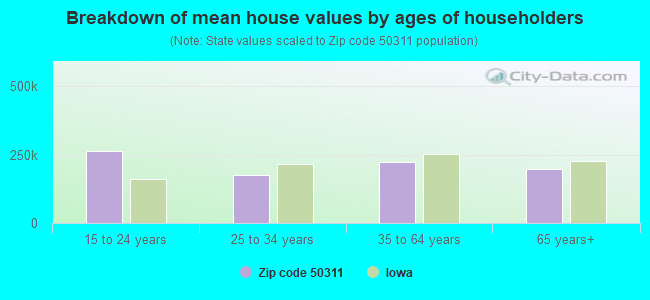
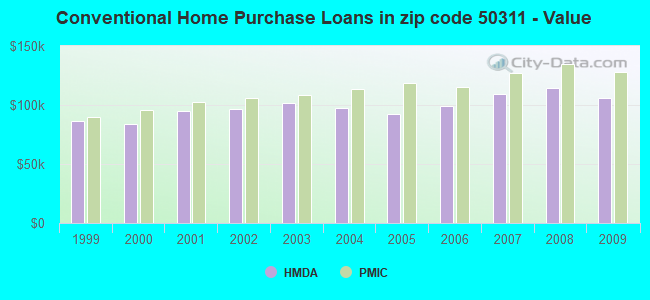
Estimated median house/condo value in 2022: $229,855
50311:
$229,855
Iowa:
$194,600
According to our research of Iowa and other state lists, there were 27 registered sex offenders living in 50311 zip code as of April 27, 2024. The ratio of all residents to sex offenders in zip code 50311 is 581 to 1. The ratio of registered sex offenders to all residents in this zip code is lower than the state average.
Median resident age:
This zip code:
31.6 years
Iowa median age:
38.9 years
Average household size:
This zip code:
2.1 people
Iowa:
2.3 people
Averages for the 2020 tax year for zip code 50311, filed in 2021:
Average Adjusted Gross Income (AGI) in 2020: $55,279 (Individual Income Tax Returns)
Here:
$55,279
State:
$71,087
Salary/wage: $49,572 (reported on 87.2% of returns)
Here:
$49,572
State:
$57,361
(% of AGI for various income ranges: 1146.6% for AGIs below $25k, 3704.8% for AGIs $25k-50k, 6546.1% for AGIs $50k-75k, 9916.5% for AGIs $75k-100k, 18998.5% for AGIs $100k-200k, 49295.0% for AGIs over 200k)
Taxable interest for individuals: $888 (reported on 24.7% of returns)
This zip code:
$888
Iowa:
$1,633
(% of AGI for various income ranges: 13.2% for AGIs below $25k, 15.6% for AGIs $25k-50k, 34.7% for AGIs $50k-75k, 27.3% for AGIs $75k-100k, 72.9% for AGIs $100k-200k, 413.3% for AGIs over 200k)
Ordinary dividends: $3,003 (reported on 17.3% of returns)
Here:
$3,003
State:
$5,432
(% of AGI for various income ranges: 12.2% for AGIs below $25k, 19.8% for AGIs $25k-50k, 69.9% for AGIs $50k-75k, 93.8% for AGIs $75k-100k, 271.5% for AGIs $100k-200k, 1120.0% for AGIs over 200k)
Net capital gain/loss in AGI: +$5,890 (reported on 14.6% of returns)
Here:
+$5,890
State:
+$15,243
(% of AGI for various income ranges: 9.4% for AGIs below $25k, 25.0% for AGIs $25k-50k, 50.1% for AGIs $50k-75k, 170.5% for AGIs $75k-100k, 431.2% for AGIs $100k-200k, 3151.7% for AGIs over 200k)
Profit/loss from business: +$11,901 (reported on 15.6% of returns)
Here:
+$11,901
State:
+$11,763
(% of AGI for various income ranges: 132.4% for AGIs below $25k, 152.0% for AGIs $25k-50k, 204.3% for AGIs $50k-75k, 223.0% for AGIs $75k-100k, 915.6% for AGIs $100k-200k, 1730.0% for AGIs over 200k)
Taxable individual retirement arrangement distribution: $17,512 (reported on 6.9% of returns)
50311:
$17,512
Iowa:
$17,324
(% of AGI for various income ranges: 35.2% for AGIs below $25k, 67.6% for AGIs $25k-50k, 138.3% for AGIs $50k-75k, 384.6% for AGIs $75k-100k, 812.9% for AGIs $100k-200k)
Self-employed (Keogh) retirement plans: $12,533 (reported on 0.5% of returns)
50311:
$12,533
Iowa:
$22,144
(% of AGI for various income ranges: 91.7% for AGIs $100k-200k)
Total itemized deductions: $23,172 (reported on 6.1% of returns)
Here:
$23,172
State:
$33,775
(% of AGI for various income ranges: 31.6% for AGIs below $25k, 56.5% for AGIs $25k-50k, 233.7% for AGIs $50k-75k, 384.1% for AGIs $75k-100k, 705.6% for AGIs $100k-200k, 1783.3% for AGIs over 200k)
Charity contributions: $7,052 (reported on 4.5% of returns)
Here:
$7,052
State:
$13,075
(% of AGI for various income ranges: 9.0% for AGIs $25k-50k, 33.2% for AGIs $50k-75k, 62.4% for AGIs $75k-100k, 211.0% for AGIs $100k-200k, 741.7% for AGIs over 200k)
Taxes paid: $7,697 (reported on 6.1% of returns)
50311:
$7,697
State:
$7,704
(% of AGI for various income ranges: 7.8% for AGIs below $25k, 9.8% for AGIs $25k-50k, 73.7% for AGIs $50k-75k, 152.7% for AGIs $75k-100k, 260.2% for AGIs $100k-200k, 563.3% for AGIs over 200k)
Earned income credit: $1,936 (reported on 16.1% of returns)
Here:
$1,936
State:
$2,195
(% of AGI for various income ranges: 78.2% for AGIs below $25k, 54.0% for AGIs $25k-50k)
Percentage of individuals using paid preparers for their 2020 taxes: 93.3%
Here:
93%
State:
95%
(% for various income ranges: 91.9% for AGIs below $25k, 93.5% for AGIs $25k-50k, 95.0% for AGIs $50k-75k, 92.6% for AGIs $75k-100k, 94.5% for AGIs $100k-200k, 93.3% for AGIs over 200k)
Averages for the 2012 tax year for zip code 50311, filed in 2013:
Average Adjusted Gross Income (AGI) in 2012: $43,207 (Individual Income Tax Returns)
Here:
$43,207
State:
$58,860
Salary/wage: $38,917 (reported on 90.4% of returns)
Here:
$38,917
State:
$46,659
(% of AGI for various income ranges: 82.6% for AGIs below $25k, 87.9% for AGIs $25k-50k, 84.7% for AGIs $50k-75k, 82.6% for AGIs $75k-100k, 79.6% for AGIs $100k-200k, 54.7% for AGIs over 200k)
Taxable interest for individuals: $989 (reported on 25.8% of returns)
This zip code:
$989
Iowa:
$1,537
(% of AGI for various income ranges: 0.7% for AGIs below $25k, 0.4% for AGIs $25k-50k, 0.5% for AGIs $50k-75k, 0.4% for AGIs $75k-100k, 0.6% for AGIs $100k-200k, 1.5% for AGIs over 200k)
Ordinary dividends: $2,857 (reported on 17.5% of returns)
Here:
$2,857
State:
$4,542
(% of AGI for various income ranges: 0.7% for AGIs below $25k, 0.6% for AGIs $25k-50k, 0.8% for AGIs $50k-75k, 0.8% for AGIs $75k-100k, 1.3% for AGIs $100k-200k, 4.9% for AGIs over 200k)
Net capital gain/loss in AGI: +$4,180 (reported on 12.0% of returns)
Here:
+$4,180
State:
+$11,802
(% of AGI for various income ranges: 0.4% for AGIs $50k-75k, 0.5% for AGIs $75k-100k, 1.8% for AGIs $100k-200k, 8.2% for AGIs over 200k)
Profit/loss from business: +$10,800 (reported on 15.4% of returns)
Here:
+$10,800
State:
+$10,509
(% of AGI for various income ranges: 6.9% for AGIs below $25k, 2.7% for AGIs $25k-50k, 3.1% for AGIs $50k-75k, 3.4% for AGIs $75k-100k, 5.6% for AGIs $100k-200k)
Taxable individual retirement arrangement distribution: $12,333 (reported on 6.8% of returns)
50311:
$12,333
Iowa:
$11,773
(% of AGI for various income ranges: 1.8% for AGIs below $25k, 1.3% for AGIs $25k-50k, 1.4% for AGIs $50k-75k, 2.0% for AGIs $75k-100k, 3.8% for AGIs $100k-200k)
Self-employment retirement plans: $14,867 (reported on 0.5% of returns)
50311:
$14,867
Iowa:
$18,614
Total itemized deductions: $16,182 (20% of AGI, reported on 29.8% of returns)
Here:
$16,182
State:
$21,278
Here:
20.4% of AGI
State:
18.9% of AGI
(% of AGI for various income ranges: 7.6% for AGIs below $25k, 8.1% for AGIs $25k-50k, 12.1% for AGIs $50k-75k, 12.8% for AGIs $75k-100k, 13.9% for AGIs $100k-200k, 12.4% for AGIs over 200k)
Charity contributions: $2,727 (reported on 23.0% of returns)
Here:
$2,727
State:
$4,044
(% of AGI for various income ranges: 0.5% for AGIs below $25k, 0.9% for AGIs $25k-50k, 1.4% for AGIs $50k-75k, 1.7% for AGIs $75k-100k, 2.1% for AGIs $100k-200k, 2.7% for AGIs over 200k)
Taxes paid: $6,910 (reported on 29.7% of returns)
50311:
$6,910
State:
$8,846
(% of AGI for various income ranges: 1.7% for AGIs below $25k, 2.8% for AGIs $25k-50k, 4.8% for AGIs $50k-75k, 5.8% for AGIs $75k-100k, 7.1% for AGIs $100k-200k, 6.5% for AGIs over 200k)
Earned income credit: $2,022 (reported on 19.8% of returns)
Here:
$2,022
State:
$2,098
(% of AGI for various income ranges: 5.7% for AGIs below $25k, 1.0% for AGIs $25k-50k)
Percentage of individuals using paid preparers for their 2012 taxes: 49.3%
Here:
49%
State:
65%
(% for various income ranges: 46.4% for AGIs below $25k, 47.3% for AGIs $25k-50k, 54.5% for AGIs $50k-75k, 54.3% for AGIs $75k-100k, 54.3% for AGIs $100k-200k, 71.4% for AGIs over 200k)
Averages for the 2004 tax year for zip code 50311, filed in 2005:
Average Adjusted Gross Income (AGI) in 2004: $39,864 (Individual Income Tax Returns)
Here:
$39,864
State:
$43,875
Salary/wage: $35,834 (reported on 88.2% of returns)
Here:
$35,834
State:
$38,265
(% of AGI for various income ranges: 92.0% for AGIs below $10k, 79.4% for AGIs $10k-25k, 85.7% for AGIs $25k-50k, 82.9% for AGIs $50k-75k, 84.1% for AGIs $75k-100k, 63.6% for AGIs over 100k)
Taxable interest for individuals: $1,618 (reported on 42.1% of returns)
This zip code:
$1,618
Iowa:
$1,768
(% of AGI for various income ranges: 3.5% for AGIs below $10k, 2.3% for AGIs $10k-25k, 1.3% for AGIs $25k-50k, 1.2% for AGIs $50k-75k, 1.2% for AGIs $75k-100k, 2.7% for AGIs over 100k)
Taxable dividends: $2,207 (reported on 25.1% of returns)
Here:
$2,207
State:
$2,510
(% of AGI for various income ranges: 2.7% for AGIs below $10k, 1.4% for AGIs $10k-25k, 0.8% for AGIs $25k-50k, 0.9% for AGIs $50k-75k, 1.1% for AGIs $75k-100k, 2.6% for AGIs over 100k)
Net capital gain/loss: +$4,395 (reported on 18.1% of returns)
Here:
+$4,395
State:
+$6,139
(% of AGI for various income ranges: -0.3% for AGIs below $10k, -0.5% for AGIs $10k-25k, 0.3% for AGIs $25k-50k, 0.9% for AGIs $50k-75k, 1.0% for AGIs $75k-100k, 7.2% for AGIs over 100k)
Profit/loss from business: +$11,112 (reported on 14.5% of returns)
Here:
+$11,112
State:
+$8,574
(% of AGI for various income ranges: 3.7% for AGIs below $10k, 5.5% for AGIs $10k-25k, 3.0% for AGIs $25k-50k, 3.7% for AGIs $50k-75k, 2.5% for AGIs $75k-100k, 6.0% for AGIs over 100k)
IRA payment deduction: $2,886 (reported on 2.6% of returns)
50311:
$2,886
Iowa:
$2,970
(% of AGI for various income ranges: 0.3% for AGIs $10k-25k, 0.3% for AGIs $25k-50k, 0.2% for AGIs $50k-75k, 0.1% for AGIs $75k-100k, 0.1% for AGIs over 100k)
Self-employed pension: $8,971 (reported on 0.9% of returns)
Here:
$8,971
Iowa:
$11,928
(% of AGI for various income ranges: 0.1% for AGIs $25k-50k, 0.1% for AGIs $50k-75k, 0.2% for AGIs $75k-100k, 0.5% for AGIs over 100k)
Total itemized deductions: $14,203 (22% of AGI, reported on 37.6% of returns)
Here:
$14,203
State:
$16,976
Here:
21.6% of AGI
State:
20.8% of AGI
(% of AGI for various income ranges: 11.6% for AGIs below $10k, 11.5% for AGIs $10k-25k, 12.1% for AGIs $25k-50k, 14.3% for AGIs $50k-75k, 15.8% for AGIs $75k-100k, 13.3% for AGIs over 100k)
Charity contributions deductions: $2,306 (3% of AGI, reported on 31.8% of returns)
Here:
$2,306
State:
$3,089
Here:
3.3% of AGI
State:
3.6% of AGI
(% of AGI for various income ranges: 0.7% for AGIs below $10k, 1.1% for AGIs $10k-25k, 1.4% for AGIs $25k-50k, 1.8% for AGIs $50k-75k, 2.3% for AGIs $75k-100k, 2.5% for AGIs over 100k)
Total tax: $5,300 (reported on 77.5% of returns)
50311:
$5,300
State:
$6,177
(% of AGI for various income ranges: 2.1% for AGIs below $10k, 4.7% for AGIs $10k-25k, 7.9% for AGIs $25k-50k, 10.1% for AGIs $50k-75k, 11.0% for AGIs $75k-100k, 16.4% for AGIs over 100k)
Earned income credit: $1,621 (reported on 13.7% of returns)
Here:
$1,621
State:
$1,540
Percentage of individuals using paid preparers for their 2004 taxes: 57.1%
Here:
57%
State:
70%
(% for various income ranges: 47.1% for AGIs below $10k, 60.4% for AGIs $10k-25k, 56.7% for AGIs $25k-50k, 59.8% for AGIs $50k-75k, 58.5% for AGIs $75k-100k, 67.3% for AGIs over 100k)
Likely homosexual households (counted as self-reported same-sex unmarried-partner households)
Lesbian couples: 0.3% of all households
Gay men: 0.6% of all households
Household received Food Stamps/SNAP in the past 12 months: 1,272 Household did not receive Food Stamps/SNAP in the past 12 months: 5,388
Women who had a birth in the past 12 months: 90 (83 now married, 8 unmarried) Women who did not have a birth in the past 12 months: 4,720 (1,442 now married, 3,282 unmarried)
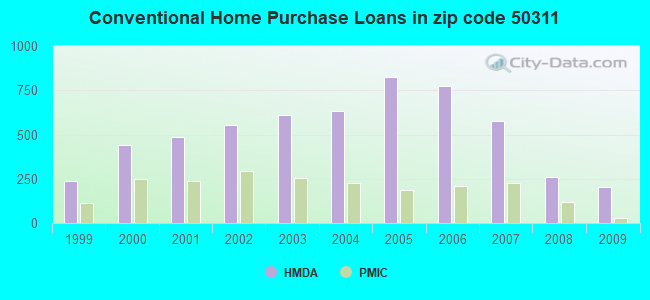
Housing units in zip code 50311 with a mortgage: 2,305 (342 second mortgage, 36 home equity loan, 266 both second mortgage and home equity loan) Houses without a mortgage: 73
Median monthly owner costs for units with a mortgage: $1,514 Median monthly owner costs for units without a mortgage: $706
Residents with income below the poverty level in 2022:
This zip code:
20.7%
Whole state:
11.0%
Residents with income below 50% of the poverty level in 2022:
This zip code:
8.4%
Whole state:
5.5%
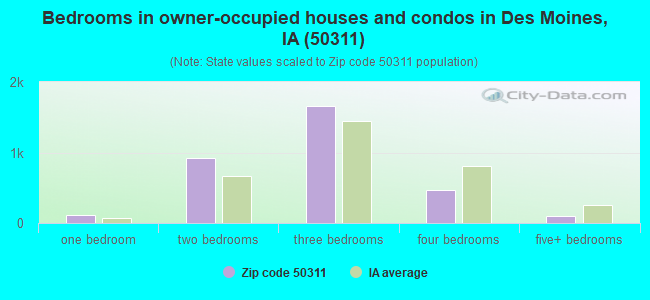
Median number of rooms in houses and condos:
Here:
6.7
State:
6.8
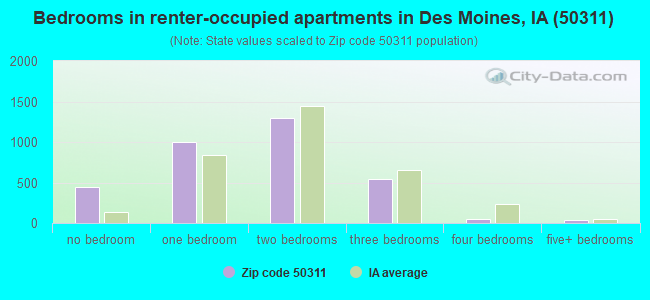
Median number of rooms in apartments:
Here:
4.0
State:
4.2
Notable locations in this zip code not listed on our city pages
Notable locations in zip code 50311: Waveland Golf Course (A), Stainaker Residence Hall (B), Crawford Residence Hall (C), Carpenter Residence Hall (D), Herriott Residence Hall (E), Hubbell Dining Hall (F), Meredith Hall (G), Morgan E Cline Hall of Pharmacy and Science (H), Harvey Ingham Hall (I), Olin Hall (J), Pioneer Greenhouse (K), Fitch Hall (L), Medbury Hall (M), Jewett Residence Hall (N), Scott Chapel (O), Human Resources (P), Career Center (Q), Cartwright Hall (R), Opperman Hall and Law Library (S), Drake University Fieldhouse (T). Display/hide their locations on the map
Churches in zip code 50311 include: Heavenly Temple Church of God (A), Congregation Beth El Jacob (B), Sweet Home Deliverance Church (C), Saint Luke's Episcopal Church (D), Collegiate Church (E), Greek Orthodox Church (F), Friendship Baptist Center (G), Saint Theresa's Catholic Church (H), First Christian Church (I). Display/hide their locations on the map
Parks in zip code 50311 include: Waveland Park (1), Drake Park (2), Helmick Commons (3), Buel Field (4), Drake Stadium (5). Display/hide their locations on the map
1,786 married couples with children.
625 single-parent households (182 men, 443 women).
85.2% of residents of 50311 zip code speak English at home.
6.8% of residents speak Spanish at home (45% very well, 23% well, 17% not well, 15% not at all).
1.5% of residents speak other Indo-European language at home (74% very well, 16% well, 10% not well).
4.1% of residents speak Asian or Pacific Island language at home (19% very well, 26% well, 53% not well, 2% not at all).
2.0% of residents speak other language at home (70% very well, 6% well, 24% not well).
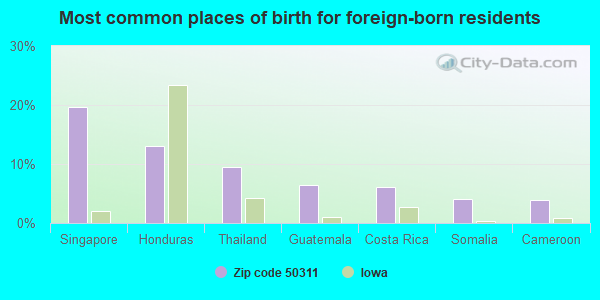
Foreign born population: 1,935 (12.1%) (34.6% of them are naturalized citizens)
This zip code:
12.1%
Whole state:
6.0%
20%Singapore
13%Honduras
9%Thailand
6%Guatemala
6%Costa Rica
4%Somalia
4%Cameroon
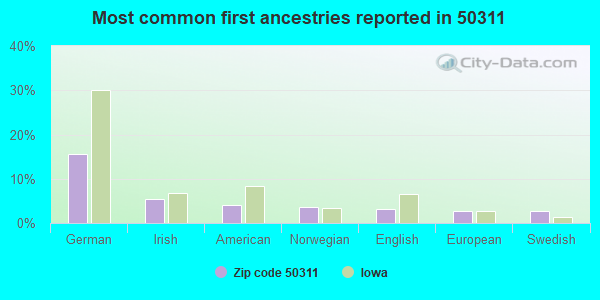
16%German
5%Irish
4%American
4%Norwegian
3%English
3%European
3%Swedish
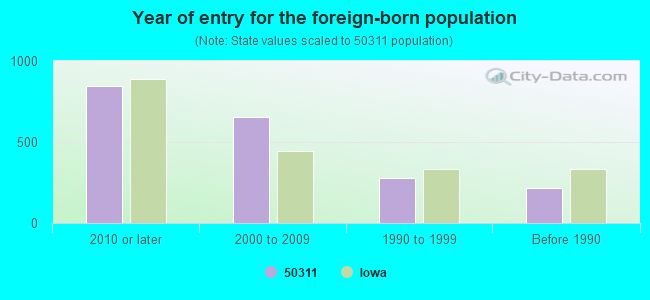
Year of entry for the foreign-born population
8442010 or later
6562000 to 2009
2801990 to 1999
218Before 1990
Major facilities with environmental interests located in this zip code:
DRAKE UNIVERSITY PHYSICAL PLANT (1422 27TH STREET in DES MOINES, IA)
AIR MINOR (AIRS/AFS) AIR SYNTHETIC MINOR (AIRS/AFS) (Integrated Compliance Information System) - ICIS-07-1999-0341, FORMAL ENFORCEMENT ACTION Business SIC classification: COLLEGES, UNIVERSITIES, AND PROFESSIONAL SCHOOLS
COWLES ELEMENTARY SCHOOL (6401 COLLEGE AVE in DES MOINES, IA)
(National Center for Education Statistics) - STATE ID-771737 463 Organizations: DES MOINES INDEPENDENT COMM SCHOOL DISTRICT (SCHOOL DISTRICT)
PERKINS ELEMENTARY SCHOOL (4301 COLLEGE AVE in DES MOINES, IA)
(National Center for Education Statistics) - STATE ID-771737 769 Organizations: DES MOINES INDEPENDENT COMM SCHOOL DISTRICT (SCHOOL DISTRICT)
STEPHEN K BRUCE PROPERTY (1016 24TH ST in DES MOINES, IA)
(Integrated Compliance Information System) - ICIS-07-2004-0007, FORMAL ENFORCEMENT ACTION Business SIC classification: REAL ESTATE AGENTS AND MANAGERS Alternative names: STEPHEN K BRUCE PROPERTY=
BRIGGS CORP-MEEK PRINTING (1371 NE 80TH ST in DES MOINES, IA)
(Resource Conservation and Recovery Act (tracking hazardous waste)) Business NAICS classification: COMMERCIAL LITHOGRAPHIC PRINTING. Organizations: X (CONTACT/OWNER)
Alternative names: MEEK PRINTING CORP
CAMELOT CLEANERS (1100 73RD STREET in DES MOINES, IA)
AIR MINOR (AIRS/AFS) (Resource Conservation and Recovery Act (tracking hazardous waste)) Business SIC classification: DRYCLEANING PLANTS, EXCEPT RUG CLEANING
CITY OF DES MOINES (5641 WINONA in DES MOINES, IA)
AIR MINOR (AIRS/AFS) Business SIC classification: NONCLASSIFIABLE ESTABLISHMENTS
CITY OF DES MOINES (1122 E COUNTY LINE ROAD in DES MOINES, IA)
AIR MINOR (AIRS/AFS) Business SIC classification: NONCLASSIFIABLE ESTABLISHMENTS
MULTIPLEX BUSINESS FORMS (7855 UNIVERSITY in DES MOINES, IA)
Small Quantity Generators, between 100 kg and 1000 kg of hazardous waste/month (Resource Conservation and Recovery Act (tracking hazardous waste)) - notification (Resource Conservation and Recovery Act (tracking hazardous waste)) Organizations: BRIGGS CORP (CONTACT/OWNER)
Alternative names: BRIGGS FORMS AND SUPPLIES-MANUFCTNG DIV
CAMPUS CLEANERS INC (2800 UNIVERSITY in DES MOINES, IA)
AIR SYNTHETIC MINOR (AIRS/AFS) Small Quantity Generators, between 100 kg and 1000 kg of hazardous waste/month (Resource Conservation and Recovery Act (tracking hazardous waste)) - notification Business SIC classification: DRYCLEANING PLANTS, EXCEPT RUG CLEANING Organizations: DRAKE UNIVERSITY (DRAKE REALTY) (CONTACT/OWNER)
CLEANING SHOPPE THE (1171 25 ST. in DES MOINES, IA)
AIR MINOR (AIRS/AFS) Business SIC classification: NONCLASSIFIABLE ESTABLISHMENTS Alternative names: CLOSED FACILITY -- CLEANING SHOPPE THE
DRAKE REFINISHING SHOP (1401 21ST in DES MOINES, IA)
AIR MINOR (AIRS/AFS) Business SIC classification: REUPHOLSTERY AND FURNITURE REPAIR Alternative names: CLOSED FACILITY -- DRAKE REFINISHING SHOP
DRAKE UNIVERSITY (2507 UNIVERSITY AVE in DES MOINES, IA)
HAZARDOUS WASTE BIENNIAL REPORTER (Resource Conservation and Recovery Act (tracking hazardous waste)) Small Quantity Generators, between 100 kg and 1000 kg of hazardous waste/month (Resource Conservation and Recovery Act (tracking hazardous waste)) Organizations: DRAKE UNIVERSITY INC (CONTACT/OPERATOR)
Alternative names: DRAKE UNIVERSITY PHYSICAL PLANT
Housing units lacking complete kitchen facilities: 0.4%
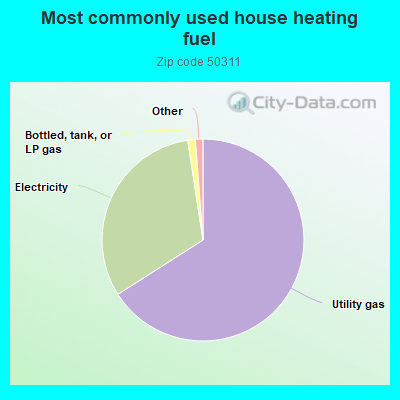
65.9%Utility gas
31.6%Electricity
1.2%Bottled, tank, or LP gas
0.5%Fuel oil, kerosene, etc.
0.5%No fuel used
Population in 1990: 19,816.
Place of birth for U.S.-born residents:
This state: 9,525
Northeast: 262
Midwest: 2,990
South: 446
West: 706
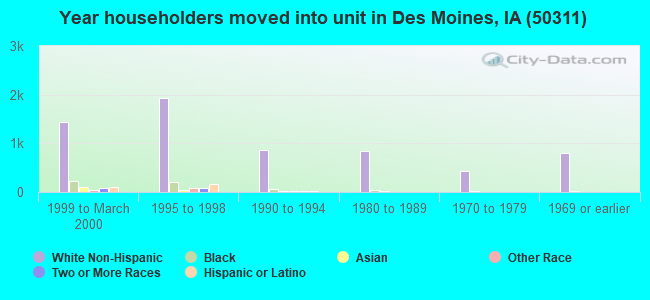
44% of the 50311 zip code residents lived in the same house 5 years ago. Out of people who lived in different houses, 51% lived in this county. Out of people who lived in different counties, 50% lived in Iowa.
84% of the 50311 zip code residents lived in the same house 1 year ago. Out of people who lived in different houses, 79% moved from this county. Out of people who lived in different houses, 8% moved from different county within same state. Out of people who lived in different houses, 8% moved from different state. Out of people who lived in different houses, 0% moved from abroad.
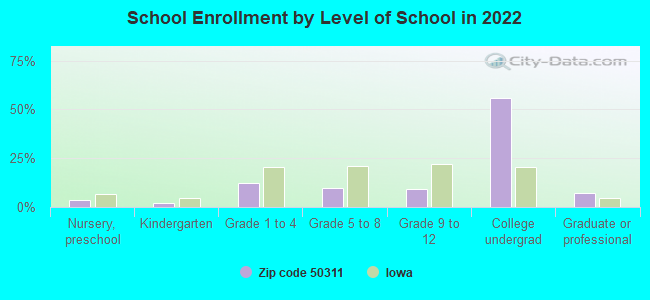
Private vs. public school enrollment:
Students in private schools in grades 1 to 8 (elementary and middle school): 191
Here:
18.4%
Iowa:
10.6%
Students in private schools in grades 9 to 12 (high school): 37
Here:
8.5%
Iowa:
7.9%
Students in private undergraduate colleges: 2,438
Here:
93.4%
Iowa:
23.9%
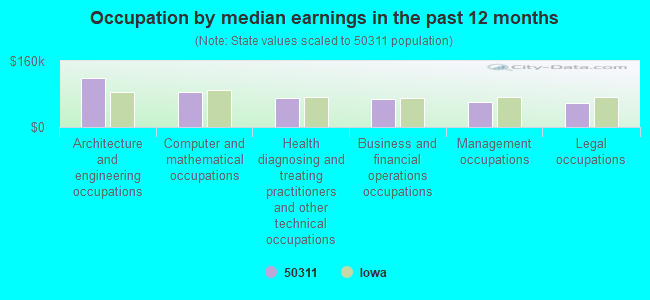
Occupation by median earnings in the past 12 months ($)
119,434Architecture and engineering occupations
84,742Computer and mathematical occupations
69,354Health diagnosing and treating practitioners and other technical occupations
68,269Business and financial operations occupations
60,542Management occupations
59,141Legal occupations
Top industries in this zip code by the number of employees in 2005:
Educational Services: Colleges, Universities, and Professional Schools (over 1000 employees: 1 establishment)
2002 - 2018 National Fire Incident Reporting System (NFIRS) incidents
According to the data from the years 2002 - 2018 the average number of fires per year is 42. The highest number of fire incidents - 82 took place in 2002, and the least - 14 in 2018. The data has a dropping trend.
When looking into fire subcategories, the most reports belonged to: Structure Fires (40.8%), and Outside Fires (30.9%).
Fire incident types reported to NFIRS in Zip Code 50311


 Nearest zip codes: 50312, 50310, 50324, 50314, 50309, 50321.
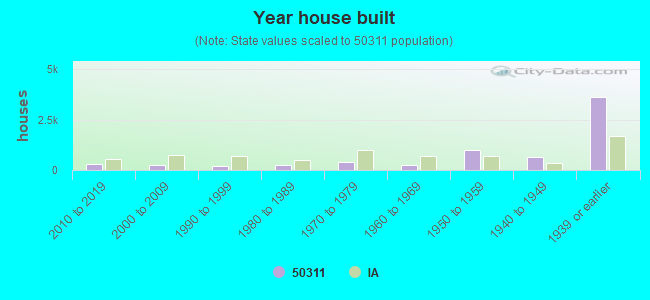


 According to the data from the years 2002 - 2018 the average number of fires per year is 42. The highest number of fire incidents - 82 took place in 2002, and the least - 14 in 2018. The data has a dropping trend.
 When looking into fire subcategories, the most reports belonged to: Structure Fires (40.8%), and Outside Fires (30.9%).