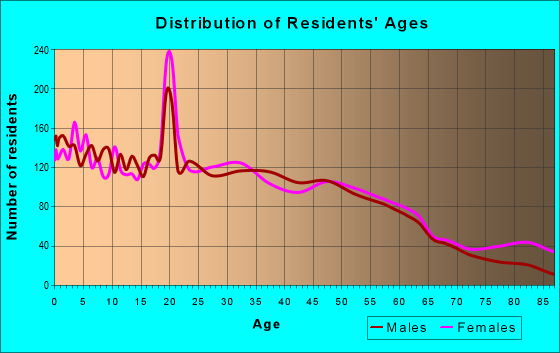
Estimated zip code population in 2022: 16,707 Zip code population in 2010: 16,440 Zip code population in 2000: 16,381
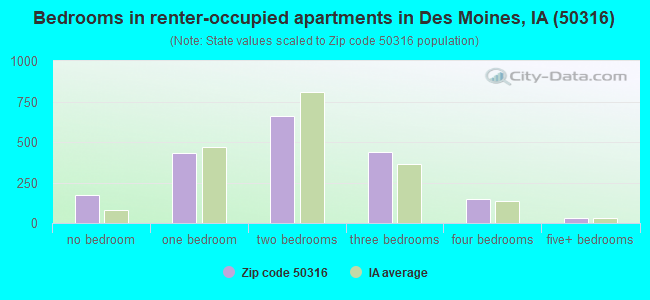
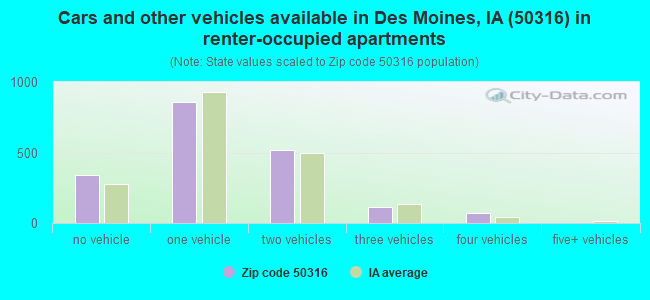
Houses and condos: 6,210 Renter-occupied apartments: 1,903
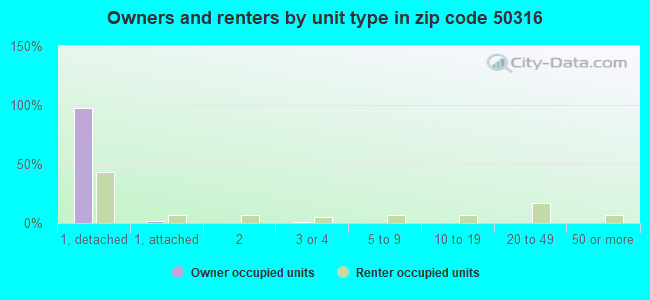
% of renters here:
34%
State:
28%
March 2022 cost of living index in zip code 50316: 89.1 (less than average, U.S. average is 100)
Land area: 3.6 sq. mi. Water area: 0.0 sq. mi.
Population density: 4,696 people per square mile
(average).
OSM Map
General Map
Google Map
MSN Map
OSM Map
General Map
Google Map
MSN Map
OSM Map
General Map
Google Map
MSN Map
OSM Map
General Map
Google Map
MSN Map
Please wait while loading the map...
Real estate property taxes paid for housing units in 2022:
This zip code:
1.7% ($2,333)
Iowa:
1.4% ($2,724)
Median real estate property taxes paid for housing units with mortgages in 2022: $2,497 (1.7%) Median real estate property taxes paid for housing units with no mortgage in 2022: $1,730 (1.6%)
Averages for the 2020 tax year for zip code 50316, filed in 2021:
Average Adjusted Gross Income (AGI) in 2020: $38,494 (Individual Income Tax Returns)
Here:
$38,494
State:
$71,087
Salary/wage: $34,937 (reported on 87.0% of returns)
Here:
$34,937
State:
$57,361
(% of AGI for various income ranges: 1234.6% for AGIs below $25k, 3634.0% for AGIs $25k-50k, 6622.0% for AGIs $50k-75k, 9417.6% for AGIs $75k-100k, 17017.5% for AGIs $100k-200k)
Taxable interest for individuals: $785 (reported on 13.1% of returns)
This zip code:
$785
Iowa:
$1,633
(% of AGI for various income ranges: 3.3% for AGIs below $25k, 4.9% for AGIs $25k-50k, 17.1% for AGIs $50k-75k, 19.7% for AGIs $75k-100k, 221.2% for AGIs $100k-200k)
Ordinary dividends: $2,198 (reported on 5.9% of returns)
Here:
$2,198
State:
$5,432
(% of AGI for various income ranges: 8.4% for AGIs below $25k, 6.1% for AGIs $25k-50k, 29.1% for AGIs $50k-75k, 42.1% for AGIs $75k-100k, 141.9% for AGIs $100k-200k)
Net capital gain/loss in AGI: +$7,411 (reported on 5.0% of returns)
Here:
+$7,411
State:
+$15,243
(% of AGI for various income ranges: 3.4% for AGIs below $25k, 6.3% for AGIs $25k-50k, 26.9% for AGIs $50k-75k, 82.9% for AGIs $75k-100k, 1221.2% for AGIs $100k-200k)
Profit/loss from business: +$10,839 (reported on 13.1% of returns)
Here:
+$10,839
State:
+$11,763
(% of AGI for various income ranges: 158.5% for AGIs below $25k, 137.6% for AGIs $25k-50k, 235.4% for AGIs $50k-75k, 310.9% for AGIs $75k-100k, 560.0% for AGIs $100k-200k)
Taxable individual retirement arrangement distribution: $11,236 (reported on 3.5% of returns)
50316:
$11,236
Iowa:
$17,324
(% of AGI for various income ranges: 23.7% for AGIs below $25k, 29.9% for AGIs $25k-50k, 98.6% for AGIs $50k-75k, 106.5% for AGIs $75k-100k, 301.2% for AGIs $100k-200k)
Total itemized deductions: $28,575 (reported on 2.2% of returns)
Here:
$28,575
State:
$33,775
(% of AGI for various income ranges: 82.3% for AGIs $25k-50k, 101.5% for AGIs $50k-75k, 181.8% for AGIs $75k-100k, 856.2% for AGIs $100k-200k)
Charity contributions: $6,010 (reported on 1.4% of returns)
Here:
$6,010
State:
$13,075
(% of AGI for various income ranges: 3.8% for AGIs $25k-50k, 31.9% for AGIs $50k-75k, 156.9% for AGIs $100k-200k)
Taxes paid: $5,900 (reported on 2.1% of returns)
50316:
$5,900
State:
$7,704
(% of AGI for various income ranges: 9.4% for AGIs $25k-50k, 21.5% for AGIs $50k-75k, 54.7% for AGIs $75k-100k, 199.4% for AGIs $100k-200k)
Earned income credit: $2,397 (reported on 24.6% of returns)
Here:
$2,397
State:
$2,195
(% of AGI for various income ranges: 117.0% for AGIs below $25k, 82.2% for AGIs $25k-50k, 2.5% for AGIs $50k-75k)
Percentage of individuals using paid preparers for their 2020 taxes: 93.3%
Here:
93%
State:
95%
(% for various income ranges: 92.8% for AGIs below $25k, 93.3% for AGIs $25k-50k, 93.8% for AGIs $50k-75k, 95.6% for AGIs $75k-100k, 100.0% for AGIs $100k-200k, 0.0% for AGIs over 200k)
Averages for the 2012 tax year for zip code 50316, filed in 2013:
Average Adjusted Gross Income (AGI) in 2012: $32,230 (Individual Income Tax Returns)
Here:
$32,230
State:
$58,860
Salary/wage: $29,580 (reported on 89.3% of returns)
Here:
$29,580
State:
$46,659
(% of AGI for various income ranges: 79.6% for AGIs below $25k, 86.8% for AGIs $25k-50k, 82.3% for AGIs $50k-75k, 80.9% for AGIs $75k-100k, 65.8% for AGIs $100k-200k)
Taxable interest for individuals: $770 (reported on 16.3% of returns)
This zip code:
$770
Iowa:
$1,537
(% of AGI for various income ranges: 0.5% for AGIs below $25k, 0.3% for AGIs $25k-50k, 0.4% for AGIs $50k-75k, 0.3% for AGIs $75k-100k, 0.9% for AGIs $100k-200k)
Ordinary dividends: $2,732 (reported on 7.0% of returns)
Here:
$2,732
State:
$4,542
(% of AGI for various income ranges: 0.4% for AGIs below $25k, 0.4% for AGIs $25k-50k, 0.6% for AGIs $50k-75k, 0.6% for AGIs $75k-100k, 2.2% for AGIs $100k-200k)
Net capital gain/loss in AGI: +$1,047 (reported on 4.7% of returns)
Here:
+$1,047
State:
+$11,802
(% of AGI for various income ranges: 0.2% for AGIs $25k-50k, 0.2% for AGIs $50k-75k, 0.7% for AGIs $100k-200k)
Profit/loss from business: +$9,038 (reported on 11.3% of returns)
Here:
+$9,038
State:
+$10,509
(% of AGI for various income ranges: 6.8% for AGIs below $25k, 1.9% for AGIs $25k-50k, 2.1% for AGIs $50k-75k, 4.9% for AGIs $75k-100k)
Taxable individual retirement arrangement distribution: $8,581 (reported on 5.3% of returns)
50316:
$8,581
Iowa:
$11,773
(% of AGI for various income ranges: 1.5% for AGIs below $25k, 0.9% for AGIs $25k-50k, 1.3% for AGIs $50k-75k, 3.8% for AGIs $75k-100k)
Total itemized deductions: $14,068 (26% of AGI, reported on 19.4% of returns)
Here:
$14,068
State:
$21,278
Here:
25.5% of AGI
State:
18.9% of AGI
(% of AGI for various income ranges: 5.4% for AGIs below $25k, 7.0% for AGIs $25k-50k, 10.0% for AGIs $50k-75k, 10.8% for AGIs $75k-100k, 14.9% for AGIs $100k-200k)
Charity contributions: $2,185 (reported on 12.9% of returns)
Here:
$2,185
State:
$4,044
(% of AGI for various income ranges: 0.4% for AGIs below $25k, 0.6% for AGIs $25k-50k, 1.3% for AGIs $50k-75k, 1.2% for AGIs $75k-100k, 1.4% for AGIs $100k-200k)
Taxes paid: $4,666 (reported on 19.1% of returns)
50316:
$4,666
State:
$8,846
(% of AGI for various income ranges: 1.0% for AGIs below $25k, 2.0% for AGIs $25k-50k, 3.4% for AGIs $50k-75k, 4.2% for AGIs $75k-100k, 6.5% for AGIs $100k-200k)
Earned income credit: $2,467 (reported on 28.9% of returns)
Here:
$2,467
State:
$2,098
(% of AGI for various income ranges: 8.6% for AGIs below $25k, 1.4% for AGIs $25k-50k)
Percentage of individuals using paid preparers for their 2012 taxes: 54.8%
Here:
55%
State:
65%
(% for various income ranges: 53.9% for AGIs below $25k, 54.5% for AGIs $25k-50k, 57.0% for AGIs $50k-75k, 55.9% for AGIs $75k-100k, 66.7% for AGIs $100k-200k)
Averages for the 2004 tax year for zip code 50316, filed in 2005:
Average Adjusted Gross Income (AGI) in 2004: $29,135 (Individual Income Tax Returns)
Here:
$29,135
State:
$43,875
Salary/wage: $27,738 (reported on 90.4% of returns)
Here:
$27,738
State:
$38,265
(% of AGI for various income ranges: 85.3% for AGIs below $10k, 84.0% for AGIs $10k-25k, 89.5% for AGIs $25k-50k, 87.5% for AGIs $50k-75k, 86.5% for AGIs $75k-100k, 58.9% for AGIs over 100k)
Taxable interest for individuals: $899 (reported on 26.1% of returns)
This zip code:
$899
Iowa:
$1,768
(% of AGI for various income ranges: 1.9% for AGIs below $10k, 1.0% for AGIs $10k-25k, 0.8% for AGIs $25k-50k, 0.6% for AGIs $50k-75k, 0.7% for AGIs $75k-100k, 0.5% for AGIs over 100k)
Taxable dividends: $940 (reported on 10.2% of returns)
Here:
$940
State:
$2,510
(% of AGI for various income ranges: 1.1% for AGIs below $10k, 0.3% for AGIs $10k-25k, 0.3% for AGIs $25k-50k, 0.4% for AGIs $50k-75k, 0.2% for AGIs $75k-100k, 0.2% for AGIs over 100k)
Net capital gain/loss: +$1,511 (reported on 6.5% of returns)
Here:
+$1,511
State:
+$6,139
(% of AGI for various income ranges: -0.4% for AGIs below $10k, -0.0% for AGIs $10k-25k, 0.2% for AGIs $25k-50k, 0.4% for AGIs $50k-75k, 1.7% for AGIs $75k-100k)
Profit/loss from business: +$5,860 (reported on 8.9% of returns)
Here:
+$5,860
State:
+$8,574
(% of AGI for various income ranges: 5.7% for AGIs below $10k, 3.1% for AGIs $10k-25k, 1.4% for AGIs $25k-50k, 1.7% for AGIs $50k-75k, 0.4% for AGIs $75k-100k)
IRA payment deduction: $2,205 (reported on 1.4% of returns)
50316:
$2,205
Iowa:
$2,970
Total itemized deductions: $12,386 (26% of AGI, reported on 24.4% of returns)
Here:
$12,386
State:
$16,976
Here:
25.8% of AGI
State:
20.8% of AGI
(% of AGI for various income ranges: 6.2% for AGIs below $10k, 6.6% for AGIs $10k-25k, 9.3% for AGIs $25k-50k, 11.6% for AGIs $50k-75k, 14.5% for AGIs $75k-100k, 24.1% for AGIs over 100k)
Charity contributions deductions: $1,752 (3% of AGI, reported on 18.9% of returns)
Here:
$1,752
State:
$3,089
Here:
3.5% of AGI
State:
3.6% of AGI
(% of AGI for various income ranges: 0.3% for AGIs below $10k, 0.9% for AGIs $10k-25k, 1.0% for AGIs $25k-50k, 1.3% for AGIs $50k-75k, 1.6% for AGIs $75k-100k, 1.8% for AGIs over 100k)
Total tax: $3,000 (reported on 68.0% of returns)
50316:
$3,000
State:
$6,177
(% of AGI for various income ranges: 1.6% for AGIs below $10k, 3.5% for AGIs $10k-25k, 6.5% for AGIs $25k-50k, 8.8% for AGIs $50k-75k, 10.3% for AGIs $75k-100k, 14.5% for AGIs over 100k)
Earned income credit: $1,766 (reported on 24.6% of returns)
Here:
$1,766
State:
$1,540
Percentage of individuals using paid preparers for their 2004 taxes: 61.9%
Here:
62%
State:
70%
(% for various income ranges: 57.9% for AGIs below $10k, 65.0% for AGIs $10k-25k, 61.1% for AGIs $25k-50k, 61.5% for AGIs $50k-75k, 62.4% for AGIs $75k-100k, 71.4% for AGIs over 100k)
Likely homosexual households (counted as self-reported same-sex unmarried-partner households)
Lesbian couples: 0.0% of all households
Gay men: 0.6% of all households
Household received Food Stamps/SNAP in the past 12 months: 1,292 Household did not receive Food Stamps/SNAP in the past 12 months: 4,298
Women who had a birth in the past 12 months: 205 (97 now married, 102 unmarried) Women who did not have a birth in the past 12 months: 3,767 (1,212 now married, 2,557 unmarried)
Housing units in zip code 50316 with a mortgage: 2,707 (241 second mortgage, 174 both second mortgage and home equity loan) Houses without a mortgage: 51
Median monthly owner costs for units with a mortgage: $1,139 Median monthly owner costs for units without a mortgage: $481
Residents with income below the poverty level in 2022:
This zip code:
21.6%
Whole state:
11.0%
Residents with income below 50% of the poverty level in 2022:
This zip code:
12.2%
Whole state:
5.5%
Median number of rooms in houses and condos:
Here:
5.8
State:
6.8
Median number of rooms in apartments:
Here:
4.5
State:
4.2
Notable locations in this zip code not listed on our city pages
Notable locations in zip code 50316: Ash Field (A), Des Moines Fire and Rescue Department Station 2 (B), Des Moines Fire and Rescue Department Station 7 (C), Student Center Bookstore (D), Knudson Hall (E), Nielsen Hall (F), Johnson Wellness Center (G), Lubrs Athletic Complex (H), Grand View College Library (I), Cowles Communication Center (J), Krumm Business Center (K), Holy Grounds Coffee House (L), Maintenance Building (M), History / Political Science House (N), Classroom Annex (O), Humphrey Center (P), Pettit Building (Q), Grand View Hall (R), Viking House (S), Faculty Office Building (T). Display/hide their locations on the map
Churches in zip code 50316 include: Union Park Baptist Church (A), Penn Avenue Church of God (B), Asian Church of the Open Bible (C), Lighthouse Full Gospel Baptist Church (D), Greater Love Church of God (E), Visitation Catholic Church (F), Philadelphia Seventh Day Adventist Church (G), Union Park Christian Church (H), Korean United Methodist Church (I). Display/hide their locations on the map
Parks in zip code 50316 include: Burke Memorial Park (1), Stewart Square (2), Union Park (3), M L King Park (4), Heritage Carousel of Des Moines (5), Des Moines Botanical Garden (6), Here Passed the Dragoon Trail Historical Marker (7), Site of Old Fort Des Moines Historical Marker (8), Ida B Wise Smith State Historical Marker (9). Display/hide their locations on the map
Tourist attractions (not listed on the city page) : La Bufa (Cultural Attractions- Events- & Facilities; 1604 East Grand Avenue), Moss Distributing (Amusement & Theme Parks; 1801 Guthrie Avenue).
2,201 married couples with children.
1,702 single-parent households (316 men, 1,386 women).
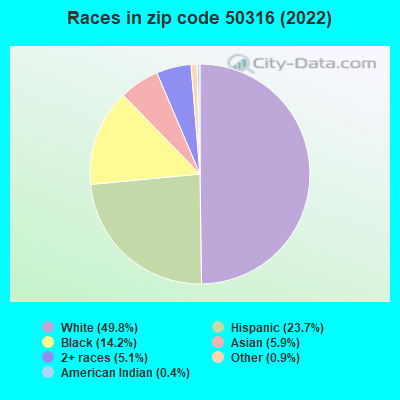
72.1% of residents of 50316 zip code speak English at home.
18.3% of residents speak Spanish at home (61% very well, 15% well, 18% not well, 6% not at all).
1.1% of residents speak other Indo-European language at home (68% very well, 13% well, 19% not well).
5.0% of residents speak Asian or Pacific Island language at home (36% very well, 12% well, 44% not well, 9% not at all).
3.5% of residents speak other language at home (53% very well, 26% well, 17% not well, 3% not at all).
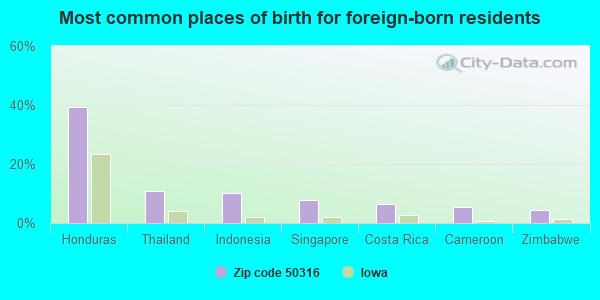
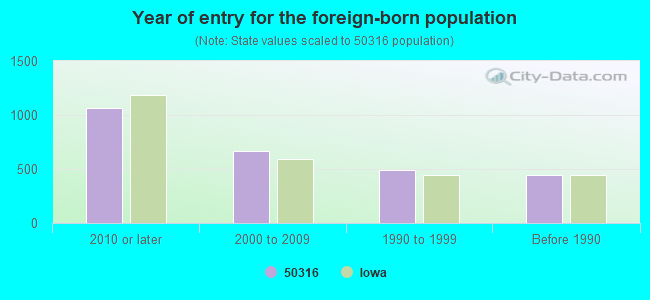
Foreign born population: 2,469 (14.8%) (36.0% of them are naturalized citizens)
Major facilities with environmental interests located in this zip code:
AMERICAN CONCRETE PRODUCTS (1626 STEWART STREET in DES MOINES, IA)
AIR MINOR (AIRS/AFS) (Resource Conservation and Recovery Act (tracking hazardous waste)) TRI REPORTER (Tracking of toxic chemicals releasing facilities) Business SIC classification: READY-MIXED CONCRETE Organizations: NUCKOLLS CONCRETE SERVICES (CONTACT/OWNER)
Alternative names: AMERICAN CONCRETE INC, V O CONCRETE CO
EAST HIGH SCHOOL (815 E 13TH ST in DES MOINES, IA)
(Geographic Names Information System) (National Center for Education Statistics) - STATE ID-771737 109 Conditionally Exempt Small Quantity Generators, less than 100 kg/month of hazardous waste (Resource Conservation and Recovery Act (tracking hazardous waste)) Organizations: DES MOINES PUBLIC SCHOOLS (CONTACT/OPERATOR)
, DES MOINES INDEPENDENT COMM SCHOOL DISTRICT (SCHOOL DISTRICT)
CHROME REFLECTIONS (1930 EASTON BOULEVARD in DES MOINES, IA)
AIR SYNTHETIC MINOR (AIRS/AFS) (Integrated Compliance Information System) - ICIS-07-2002-0009, FORMAL ENFORCEMENT ACTION National Pollutant Discharge Elimination System NON-MAJOR (Tracking pollutant discharge elimination systems) - permit Business SIC classification: ELECTROPLATING, PLATING, POLISHING, ANODIZING, AND COLORING
RONS AUTO SALVAGE (1625 DIXON STREET in DES MOINES, IA)
AIR MINOR (AIRS/AFS) (Integrated Compliance Information System) - ICIS-07-1996-0298, FORMAL ENFORCEMENT ACTION COMPLIANCE ACTIVITY (Tracking inspections of insecticide, fungicide, and rodenticide, and toxic substances) Business SIC classification: MOTOR VEHICLE PARTS, USED
HIATT MIDDLE SCHOOL (1214 E 15TH ST in DES MOINES, IA)
(National Center for Education Statistics) - STATE ID-771737 245 Conditionally Exempt Small Quantity Generators, less than 100 kg/month of hazardous waste (Resource Conservation and Recovery Act (tracking hazardous waste)) Organizations: DES MOINES PUBLIC SCHOOLS (CONTACT/OPERATOR)
, DES MOINES INDEPENDENT COMM SCHOOL DISTRICT (SCHOOL DISTRICT)
SMITTYS AUTO PARTS INCORPORATED (1636 DE WOLF STREET in DES MOINES, IA)
AIR MINOR (AIRS/AFS) (Integrated Compliance Information System) - ICIS-07-2002-0113, FORMAL ENFORCEMENT ACTION Business SIC classification: MOTOR VEHICLE SUPPLIES AND NEW PARTS Alternative names: SMITTY'S AUTO SALVAGE
SENECA CORPORATION/NW ERECTION SERVICES (5636 NE 17TH ST in DES MOINES, IA)
(Integrated Compliance Information System) - ICIS-07-1993-0277, FORMAL ENFORCEMENT ACTION TSD (Resource Conservation and Recovery Act (tracking hazardous waste)) Organizations: C & S PROPERTIES (CONTACT/OWNER)
ARCHER DANIELS MIDLAND MILLING COMPANY (1925 E GRAND AVE in DES MOINES, IA)
AIR SYNTHETIC MINOR (AIRS/AFS) COMPLIANCE ACTIVITY (Tracking inspections of insecticide, fungicide, and rodenticide, and toxic substances) (Resource Conservation and Recovery Act (tracking hazardous waste)) Business SIC classification: FLOUR AND OTHER GRAIN MILL PRODUCTS Organizations: ADM MILLING CO (CONTACT/OPERATOR)
Alternative names: A D M MILLING CO, ADM MILLING CO, CLOSED FACILITY -- ARCHER DANIELS MIDLAND MILLING COMPANY
CAL WESTRN PKG/SUPERIOR CONT CORP/BECKER (1621 EAST AURORA AVENUE in DES MOINES, IA)
(Resource Conservation and Recovery Act (tracking hazardous waste)) Business NAICS classification: FOOD PRODUCT MACHINERY MANUFACTURING. Organizations: DAVE BOWMAN (CONTACT/OPERATOR)
, JIM PHELPS (CONTACT/OWNER)
, CAL WESTERN PACKAGING CORP (CONTACT/OWNER)
Alternative names: CAL WESTERN PACKAGING CORP
APPLE AUTO BODY (1700 E COURT in DES MOINES, IA)
AIR MINOR (AIRS/AFS) (Resource Conservation and Recovery Act (tracking hazardous waste)) Business SIC classification: TOP, BODY, AND UPHOLSTERY REPAIR SHOPS AND PAINT SHOPS Organizations: ROLLIN MOTOR INC & APPLE AUTO BODY INC (CONTACT/OWNER)
Alternative names: CLOSED FACILITY -- APPLE AUTO BODY, ROLLIN MOTOR INC/APPLE AUTO BODY INC, ROLLIN MOTOR INC-FORMER SITE OF
CAPITOL VIEW ELEMENTARY SCHOOL (320 E. 16TH in DES MOINES, IA)
(National Center for Education Statistics) - STATE ID-771737 427 Organizations: DES MOINES INDEPENDENT COMM SCHOOL DISTRICT (SCHOOL DISTRICT)
CATTELL ELEMENTARY SCHOOL (3101 E 12TH ST in DES MOINES, IA)
(National Center for Education Statistics) - STATE ID-771737 445 Organizations: DES MOINES INDEPENDENT COMM SCHOOL DISTRICT (SCHOOL DISTRICT)
NAMASCO CORPORATION (3212 E 19TH CT in DES MOINES, IA)
(Resource Conservation and Recovery Act (tracking hazardous waste)) Conditionally Exempt Small Quantity Generators, less than 100 kg/month of hazardous waste (Resource Conservation and Recovery Act (tracking hazardous waste)) - notification Business NAICS classification: FABRICATED STRUCTURAL METAL MANUFACTURING.
Housing units lacking complete plumbing facilities: 0.8% Housing units lacking complete kitchen facilities: 1.1%
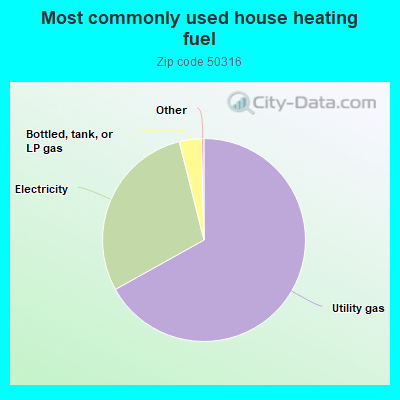
66.9%Utility gas
29.2%Electricity
3.5%Bottled, tank, or LP gas
Population in 1990: 16,359. Population change in the 1990s: +22 (+0.1%).
Place of birth for U.S.-born residents:
This state: 11,166
Northeast: 217
Midwest: 1,233
South: 607
West: 877
49% of the 50316 zip code residents lived in the same house 5 years ago. Out of people who lived in different houses, 70% lived in this county. Out of people who lived in different counties, 50% lived in Iowa.
87% of the 50316 zip code residents lived in the same house 1 year ago. Out of people who lived in different houses, 70% moved from this county. Out of people who lived in different houses, 12% moved from different county within same state. Out of people who lived in different houses, 13% moved from different state. Out of people who lived in different houses, 2% moved from abroad.
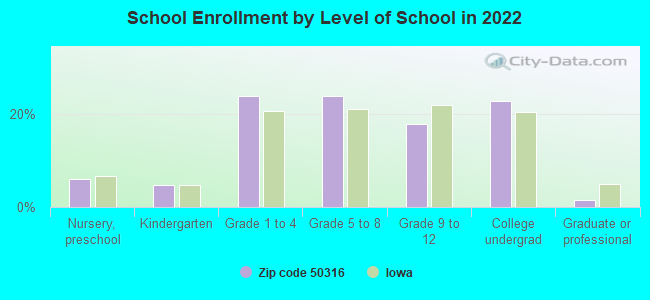
Private vs. public school enrollment:
Students in private schools in grades 1 to 8 (elementary and middle school): 84
Here:
3.7%
Iowa:
10.6%
Students in private schools in grades 9 to 12 (high school): 38
Here:
4.5%
Iowa:
7.9%
Students in private undergraduate colleges: 698
Here:
62.5%
Iowa:
23.9%
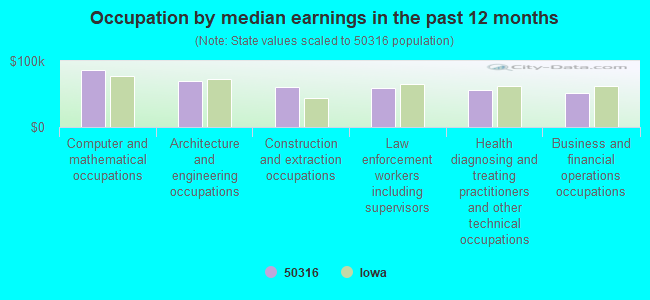
Occupation by median earnings in the past 12 months ($)
86,430Computer and mathematical occupations
70,102Architecture and engineering occupations
60,102Construction and extraction occupations
59,378Law enforcement workers including supervisors
55,315Health diagnosing and treating practitioners and other technical occupations
51,766Business and financial operations occupations
Companies with biggest federal contracts located in this zip code (DES MOINES, IA):
OLDCASTLE IOWA,INC (5550 NE 22ND STREET) : $792,668 in 34 contractsfrom 2001 to 2006
Contracts for Construction of Structures and Facilities -- Parking Facilities Conservation, Maintenance, Repair or Alteration of Real Property -- Other Non-Building Facilities, Maintenance, Repair or Alteration of Real Property -- Highways, Roads, Streets, Bridges, and Railways (includes resurfacing), Maintenance, Repair or Alteration of Real Property -- Office Buildings by Army, U.S. Army Corps of Engineers - civil program financing only Signed by year:2000: $0; 2001: $26,390; 2002: $99,787; 2003: $23,405; 2004: $203,245; 2005: $368,920; 2006: $70,921.
Biggest contracts:
$117,896 with Army for Construction of Structures and Facilities -- Parking Facilities Conservation. Signed on 2005-08-03. Completion date: 2005-09-26.
$117,896 with U.S. Army Corps of Engineers - civil program financing only for Construction of Structures and Facilities -- Parking Facilities Conservation. Signed on 2005-08-03. Completion date: 2005-09-26.
$70,921 with Army for Maintenance, Repair or Alteration of Real Property -- Other Non-Building Facilities. Signed on 2006-06-29. Completion date: 2006-09-08.
$64,033 with U.S. Army Corps of Engineers - civil program financing only for Maintenance, Repair or Alteration of Real Property -- Other Non-Building Facilities. Signed on 2002-08-13. Completion date: 2002-12-11.
VAN METER INDUSTRIAL UNC (1751 GUTHRIE AVE) : $90,462 in 6 contractsfrom 2004 to 2005
Contracts for Electrical Hardware and Supplies by Army, U.S. Army Corps of Engineers - civil program financing only Signed by year:2000: $0; 2001: $0; 2002: $0; 2003: $0; 2004: $57,502; 2005: $32,960; 2006: $0.
Biggest contracts:
$24,869 with Army for Electrical Hardware and Supplies. Signed on 2004-09-08. Completion date: 2004-09-30.
$24,869 with U.S. Army Corps of Engineers - civil program financing only for Electrical Hardware and Supplies. Signed on 2004-09-08. Completion date: 2004-09-30.
$16,480, same as above.Signed on 2005-03-07. Completion date: 2005-03-31.
$16,480 with Army for Electrical Hardware and Supplies. Signed on 2005-03-07. Completion date: 2005-03-31.
HELEN MATTHEWS (1411 HENDERSON AVE 0N) : $76,910 in 7 contractsfrom 2002 to 2005
Contracts for Custodial Janitorial Services by U.S. Army Corps of Engineers - civil program financing only, Army Signed by year:2000: $0; 2001: $0; 2002: $10,540; 2003: $11,160; 2004: $25,800; 2005: $29,410; 2006: $0.
Biggest contracts:
$14,705 with U.S. Army Corps of Engineers - civil program financing only for Custodial Janitorial Services. Signed on 2005-03-02. Completion date: 2005-02-28.
$14,705 with Army for Custodial Janitorial Services. Signed on 2005-03-02. Completion date: 2005-02-28.
$12,900, same as above.Signed on 2004-02-11. Completion date: 2005-02-28.
$12,900 with U.S. Army Corps of Engineers - civil program financing only for Custodial Janitorial Services. Signed on 2004-02-11. Completion date: 2005-02-28.
TAYLOR INDUSTRIES, INC (1533 E EUCLID AVE; small business)
$50,606 with Army for Maintenance, Repair or Alteration of Real Property -- Office Buildings. Signed on 2001-09-26. Completion date: 2001-12-30.
AMERICAN SAFETY OPTICS (1633 DEWOLF ST; small business)
$44,100 with Army for Individual Equipment. Taking place in NE. Signed on 2003-07-18. Completion date: 2003-08-11.
TRANS IOWA LLC (1710 GUTHRIE AVE STE V; small business) : $20,769 in 2 contractsfrom 2003 to 2004
$17,169 with Department of Veterans Affairs for Taxicab Services. Signed on 2003-06-15. Completion date: 2008-05-15.
$3,600 with Army for Taxicab Services. Signed on 2004-11-19. Completion date: 2005-11-30.
GRAND VIEW COLLEGE (1200 GRANDVIEW AVE) : $19,790 in 2 contractsfrom 2004 to 2006
$14,740 with Army for Educational Services. Signed on 2004-09-23. Completion date: 2004-09-23.
$5,050 with Army for Education Services. Signed on 2006-04-28. Completion date: 2006-04-28.
CONSOLIDATED ELECTRICAL DISTRI (1901 E UNIVERSITY AVE; small business) : $17,035 in 2 contractsin 2005
$16,405 with Army for Electrical Hardware and Supplies. Signed on 2005-08-18. Completion date: 2005-09-06.
$630, same as above.Signed on 2005-09-09. Completion date: 2005-09-06.
PEERLESS SUPPLY INC (1701 GUTHRIE AVE; small business)
$12,076 with Army for Hardware, Commercial. Signed on 2006-06-01. Completion date: 2006-07-05.
MIDWEST WHEEL & RIM CO (1436 E OVID)
$11,198 with Army for Vehicular Brake, Steering, Axle, Wheel, and Track Components. Signed on 2004-01-20. Completion date: 2004-02-12.
Top industries in this zip code by the number of employees in 2005:
Health Care and Social Assistance: General Medical and Surgical Hospitals (over 1000 employees: 1 establishment)
Administrative and Support and Waste Management and Remediation Services: Employment Placement Agencies (500-999: 1)
Educational Services: Colleges, Universities, and Professional Schools (500-999: 1)
Health Care and Social Assistance: Nursing Care Facilities (100-249: 1, 50-99: 2)
2002 - 2018 National Fire Incident Reporting System (NFIRS) incidents
Based on the data from the years 2002 - 2018 the average number of fire incidents per year is 64. The highest number of reported fires - 104 took place in 2003, and the least - 31 in 2018. The data has a declining trend.
When looking into fire subcategories, the most reports belonged to: Structure Fires (36.4%), and Outside Fires (35.3%).
Fire incident types reported to NFIRS in Zip Code 50316


 Nearest zip codes: 50319, 50314, 50309, 50313, 50317, 50315.
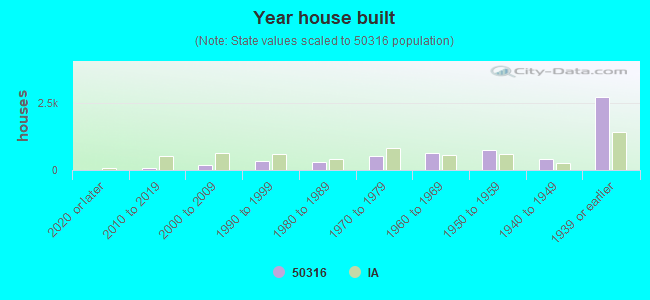


 Based on the data from the years 2002 - 2018 the average number of fire incidents per year is 64. The highest number of reported fires - 104 took place in 2003, and the least - 31 in 2018. The data has a declining trend.
 When looking into fire subcategories, the most reports belonged to: Structure Fires (36.4%), and Outside Fires (35.3%).