Estimated zip code population in 2022: 1,965 Zip code population in 2010: 1,989 Zip code population in 2000: 2,190
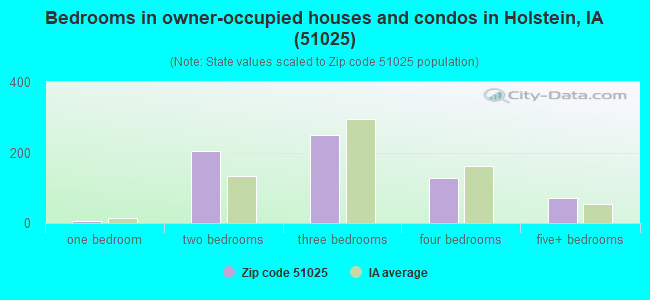
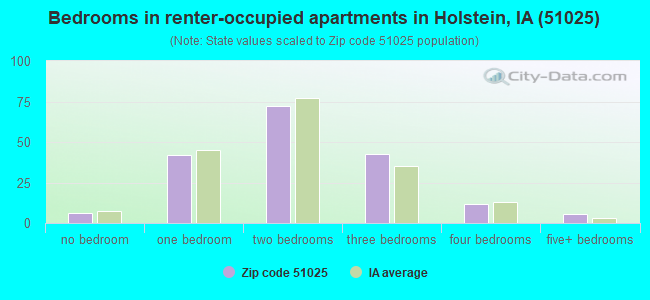
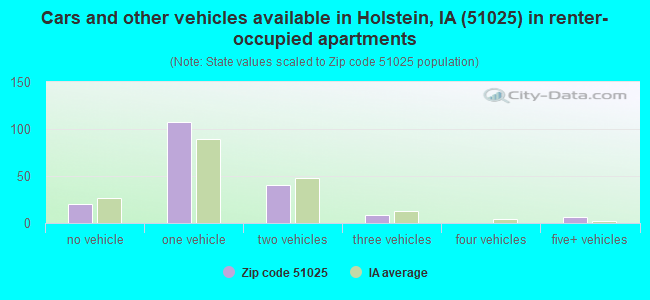
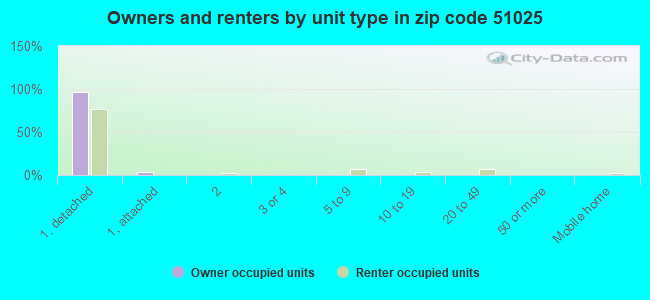
Houses and condos: 877 Renter-occupied apartments: 181
% of renters here:
22%
State:
28%
March 2022 cost of living index in zip code 51025: 82.3 (low, U.S. average is 100)
Land area: 107.5 sq. mi. Water area: 0.0 sq. mi.
Population density: 18 people per square mile
(very low).
OSM Map
General Map
Google Map
MSN Map
OSM Map
General Map
Google Map
MSN Map
OSM Map
General Map
Google Map
MSN Map
OSM Map
General Map
Google Map
MSN Map
Please wait while loading the map...
Real estate property taxes paid for housing units in 2022:
This zip code:
1.0% ($1,351)
Iowa:
1.4% ($2,724)
Median real estate property taxes paid for housing units with mortgages in 2022: $1,207 (1.0%) Median real estate property taxes paid for housing units with no mortgage in 2022: $1,706 (1.0%)
Business Search- 14 Million verified businesses
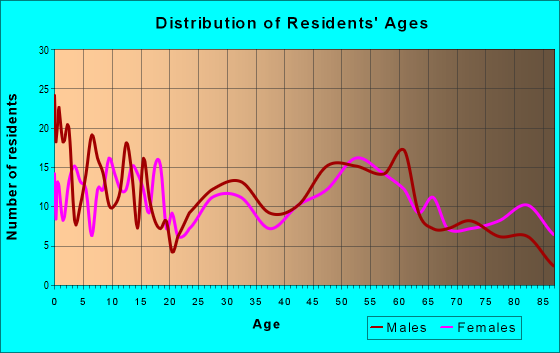
Males: 971
(49.4%)
Females: 993
(50.6%)
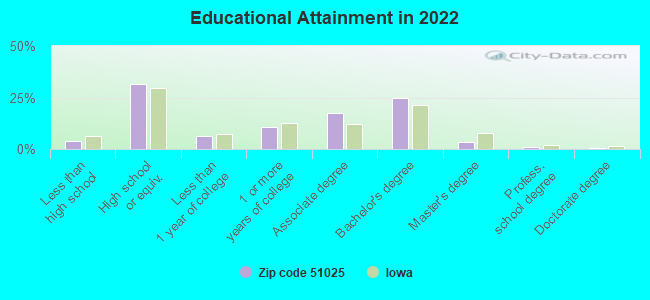
For population 25 years and over in 51025:
High school or higher: 95.7%
Bachelor's degree or higher: 29.9%
Graduate or professional degree: 5.4%
Unemployed: 1.2%
Mean travel time to work (commute): 19.4 minutes
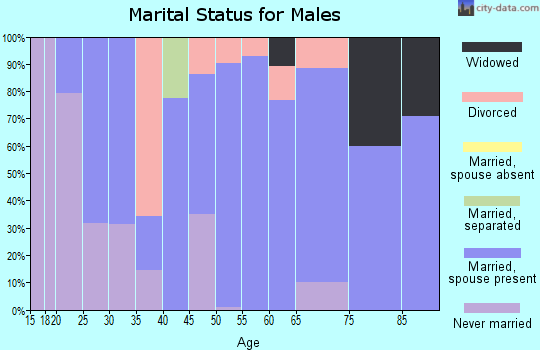
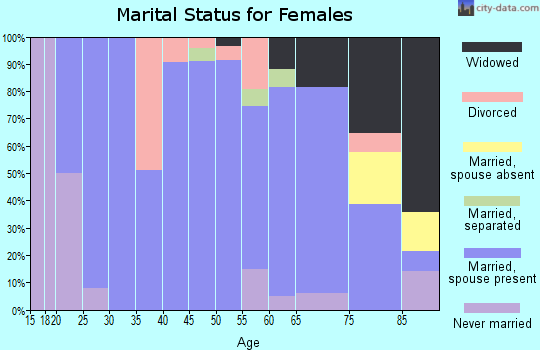
For population 15 years and over in 51025:
Never married: 26.7%
Now married: 55.7%
Separated: 0.2%
Widowed: 7.7%
Divorced: 9.8%
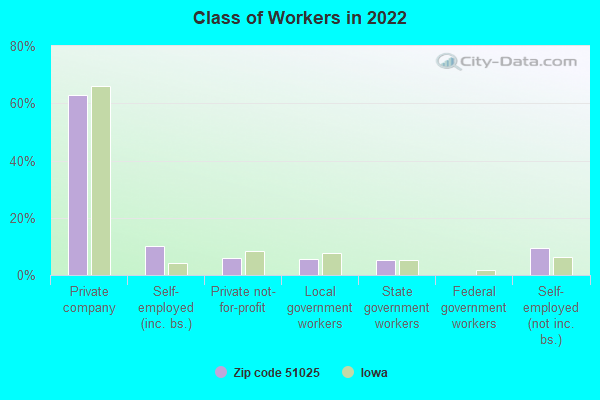
Zip code 51025 compared to state average:
Unemployed percentage below state average.
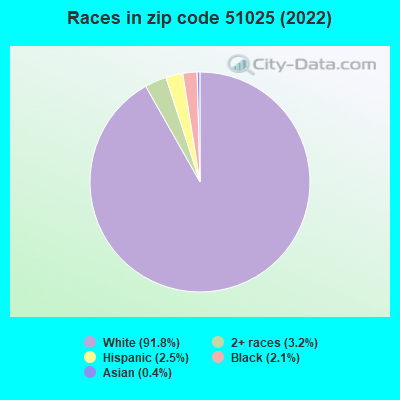
Black race population percentage below state average.
Hispanic race population percentage below state average.
Foreign-born population percentage significantly below state average.
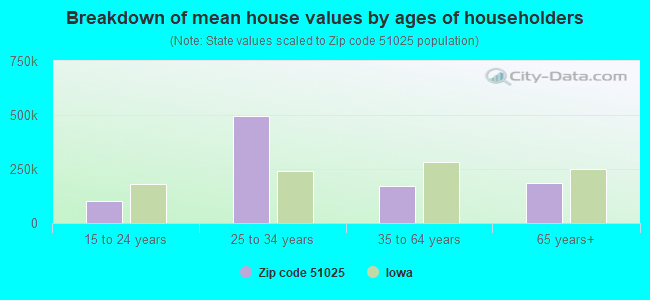
Estimated median house/condo value in 2022: $135,127
51025:
$135,127
Iowa:
$194,600
According to our research of Iowa and other state lists, there were 5 registered sex offenders living in 51025 zip code as of May 07, 2024. The ratio of all residents to sex offenders in zip code 51025 is 407 to 1. The ratio of registered sex offenders to all residents in this zip code is near the state average.
Median resident age:
This zip code:
42.0 years
Iowa median age:
38.9 years
Average household size:
This zip code:
2.3 people
Iowa:
2.3 people
Averages for the 2020 tax year for zip code 51025, filed in 2021:
Average Adjusted Gross Income (AGI) in 2020: $75,626 (Individual Income Tax Returns)
Here:
$75,626
State:
$71,087
Salary/wage: $52,016 (reported on 80.0% of returns)
Here:
$52,016
State:
$57,361
(% of AGI for various income ranges: 1416.9% for AGIs below $25k, 4080.6% for AGIs $25k-50k, 6806.7% for AGIs $50k-75k, 10165.0% for AGIs $75k-100k, 17621.4% for AGIs $100k-200k)
Taxable interest for individuals: $2,278 (reported on 47.4% of returns)
This zip code:
$2,278
Iowa:
$1,633
(% of AGI for various income ranges: 56.9% for AGIs below $25k, 36.7% for AGIs $25k-50k, 164.4% for AGIs $50k-75k, 87.5% for AGIs $75k-100k, 455.7% for AGIs $100k-200k)
Ordinary dividends: $5,683 (reported on 24.2% of returns)
Here:
$5,683
State:
$5,432
(% of AGI for various income ranges: 44.6% for AGIs below $25k, 31.7% for AGIs $25k-50k, 76.7% for AGIs $50k-75k, 17.5% for AGIs $75k-100k, 445.7% for AGIs $100k-200k)
Net capital gain/loss in AGI: +$15,633 (reported on 22.1% of returns)
Here:
+$15,633
State:
+$15,243
(% of AGI for various income ranges: 16.2% for AGIs below $25k, 23.3% for AGIs $25k-50k, 110.0% for AGIs $50k-75k, 820.0% for AGIs $100k-200k)
Profit/loss from business: +$10,369 (reported on 13.7% of returns)
Here:
+$10,369
State:
+$11,763
(% of AGI for various income ranges: 150.6% for AGIs $25k-50k, 490.0% for AGIs $50k-75k, 908.6% for AGIs $100k-200k)
Taxable individual retirement arrangement distribution: $8,973 (reported on 11.6% of returns)
51025:
$8,973
Iowa:
$17,324
(% of AGI for various income ranges: 261.1% for AGIs $25k-50k, 176.2% for AGIs $75k-100k, 537.1% for AGIs $100k-200k)
Total itemized deductions: $39,783 (reported on 6.3% of returns)
Here:
$39,783
State:
$33,775
(% of AGI for various income ranges: 483.9% for AGIs $25k-50k, 2165.7% for AGIs $100k-200k)
Charity contributions: $10,675 (reported on 4.2% of returns)
Here:
$10,675
State:
$13,075
(% of AGI for various income ranges: 610.0% for AGIs $100k-200k)
Taxes paid: $5,300 (reported on 6.3% of returns)
51025:
$5,300
State:
$7,704
(% of AGI for various income ranges: 43.3% for AGIs $25k-50k, 342.9% for AGIs $100k-200k)
Earned income credit: $2,144 (reported on 9.5% of returns)
Here:
$2,144
State:
$2,195
(% of AGI for various income ranges: 62.3% for AGIs below $25k, 62.2% for AGIs $25k-50k)
Percentage of individuals using paid preparers for their 2020 taxes: 97.9%
Here:
98%
State:
95%
(% for various income ranges: 95.5% for AGIs below $25k, 96.2% for AGIs $25k-50k, 100.0% for AGIs $50k-75k, 100.0% for AGIs $75k-100k, 100.0% for AGIs $100k-200k, 100.0% for AGIs over 200k)
Averages for the 2012 tax year for zip code 51025, filed in 2013:
Average Adjusted Gross Income (AGI) in 2012: $66,862 (Individual Income Tax Returns)
Here:
$66,862
State:
$58,860
Salary/wage: $43,548 (reported on 77.2% of returns)
Here:
$43,548
State:
$46,659
(% of AGI for various income ranges: 64.5% for AGIs below $25k, 71.0% for AGIs $25k-50k, 72.3% for AGIs $50k-75k, 61.7% for AGIs $75k-100k, 48.0% for AGIs $100k-200k, 16.9% for AGIs over 200k)
Taxable interest for individuals: $1,464 (reported on 54.3% of returns)
This zip code:
$1,464
Iowa:
$1,537
(% of AGI for various income ranges: 4.3% for AGIs below $25k, 0.7% for AGIs $25k-50k, 0.9% for AGIs $50k-75k, 1.4% for AGIs $75k-100k, 1.2% for AGIs $100k-200k, 0.9% for AGIs over 200k)
Ordinary dividends: $2,430 (reported on 25.0% of returns)
Here:
$2,430
State:
$4,542
(% of AGI for various income ranges: 1.8% for AGIs below $25k, 0.8% for AGIs $25k-50k, 0.4% for AGIs $50k-75k, 0.3% for AGIs $75k-100k, 1.3% for AGIs $100k-200k, 1.0% for AGIs over 200k)
Net capital gain/loss in AGI: +$10,592 (reported on 26.1% of returns)
Here:
+$10,592
State:
+$11,802
(% of AGI for various income ranges: 0.5% for AGIs below $25k, 1.2% for AGIs $50k-75k, 2.2% for AGIs $75k-100k, 3.2% for AGIs $100k-200k, 11.5% for AGIs over 200k)
Profit/loss from business: +$6,186 (reported on 15.2% of returns)
Here:
+$6,186
State:
+$10,509
(% of AGI for various income ranges: 4.8% for AGIs below $25k, 2.9% for AGIs $25k-50k, 3.9% for AGIs $50k-75k, 0.5% for AGIs $100k-200k)
Taxable individual retirement arrangement distribution: $5,886 (reported on 15.2% of returns)
51025:
$5,886
Iowa:
$11,773
(% of AGI for various income ranges: 4.6% for AGIs below $25k, 2.5% for AGIs $25k-50k, 2.1% for AGIs $50k-75k, 1.5% for AGIs $100k-200k)
Total itemized deductions: $20,693 (18% of AGI, reported on 29.3% of returns)
Here:
$20,693
State:
$21,278
Here:
17.9% of AGI
State:
18.9% of AGI
(% of AGI for various income ranges: 24.3% for AGIs below $25k, 8.3% for AGIs $25k-50k, 7.2% for AGIs $50k-75k, 8.2% for AGIs $75k-100k, 10.0% for AGIs $100k-200k, 6.7% for AGIs over 200k)
Charity contributions: $4,255 (reported on 23.9% of returns)
Here:
$4,255
State:
$4,044
(% of AGI for various income ranges: 1.2% for AGIs below $25k, 0.7% for AGIs $25k-50k, 1.3% for AGIs $50k-75k, 1.8% for AGIs $75k-100k, 2.3% for AGIs $100k-200k, 1.1% for AGIs over 200k)
Taxes paid: $7,507 (reported on 29.3% of returns)
51025:
$7,507
State:
$8,846
(% of AGI for various income ranges: 2.6% for AGIs below $25k, 1.2% for AGIs $25k-50k, 1.5% for AGIs $50k-75k, 2.2% for AGIs $75k-100k, 4.6% for AGIs $100k-200k, 5.0% for AGIs over 200k)
Earned income credit: $2,350 (reported on 10.9% of returns)
Here:
$2,350
State:
$2,098
(% of AGI for various income ranges: 4.5% for AGIs below $25k, 1.0% for AGIs $25k-50k)
Percentage of individuals using paid preparers for their 2012 taxes: 81.5%
Here:
82%
State:
65%
(% for various income ranges: 71.4% for AGIs below $25k, 77.3% for AGIs $25k-50k, 87.5% for AGIs $50k-75k, 90.0% for AGIs $75k-100k, 91.7% for AGIs $100k-200k, 100.0% for AGIs over 200k)
Averages for the 2004 tax year for zip code 51025, filed in 2005:
Average Adjusted Gross Income (AGI) in 2004: $33,725 (Individual Income Tax Returns)
Here:
$33,725
State:
$43,875
Salary/wage: $29,828 (reported on 76.5% of returns)
Here:
$29,828
State:
$38,265
(% of AGI for various income ranges: 60.6% for AGIs $10k-25k, 70.9% for AGIs $25k-50k, 68.2% for AGIs $50k-75k, 62.8% for AGIs $75k-100k, 43.0% for AGIs over 100k)
Taxable interest for individuals: $1,764 (reported on 65.4% of returns)
This zip code:
$1,764
Iowa:
$1,768
(% of AGI for various income ranges: 6.6% for AGIs $10k-25k, 3.4% for AGIs $25k-50k, 2.4% for AGIs $50k-75k, 1.6% for AGIs $75k-100k, 2.1% for AGIs over 100k)
Taxable dividends: $2,038 (reported on 27.6% of returns)
Here:
$2,038
State:
$2,510
(% of AGI for various income ranges: 1.7% for AGIs $10k-25k, 0.2% for AGIs $25k-50k, 1.2% for AGIs $50k-75k, 0.4% for AGIs $75k-100k, 4.3% for AGIs over 100k)
Net capital gain/loss: +$2,041 (reported on 27.8% of returns)
Here:
+$2,041
State:
+$6,139
(% of AGI for various income ranges: 1.5% for AGIs $10k-25k, 2.2% for AGIs $25k-50k, 1.2% for AGIs $50k-75k, -0.3% for AGIs $75k-100k, 2.1% for AGIs over 100k)
Profit/loss from business: +$4,013 (reported on 16.0% of returns)
Here:
+$4,013
State:
+$8,574
(% of AGI for various income ranges: 5.0% for AGIs $10k-25k, 2.0% for AGIs $25k-50k, 1.7% for AGIs $50k-75k, 0.5% for AGIs over 100k)
IRA payment deduction: $3,222 (reported on 3.8% of returns)
51025:
$3,222
Iowa:
$2,970
Total itemized deductions: $14,810 (24% of AGI, reported on 20.9% of returns)
Here:
$14,810
State:
$16,976
Here:
24.2% of AGI
State:
20.8% of AGI
(% of AGI for various income ranges: 13.3% for AGIs $10k-25k, 6.1% for AGIs $25k-50k, 8.7% for AGIs $50k-75k, 10.6% for AGIs $75k-100k, 7.5% for AGIs over 100k)
Charity contributions deductions: $2,577 (4% of AGI, reported on 19.0% of returns)
Here:
$2,577
State:
$3,089
Here:
4.1% of AGI
State:
3.6% of AGI
(% of AGI for various income ranges: 1.8% for AGIs $10k-25k, 0.6% for AGIs $25k-50k, 1.1% for AGIs $50k-75k, 2.1% for AGIs $75k-100k, 2.1% for AGIs over 100k)
Total tax: $4,487 (reported on 73.4% of returns)
51025:
$4,487
State:
$6,177
(% of AGI for various income ranges: 4.2% for AGIs $10k-25k, 6.0% for AGIs $25k-50k, 8.2% for AGIs $50k-75k, 11.3% for AGIs $75k-100k, 16.8% for AGIs over 100k)
Earned income credit: $1,495 (reported on 10.9% of returns)
Here:
$1,495
State:
$1,540
Percentage of individuals using paid preparers for their 2004 taxes: 82.7%
Here:
83%
State:
70%
(% for various income ranges: 81.2% for AGIs below $10k, 80.0% for AGIs $10k-25k, 84.0% for AGIs $25k-50k, 87.4% for AGIs $50k-75k, 88.0% for AGIs $75k-100k, 76.1% for AGIs over 100k)
Household received Food Stamps/SNAP in the past 12 months: 54 Household did not receive Food Stamps/SNAP in the past 12 months: 786
Women who had a birth in the past 12 months: 19 (10 now married, 8 unmarried) Women who did not have a birth in the past 12 months: 386 (175 now married, 211 unmarried)
Housing units in zip code 51025 with a mortgage: 342 (11 second mortgage, 9 both second mortgage and home equity loan) Median monthly owner costs for units with a mortgage: $1,003 Median monthly owner costs for units without a mortgage: $472
Residents with income below the poverty level in 2022:
This zip code:
12.7%
Whole state:
11.0%
Residents with income below 50% of the poverty level in 2022:
This zip code:
5.8%
Whole state:
5.5%
Median number of rooms in houses and condos:
Here:
7.1
State:
6.8
Median number of rooms in apartments:
Here:
4.2
State:
4.2
Notable locations in this zip code not listed on our city pages
Notable locations in zip code 51025: Holstein Country Club (A), Holstein Cooperative Elevator (B), Lohff Schuman Memorial Center (C), Holstein City Library (D), Holstein Fire Department (E), Veterans Memorial Hall (F). Display/hide their locations on the map
Churches in zip code 51025 include: Battle Center Church (A), Saint Pauls Lutheran Church (B), Our Lady of Good Counsel Church (C), United Methodist Church (D). Display/hide their locations on the map
In group quarters: 59 (-1 institutionalized population)
Size of family households: 282 2-persons, 148 3-persons, 68 4-persons, 38 5-persons, 4 6-persons, 6 7-or-more-persons
Size of nonfamily households: 270 1-person, 19 2-persons
240 married couples with children.
182 single-parent households (56 men, 126 women).
98.8% of residents of 51025 zip code speak English at home.
1.2% of residents speak Spanish at home (100% very well).
0.1% of residents speak other Indo-European language at home (100% well).
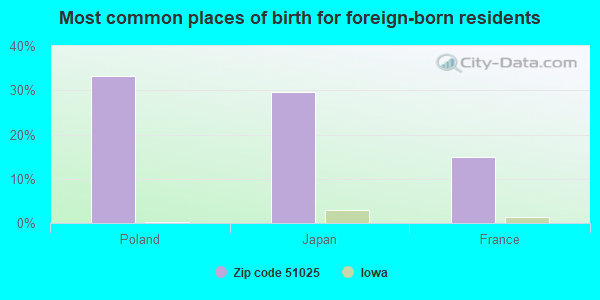
Foreign born population: 29 (1.5%) (67.4% of them are naturalized citizens)
This zip code:
1.5%
Whole state:
6.0%
33%Poland
30%Japan
15%France
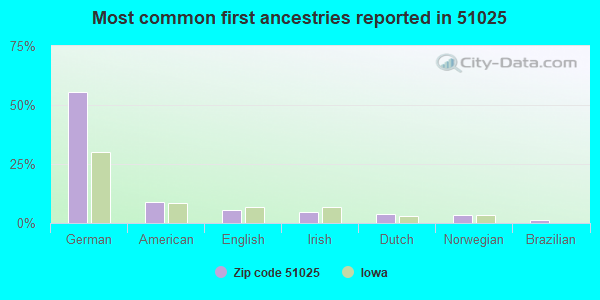
55%German
9%American
6%English
5%Irish
4%Dutch
4%Norwegian
1%Brazilian
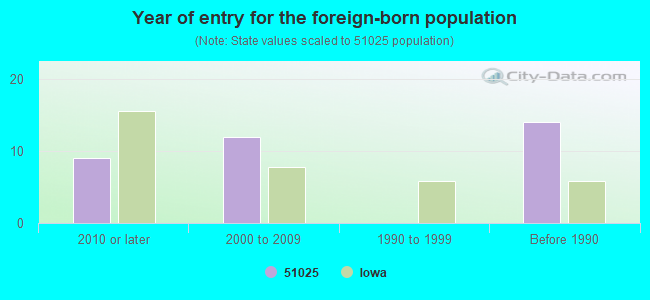
Year of entry for the foreign-born population
92010 or later
122000 to 2009
01990 to 1999
14Before 1990
Facilities with environmental interests located in this zip code:
HOLSTEIN COOP ELEV (204 EAST 1ST STREET in HOLSTEIN, IA)
AIR MINOR (AIRS/AFS) COMPLIANCE ACTIVITY (Tracking inspections of insecticide, fungicide, and rodenticide, and toxic substances) Business SIC classification: NONCLASSIFIABLE ESTABLISHMENTS Alternative names: GALVA HOLSTEIN AG, HOLSTEIN COOP ELEVATOR
National Pollutant Discharge Elimination System NON-MAJOR (Tracking pollutant discharge elimination systems) - permit Business SIC classification: SEWERAGE SYSTEMS Organizations: CITY OF HOLSTEIN (CONTACT/OWNER)
BYE & BYE INC-FORMER SITE OF (110 S MAIN in HOLSTEIN, IA)
(Resource Conservation and Recovery Act (tracking hazardous waste)) Business NAICS classification: COMMERCIAL LITHOGRAPHIC PRINTING.
STIENEKE FORD (523 S MAIN in HOLSTEIN, IA)
Conditionally Exempt Small Quantity Generators, less than 100 kg/month of hazardous waste (Resource Conservation and Recovery Act (tracking hazardous waste)) Business NAICS classification: ALL OTHER MOTOR VEHICLE DEALERS.; GENERAL AUTOMOTIVE REPAIR.
Housing units lacking complete plumbing facilities: 0.3% Housing units lacking complete kitchen facilities: 1.0%
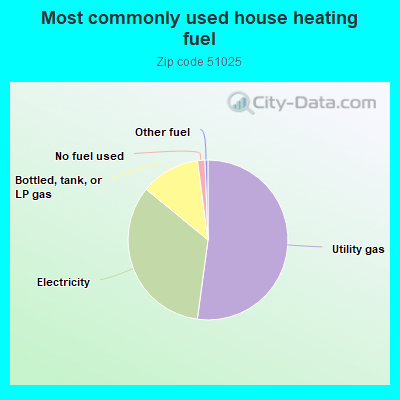
52.3%Utility gas
33.9%Electricity
12.0%Bottled, tank, or LP gas
1.5%No fuel used
0.6%Other fuel
Population in 1990: 1,977. Population change in the 1990s: +213 (+10.8%).
Place of birth for U.S.-born residents:
This state: 1,620
Midwest: 183
South: 23
West: 96
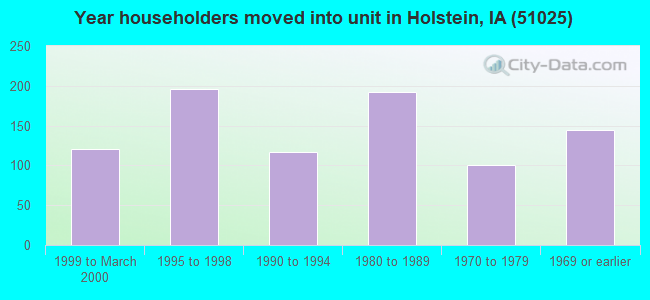
67% of the 51025 zip code residents lived in the same house 5 years ago. Out of people who lived in different houses, 58% lived in this county. Out of people who lived in different counties, 50% lived in Iowa.
91% of the 51025 zip code residents lived in the same house 1 year ago. Out of people who lived in different houses, 26% moved from this county. Out of people who lived in different houses, 76% moved from different county within same state.
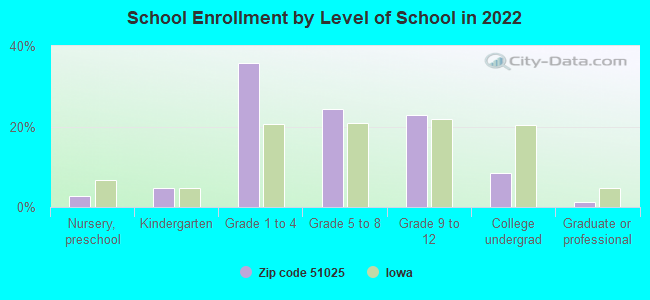
Private vs. public school enrollment:
Students in private schools in grades 1 to 8 (elementary and middle school): 32
Here:
13.6%
Iowa:
10.6%
Students in private schools in grades 9 to 12 (high school):
Here:
0.0%
Iowa:
7.9%
Students in private undergraduate colleges: 16
Here:
49.1%
Iowa:
23.9%
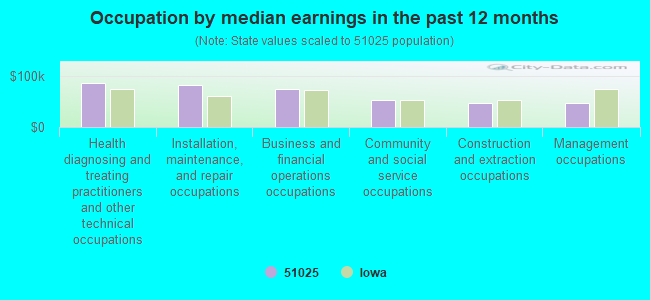
Occupation by median earnings in the past 12 months ($)
85,456Health diagnosing and treating practitioners and other technical occupations
80,769Installation, maintenance, and repair occupations
74,088Business and financial operations occupations
52,385Community and social service occupations
47,107Construction and extraction occupations
45,675Management occupations
Top industries in this zip code by the number of employees in 2005:
Health Care and Social Assistance: Nursing Care Facilities (50-99 employees: 1 establishment)
Finance and Insurance: Commercial Banking (20-49: 1, 10-19: 1)
Other Services (except Public Administration): Religious Organizations (10-19: 2, 5-9: 1)
Construction: Commercial and Institutional Building Construction (20-49: 1, 1-4: 1)
Wholesale Trade: Grain and Field Bean Merchant Wholesalers (20-49: 1)
51 people in nursing facilities/skilled-nursing facilities
People in group quarters in 2000:
55 people in homes or halfway houses for drug/alcohol abuse
Fatal accident statistics in 2012:
Fatal accident count: 3
Vehicles involved in fatal accidents: 10
Fatal accidents caused by drunken drivers: 0
Fatalities: 4
Persons involved in fatal accidents: 11
Pedestrians involved in fatal accidents: 0
Fatal accident statistics in 2011:
Fatal accident count: 1
Vehicles involved in fatal accidents: 2
Fatal accidents caused by drunken drivers: 0
Fatalities: 2
Persons involved in fatal accidents: 3
Pedestrians involved in fatal accidents: 0
2003 - 2018 National Fire Incident Reporting System (NFIRS) incidents
According to the data from the years 2003 - 2018 the average number of fire incidents per year is 10. The highest number of fire incidents - 20 took place in 2003, and the least - 0 in 2006. The data has a decreasing trend.
When looking into fire subcategories, the most reports belonged to: Outside Fires (44.6%), and Structure Fires (38.2%).
Fire incident types reported to NFIRS in Zip Code 51025


 Nearest zip codes: 51018, 51020, 51049, 51061, 51006, 51445.
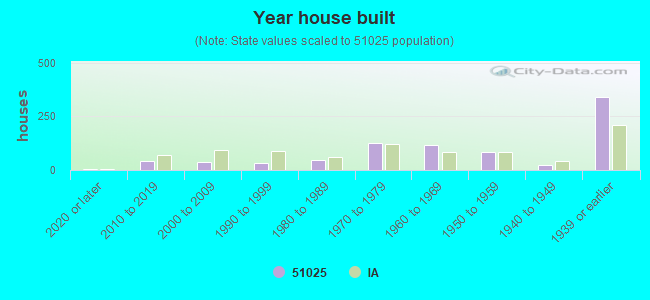


 According to the data from the years 2003 - 2018 the average number of fire incidents per year is 10. The highest number of fire incidents - 20 took place in 2003, and the least - 0 in 2006. The data has a decreasing trend.
 When looking into fire subcategories, the most reports belonged to: Outside Fires (44.6%), and Structure Fires (38.2%).