Estimated zip code population in 2022: 17,067 Zip code population in 2010: 17,453 Zip code population in 2000: 17,494
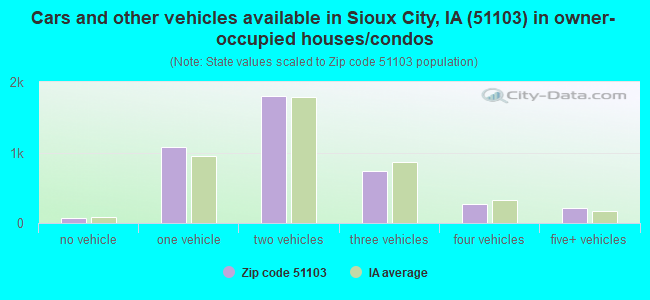
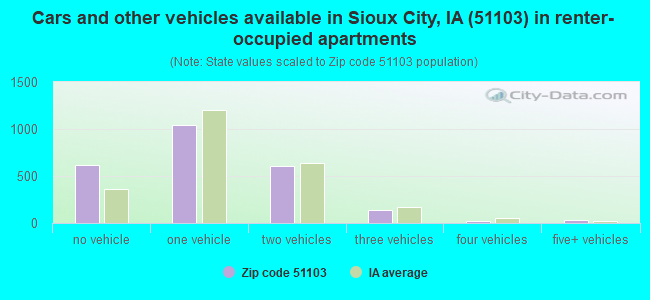
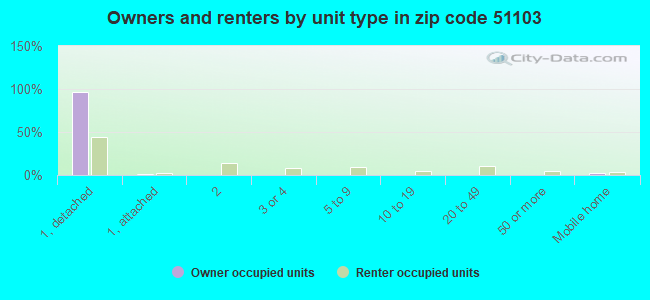
Houses and condos: 6,903 Renter-occupied apartments: 2,445
% of renters here:
37%
State:
28%
March 2022 cost of living index in zip code 51103: 85.8 (less than average, U.S. average is 100)
Land area: 10.6 sq. mi. Water area: 0.2 sq. mi.
Population density: 1,617 people per square mile
(low).
OSM Map
General Map
Google Map
MSN Map
OSM Map
General Map
Google Map
MSN Map
OSM Map
General Map
Google Map
MSN Map
OSM Map
General Map
Google Map
MSN Map
Please wait while loading the map...
Real estate property taxes paid for housing units in 2022:
This zip code:
1.5% ($1,859)
Iowa:
1.4% ($2,724)
Median real estate property taxes paid for housing units with mortgages in 2022: $1,904 (1.4%) Median real estate property taxes paid for housing units with no mortgage in 2022: $1,793 (1.7%)
Averages for the 2020 tax year for zip code 51103, filed in 2021:
Average Adjusted Gross Income (AGI) in 2020: $43,633 (Individual Income Tax Returns)
Here:
$43,633
State:
$71,087
Salary/wage: $38,361 (reported on 90.8% of returns)
Here:
$38,361
State:
$57,361
(% of AGI for various income ranges: 1250.0% for AGIs below $25k, 3756.3% for AGIs $25k-50k, 6657.3% for AGIs $50k-75k, 9330.5% for AGIs $75k-100k, 14146.3% for AGIs $100k-200k)
Taxable interest for individuals: $761 (reported on 16.5% of returns)
This zip code:
$761
Iowa:
$1,633
(% of AGI for various income ranges: 6.3% for AGIs below $25k, 11.2% for AGIs $25k-50k, 20.8% for AGIs $50k-75k, 21.4% for AGIs $75k-100k, 60.9% for AGIs $100k-200k)
Ordinary dividends: $2,712 (reported on 6.4% of returns)
Here:
$2,712
State:
$5,432
(% of AGI for various income ranges: 4.8% for AGIs below $25k, 10.7% for AGIs $25k-50k, 24.1% for AGIs $50k-75k, 39.8% for AGIs $75k-100k, 167.4% for AGIs $100k-200k)
Net capital gain/loss in AGI: +$3,585 (reported on 5.3% of returns)
Here:
+$3,585
State:
+$15,243
(% of AGI for various income ranges: 3.3% for AGIs below $25k, 6.2% for AGIs $25k-50k, 18.5% for AGIs $50k-75k, 56.8% for AGIs $75k-100k, 233.7% for AGIs $100k-200k)
Profit/loss from business: +$9,794 (reported on 8.4% of returns)
Here:
+$9,794
State:
+$11,763
(% of AGI for various income ranges: 84.5% for AGIs below $25k, 71.1% for AGIs $25k-50k, 102.7% for AGIs $50k-75k, 120.7% for AGIs $75k-100k, 380.3% for AGIs $100k-200k)
Taxable individual retirement arrangement distribution: $11,264 (reported on 5.2% of returns)
51103:
$11,264
Iowa:
$17,324
(% of AGI for various income ranges: 28.5% for AGIs below $25k, 34.8% for AGIs $25k-50k, 124.0% for AGIs $50k-75k, 160.0% for AGIs $75k-100k, 351.4% for AGIs $100k-200k)
Total itemized deductions: $26,293 (reported on 1.9% of returns)
Here:
$26,293
State:
$33,775
(% of AGI for various income ranges: 19.1% for AGIs below $25k, 77.2% for AGIs $50k-75k, 172.5% for AGIs $75k-100k, 514.6% for AGIs $100k-200k)
Charity contributions: $8,464 (reported on 1.5% of returns)
Here:
$8,464
State:
$13,075
(% of AGI for various income ranges: 30.7% for AGIs $50k-75k, 34.3% for AGIs $75k-100k, 145.7% for AGIs $100k-200k)
Taxes paid: $6,686 (reported on 1.9% of returns)
51103:
$6,686
State:
$7,704
(% of AGI for various income ranges: 2.7% for AGIs below $25k, 21.9% for AGIs $50k-75k, 55.9% for AGIs $75k-100k, 124.3% for AGIs $100k-200k)
Earned income credit: $2,412 (reported on 25.7% of returns)
Here:
$2,412
State:
$2,195
(% of AGI for various income ranges: 128.0% for AGIs below $25k, 82.4% for AGIs $25k-50k, 1.6% for AGIs $50k-75k)
Percentage of individuals using paid preparers for their 2020 taxes: 96.7%
Here:
97%
State:
95%
(% for various income ranges: 95.9% for AGIs below $25k, 97.1% for AGIs $25k-50k, 96.5% for AGIs $50k-75k, 98.2% for AGIs $75k-100k, 98.0% for AGIs $100k-200k, 100.0% for AGIs over 200k)
Averages for the 2012 tax year for zip code 51103, filed in 2013:
Average Adjusted Gross Income (AGI) in 2012: $33,518 (Individual Income Tax Returns)
Here:
$33,518
State:
$58,860
Salary/wage: $30,153 (reported on 91.0% of returns)
Here:
$30,153
State:
$46,659
(% of AGI for various income ranges: 84.1% for AGIs below $25k, 87.8% for AGIs $25k-50k, 85.5% for AGIs $50k-75k, 83.6% for AGIs $75k-100k, 77.3% for AGIs $100k-200k, 29.3% for AGIs over 200k)
Taxable interest for individuals: $886 (reported on 18.0% of returns)
This zip code:
$886
Iowa:
$1,537
(% of AGI for various income ranges: 0.5% for AGIs below $25k, 0.4% for AGIs $25k-50k, 0.6% for AGIs $50k-75k, 0.4% for AGIs $75k-100k, 0.5% for AGIs $100k-200k, 0.6% for AGIs over 200k)
Ordinary dividends: $2,139 (reported on 6.8% of returns)
Here:
$2,139
State:
$4,542
(% of AGI for various income ranges: 0.4% for AGIs below $25k, 0.3% for AGIs $25k-50k, 0.5% for AGIs $50k-75k, 0.5% for AGIs $75k-100k, 0.9% for AGIs $100k-200k)
Net capital gain/loss in AGI: +$4,058 (reported on 5.3% of returns)
Here:
+$4,058
State:
+$11,802
(% of AGI for various income ranges: 0.2% for AGIs $50k-75k, 0.7% for AGIs $75k-100k, 5.1% for AGIs $100k-200k)
Profit/loss from business: +$7,580 (reported on 9.8% of returns)
Here:
+$7,580
State:
+$10,509
(% of AGI for various income ranges: 5.3% for AGIs below $25k, 1.6% for AGIs $25k-50k, 1.4% for AGIs $50k-75k, 1.8% for AGIs $75k-100k, 1.5% for AGIs $100k-200k)
Taxable individual retirement arrangement distribution: $7,900 (reported on 7.2% of returns)
51103:
$7,900
Iowa:
$11,773
(% of AGI for various income ranges: 1.5% for AGIs below $25k, 1.6% for AGIs $25k-50k, 1.4% for AGIs $50k-75k, 2.1% for AGIs $75k-100k, 3.3% for AGIs $100k-200k)
Total itemized deductions: $15,846 (22% of AGI, reported on 13.8% of returns)
Here:
$15,846
State:
$21,278
Here:
22.0% of AGI
State:
18.9% of AGI
(% of AGI for various income ranges: 4.0% for AGIs below $25k, 5.1% for AGIs $25k-50k, 6.4% for AGIs $50k-75k, 8.5% for AGIs $75k-100k, 11.7% for AGIs $100k-200k, 10.0% for AGIs over 200k)
Charity contributions: $2,750 (reported on 10.8% of returns)
Here:
$2,750
State:
$4,044
(% of AGI for various income ranges: 0.5% for AGIs below $25k, 0.5% for AGIs $25k-50k, 0.8% for AGIs $50k-75k, 1.2% for AGIs $75k-100k, 1.7% for AGIs $100k-200k, 2.6% for AGIs over 200k)
Taxes paid: $5,901 (reported on 13.8% of returns)
51103:
$5,901
State:
$8,846
(% of AGI for various income ranges: 0.7% for AGIs below $25k, 1.5% for AGIs $25k-50k, 2.4% for AGIs $50k-75k, 3.4% for AGIs $75k-100k, 5.4% for AGIs $100k-200k, 6.3% for AGIs over 200k)
Earned income credit: $2,454 (reported on 32.2% of returns)
Here:
$2,454
State:
$2,098
(% of AGI for various income ranges: 9.3% for AGIs below $25k, 1.7% for AGIs $25k-50k)
Percentage of individuals using paid preparers for their 2012 taxes: 72.6%
Here:
73%
State:
65%
(% for various income ranges: 67.6% for AGIs below $25k, 76.1% for AGIs $25k-50k, 78.9% for AGIs $50k-75k, 81.1% for AGIs $75k-100k, 85.0% for AGIs $100k-200k, 100.0% for AGIs over 200k)
Averages for the 2004 tax year for zip code 51103, filed in 2005:
Average Adjusted Gross Income (AGI) in 2004: $29,528 (Individual Income Tax Returns)
Here:
$29,528
State:
$43,875
Salary/wage: $27,533 (reported on 90.7% of returns)
Here:
$27,533
State:
$38,265
(% of AGI for various income ranges: 88.4% for AGIs below $10k, 84.6% for AGIs $10k-25k, 88.5% for AGIs $25k-50k, 88.2% for AGIs $50k-75k, 88.0% for AGIs $75k-100k, 57.8% for AGIs over 100k)
Taxable interest for individuals: $1,334 (reported on 28.9% of returns)
This zip code:
$1,334
Iowa:
$1,768
(% of AGI for various income ranges: 3.7% for AGIs below $10k, 1.5% for AGIs $10k-25k, 0.9% for AGIs $25k-50k, 0.7% for AGIs $50k-75k, 0.8% for AGIs $75k-100k, 3.4% for AGIs over 100k)
Taxable dividends: $1,729 (reported on 11.5% of returns)
Here:
$1,729
State:
$2,510
(% of AGI for various income ranges: 1.2% for AGIs below $10k, 0.6% for AGIs $10k-25k, 0.4% for AGIs $25k-50k, 0.3% for AGIs $50k-75k, 0.3% for AGIs $75k-100k, 2.8% for AGIs over 100k)
Net capital gain/loss: +$2,002 (reported on 9.1% of returns)
Here:
+$2,002
State:
+$6,139
(% of AGI for various income ranges: -0.7% for AGIs below $10k, -0.1% for AGIs $10k-25k, 0.2% for AGIs $25k-50k, 0.4% for AGIs $50k-75k, 0.2% for AGIs $75k-100k, 4.6% for AGIs over 100k)
Profit/loss from business: +$6,095 (reported on 10.5% of returns)
Here:
+$6,095
State:
+$8,574
(% of AGI for various income ranges: 2.8% for AGIs below $10k, 2.7% for AGIs $10k-25k, 1.8% for AGIs $25k-50k, 2.1% for AGIs $50k-75k, 1.9% for AGIs $75k-100k, 2.7% for AGIs over 100k)
IRA payment deduction: $2,430 (reported on 2.2% of returns)
51103:
$2,430
Iowa:
$2,970
Total itemized deductions: $13,373 (23% of AGI, reported on 18.3% of returns)
Here:
$13,373
State:
$16,976
Here:
23.0% of AGI
State:
20.8% of AGI
(% of AGI for various income ranges: 4.5% for AGIs below $10k, 5.3% for AGIs $10k-25k, 7.2% for AGIs $25k-50k, 8.3% for AGIs $50k-75k, 14.6% for AGIs $75k-100k, 12.9% for AGIs over 100k)
Charity contributions deductions: $2,024 (3% of AGI, reported on 15.8% of returns)
Here:
$2,024
State:
$3,089
Here:
3.3% of AGI
State:
3.6% of AGI
(% of AGI for various income ranges: 0.2% for AGIs below $10k, 0.7% for AGIs $10k-25k, 0.9% for AGIs $25k-50k, 1.0% for AGIs $50k-75k, 1.9% for AGIs $75k-100k, 2.2% for AGIs over 100k)
Total tax: $3,305 (reported on 64.1% of returns)
51103:
$3,305
State:
$6,177
(% of AGI for various income ranges: 1.7% for AGIs below $10k, 3.3% for AGIs $10k-25k, 5.4% for AGIs $25k-50k, 7.6% for AGIs $50k-75k, 10.0% for AGIs $75k-100k, 18.6% for AGIs over 100k)
Earned income credit: $1,803 (reported on 28.2% of returns)
Here:
$1,803
State:
$1,540
Percentage of individuals using paid preparers for their 2004 taxes: 80.0%
Here:
80%
State:
70%
(% for various income ranges: 71.6% for AGIs below $10k, 80.9% for AGIs $10k-25k, 83.5% for AGIs $25k-50k, 84.6% for AGIs $50k-75k, 79.8% for AGIs $75k-100k, 87.7% for AGIs over 100k)
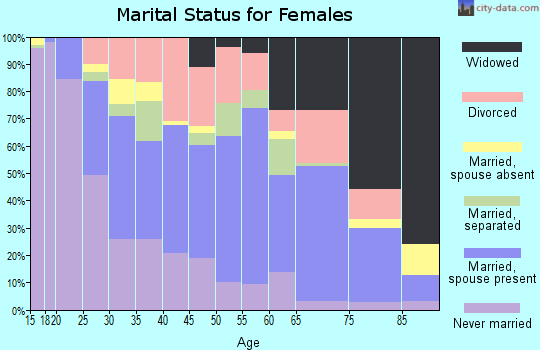
Likely homosexual households (counted as self-reported same-sex unmarried-partner households)
Lesbian couples: 0.1% of all households
Gay men: 0.0% of all households
Household received Food Stamps/SNAP in the past 12 months: 1,342 Household did not receive Food Stamps/SNAP in the past 12 months: 5,205
Women who had a birth in the past 12 months: 275 (201 now married, 73 unmarried) Women who did not have a birth in the past 12 months: 3,606 (1,304 now married, 2,303 unmarried)
Housing units in zip code 51103 with a mortgage: 2,491 (103 second mortgage, 20 home equity loan, 84 both second mortgage and home equity loan) Houses without a mortgage: 59
Median monthly owner costs for units with a mortgage: $1,097 Median monthly owner costs for units without a mortgage: $470
Residents with income below the poverty level in 2022:
This zip code:
20.1%
Whole state:
11.0%
Residents with income below 50% of the poverty level in 2022:
This zip code:
14.4%
Whole state:
5.5%
Median number of rooms in houses and condos:
Here:
6.3
State:
6.8
Median number of rooms in apartments:
Here:
4.9
State:
4.2
Notable locations in this zip code not listed on our city pages
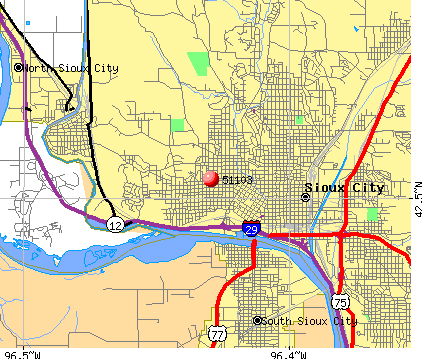
Notable locations in zip code 51103: Holy Spirit Retirement Home (A), Sun Valley Golf Course (B), Memorial Field (C), Sergeant Floyd Riverboat Museum and Welcome Center (D), State of Iowa Residential Treatment Facility (E), Anderson Dance Pavilion (F), Sioux City Fire Department Station 8 (G). Display/hide their locations on the map
Churches in zip code 51103 include: Immanuel Lutheran Church (A), Saint Paul Episcopal Church (B), Mount Zion Baptist Church (C), Lao Unity CRC Church (D), Crescent Park Methodist Church (E), Good News Baptist Church (F), New Creations Ministries (G), Gethsemane lutheran Church (H), Church of Christ (I). Display/hide their locations on the map
Parks in zip code 51103 include: Chris Larsen Park (1), Chief War Eagle's Grave Historical Marker (2), Sanford Park (3), Childrens Park (4), Cook Park (5), Bishop Mueller Baseball/Softball Complex (6), Gilman Park (7), War Eagle Park (8), Headington Park (9). Display/hide their locations on the map
2,344 married couples with children.
2,008 single-parent households (710 men, 1,298 women).
68.8% of residents of 51103 zip code speak English at home.
24.3% of residents speak Spanish at home (57% very well, 11% well, 26% not well, 5% not at all).
1.5% of residents speak other Indo-European language at home (84% very well, 16% well).
3.5% of residents speak Asian or Pacific Island language at home (29% very well, 16% well, 34% not well, 21% not at all).
1.0% of residents speak other language at home (83% very well, 14% well, 4% not at all).
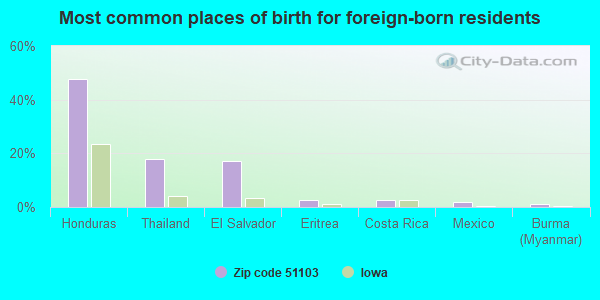
Foreign born population: 2,651 (15.5%) (46.7% of them are naturalized citizens)
Major facilities with environmental interests located in this zip code:
SIOUX CITY COMMUNITY SCHOOL DISTRICT (2001 CASSELMAN STREET in SIOUX CITY, IA)
(Geographic Names Information System) COMPLIANCE ACTIVITY (Tracking inspections of insecticide, fungicide, and rodenticide, and toxic substances) (National Center for Education Statistics) - STATE ID-976039 145 Conditionally Exempt Small Quantity Generators, less than 100 kg/month of hazardous waste (Resource Conservation and Recovery Act (tracking hazardous waste)) - ICIS-, ENFORCEMENT/COMPLIANCE ACTIVITY Organizations: SIOUX CITY COMM SCHOOL DISTRICT (SCHOOL DISTRICT)
Alternative names: SIOUX CITY C S D, SIOUX CITY C S D (ASHAA), SIOUX CITY WEST HIGH SCHOOL, WEST HIGH SCHOOL-ASHAA
SIOUX CITY WATER SUPPLY (1101 TRI VIEW AVE in SIOUX CITY, IA)
STATE MASTER (Iowa emission factors information) - SDWIS-IA9778054, DRINKING WATER SYSTEM National Pollutant Discharge Elimination System NON-MAJOR (Tracking pollutant discharge elimination systems) - permit Conditionally Exempt Small Quantity Generators, less than 100 kg/month of hazardous waste (Resource Conservation and Recovery Act (tracking hazardous waste)) - notification Business SIC classification: WATER SUPPLY Organizations: CITY OF SIOUX CITY (CONTACT/OWNER)
, SIOUX CITY WATER TREATMENT PLA (CONTACT/OWNER)
, SIOUX CITY, CITY OF (LEGALLY RESPONSIBLE ENTITY)
Alternative names: CITY OF SIOUX CITY WATER TREATMENT PLANT, SIOUX CITY WATER PLANT, SIOUX CITY WATER TREATMENT PLA
PERKINS OFFICE SOLUTIONS (717 PERRY ST in SIOUX CITY, IA)
(Resource Conservation and Recovery Act (tracking hazardous waste)) - ICIS-, ENFORCEMENT/COMPLIANCE ACTIVITY Organizations: SCHRIER MOTOR CENTER INC (CONTACT/OWNER)
Alternative names: SCHRIER MOTOR CENTER INC
AUTOMOTIVE FINISHES (815 W 8TH ST in SIOUX CITY, IA)
Conditionally Exempt Small Quantity Generators, less than 100 kg/month of hazardous waste (Resource Conservation and Recovery Act (tracking hazardous waste)) - ICIS-, ENFORCEMENT/COMPLIANCE ACTIVITY Business NAICS classification: AUTOMOTIVE BODY, PAINT, AND INTERIOR REPAIR AND MAINTENANCE. Organizations: AUTOMOTIVE FINISHES INC (CONTACT/OPERATOR)
, STEVE DUMMERMUTH SR (CONTACT/OWNER)
SMITH ELEMENTARY SCHOOL (1623 REBECCA ST in SIOUX CITY, IA)
(National Center for Education Statistics) - STATE ID-976039 598 Organizations: SIOUX CITY COMM SCHOOL DISTRICT (SCHOOL DISTRICT)
CRESCENT PARK ELEMENTARY SCHOOL (1114 W 27TH ST in SIOUX CITY, IA)
(National Center for Education Statistics) - STATE ID-976039 445 Organizations: SIOUX CITY COMM SCHOOL DISTRICT (SCHOOL DISTRICT)
ROOSEVELT ELEMENTARY SCHOOL (2015 W 6TH ST in SIOUX CITY, IA)
(National Center for Education Statistics) - STATE ID-976039 589 Organizations: SIOUX CITY COMM SCHOOL DISTRICT (SCHOOL DISTRICT)
ALL POWER INC (1300 W 1ST in SIOUX CITY, IA)
(Resource Conservation and Recovery Act (tracking hazardous waste)) Business NAICS classification: METAL STAMPING.
SACRED HEART SCHOOL (5010 MILITARY ROAD in SIOUX CITY, IA)
COMPLIANCE ACTIVITY (Tracking inspections of insecticide, fungicide, and rodenticide, and toxic substances)
PROFESSIONAL DENTAL CO (611 OMAHA ST in SIOUX CITY, IA)
(Resource Conservation and Recovery Act (tracking hazardous waste)) Organizations: DAVID WATKINS (CONTACT/OWNER)
BEKINS DISTRIBUTION CENTER (1153 TRI-VIEW AVE in SIOUX CITY, IA)
CALDWELL CO-FORMER SITE OF(VACANT LOT) (100 4TH ST in SIOUX CITY, IA)
(Resource Conservation and Recovery Act (tracking hazardous waste))
SIOUX CITY SIGN SHOP (723 OMAHA ST in SIOUX CITY, IA)
(Resource Conservation and Recovery Act (tracking hazardous waste)) Organizations: CITY OF SIOUX CITY (CONTACT/OWNER)
Housing units lacking complete plumbing facilities: 1.9% Housing units lacking complete kitchen facilities: 1.9%
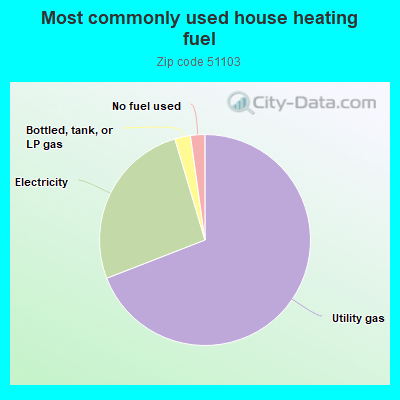
69.1%Utility gas
26.3%Electricity
2.4%Bottled, tank, or LP gas
2.2%No fuel used
Population in 1990: 16,831. Population change in the 1990s: +663 (+3.9%).
Place of birth for U.S.-born residents:
This state: 9,710
Northeast: 215
Midwest: 2,287
South: 668
West: 1,315
55% of the 51103 zip code residents lived in the same house 5 years ago. Out of people who lived in different houses, 69% lived in this county. Out of people who lived in different counties, 50% lived in Iowa.
92% of the 51103 zip code residents lived in the same house 1 year ago. Out of people who lived in different houses, 49% moved from this county. Out of people who lived in different houses, 24% moved from different county within same state. Out of people who lived in different houses, 26% moved from different state. Out of people who lived in different houses, 3% moved from abroad.
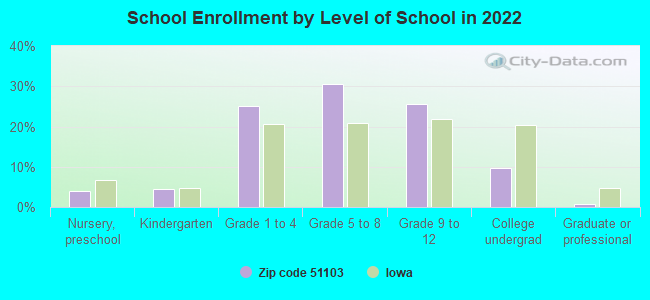
Private vs. public school enrollment:
Students in private schools in grades 1 to 8 (elementary and middle school): 101
Here:
4.1%
Iowa:
10.6%
Students in private schools in grades 9 to 12 (high school): 53
Here:
4.7%
Iowa:
7.9%
Students in private undergraduate colleges: 122
Here:
28.6%
Iowa:
23.9%
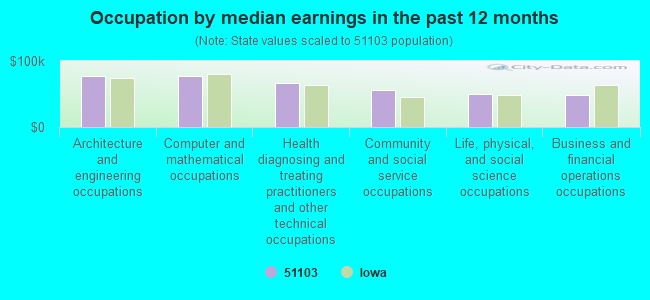
Occupation by median earnings in the past 12 months ($)
77,053Architecture and engineering occupations
76,762Computer and mathematical occupations
66,420Health diagnosing and treating practitioners and other technical occupations
56,127Community and social service occupations
49,913Life, physical, and social science occupations
48,887Business and financial operations occupations
Companies with federal contracts located in this zip code (SIOUX CITY, IA):
STEFFEN INC (623 W 7TH ST; small business) : $480,869 in 6 contractsfrom 1999 to 2004
Contracts for Power and Hand Pumps, Hand Tools, Power Driven, Fire Fighting Equipment, Hardware, Commercial by Army Signed by year:2000: $0; 2001: $391,915; 2002: $0; 2003: $0; 2004: $41,408; 2005: $0; 2006: $0.
Biggest contracts:
$293,645 with Army for Power and Hand Pumps. Signed on 2001-02-28. Completion date: 2001-06-23.
$60,184 with Army for Hand Tools, Power Driven. Signed on 2001-04-17. Completion date: 2001-05-04.
$47,546, same as above.Signed on 1999-11-30. Completion date: 2000-01-31.
$38,209 with Army for Fire Fighting Equipment. Taking place in KS. Signed on 2004-09-08. Completion date: 2004-09-30.
STANDARD OFFICE EQUIPMENT CO, (1501 ZENITH DR; small business)
$45,314 with Air Force for Maintenance, Repair and Rebuilding of Equipment -- Furniture. Taking place in IL. Signed on 2000-09-23. Completion date: 2000-11-03.
PERKINS STATIONERY, INC (717 PERRY ST; small business)
$27,045 with Army for Office Furniture. Signed on 2001-08-10. Completion date: 2001-09-10.
NOVELTY MACHINE & SUPPLY CO (1635 ZENITH DR; small business)
$8,998 with U.S. Army Corps of Engineers - civil program financing only for Centrifugals, Separators, and Pressure and Vacuum Filters. Taking place in NE. Signed on 2002-04-22. Completion date: 2002-06-21.
DONNA KOBES (3063 REBECCA ST; small business) : $8,490 in 5 contractsfrom 2000 to 2001
Contracts for Custodial Janitorial Services by Army Signed by year:2000: $6,570; 2001: $1,920; 2002: $0; 2003: $0; 2004: $0; 2005: $0; 2006: $0.
Biggest contracts:
$4,650 with Army for Custodial Janitorial Services. Signed on 2000-11-04. Completion date: 2001-09-30.
$1,920, same as above.Signed on 2001-10-23. Completion date: 2002-09-30.
$1,920, same as above.Signed on 2000-11-06. Completion date: 2001-09-30.
$0, same as above.Signed on 2000-11-04. Completion date: 2001-09-30.
KELLY KOBES JANITORIAL SERVICE (2008 W 18TH ST; small business) : $4,960 in 5 contractsfrom 2002 to 2005
Contracts for Custodial Janitorial Services by Army Signed by year:2000: $0; 2001: $0; 2002: $1,860; 2003: $1,860; 2004: $1,860; 2005: -$620; 2006: $0.
Biggest contracts:
$1,860 with Army for Custodial Janitorial Services. Signed on 2004-11-12. Completion date: 2005-09-30.
$1,860, same as above.Signed on 2003-11-21. Completion date: 2004-09-30.
$1,860, same as above.Signed on 2002-11-13. Completion date: 2003-09-30.
$0, same as above.Signed on 2002-11-13. Completion date: 2003-09-30.
QUALITY PLUMBING INC (1018 W 7TH ST; small business)
$4,171 with Army for Plumbing Fixtures and Accessories. Signed on 2004-06-08. Completion date: 2004-06-22.
FOULK BROS PLUMBING & HEATING (322 W 7TH ST; small business) : $1,999 in 3 contractsfrom 2004 to 2005
$3,229 with Army for Maintenance, Repair or Alteration of Real Property -- Water Supply Facilities. Signed on 2005-04-12. Completion date: 2005-04-15.
$0 with Army for Plumbing Fixtures and Accessories. Signed on 2004-01-06. Completion date: 2003-07-21.
-$1,230, same as above.Signed on 2004-01-06. Completion date: 2003-07-21.
Top industries in this zip code by the number of employees in 2005:
2002 - 2018 National Fire Incident Reporting System (NFIRS) incidents
According to the data from the years 2002 - 2018 the average number of fires per year is 55. The highest number of fire incidents - 81 took place in 2002, and the least - 33 in 2017. The data has a dropping trend.
When looking into fire subcategories, the most incidents belonged to: Structure Fires (39.2%), and Outside Fires (38.6%).
Fire incident types reported to NFIRS in Zip Code 51103
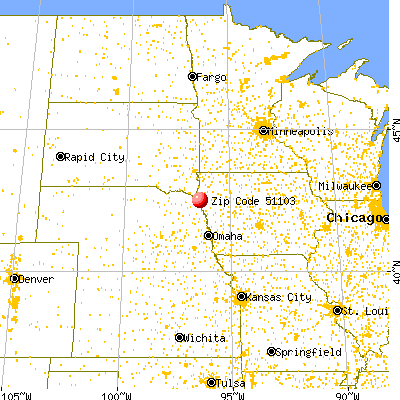


 Nearest zip codes: 51104, 68776, 51101, 57049, 51109, 51105.


 According to the data from the years 2002 - 2018 the average number of fires per year is 55. The highest number of fire incidents - 81 took place in 2002, and the least - 33 in 2017. The data has a dropping trend.
 When looking into fire subcategories, the most incidents belonged to: Structure Fires (39.2%), and Outside Fires (38.6%).