Estimated zip code population in 2022: 1,319 Zip code population in 2010: 1,249 Zip code population in 2000: 1,301
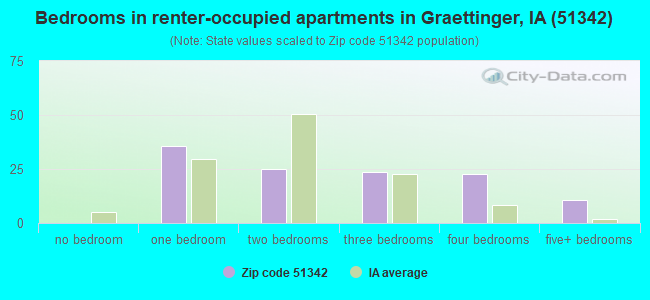
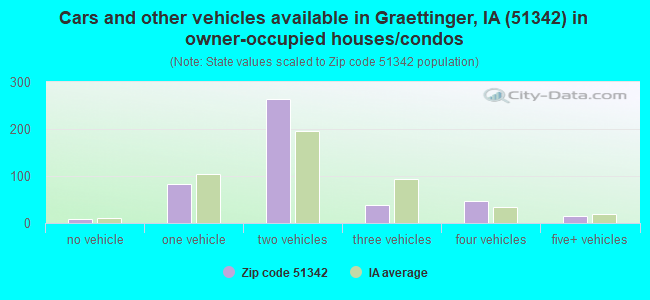
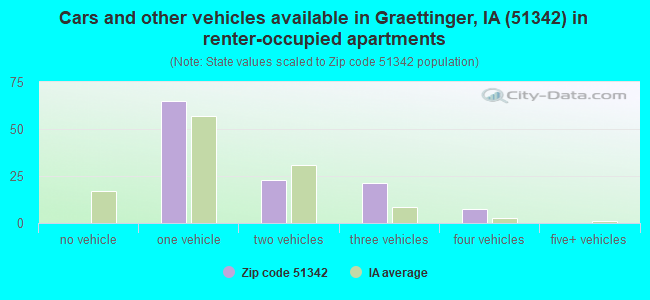
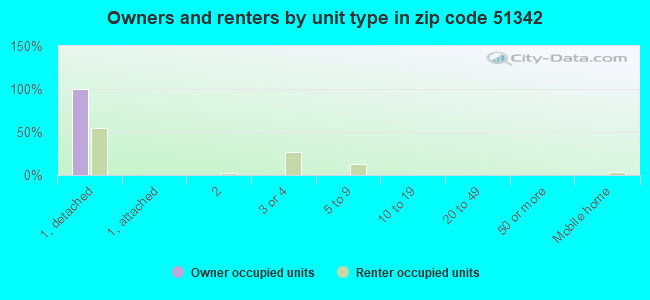
Houses and condos: 630 Renter-occupied apartments: 117
% of renters here:
20%
State:
28%
March 2022 cost of living index in zip code 51342: 80.6 (low, U.S. average is 100)
Land area: 82.6 sq. mi. Water area: 0.1 sq. mi.
Population density: 16 people per square mile
(very low).
OSM Map
General Map
Google Map
MSN Map
OSM Map
General Map
Google Map
MSN Map
OSM Map
General Map
Google Map
MSN Map
OSM Map
General Map
Google Map
MSN Map
Please wait while loading the map...
Real estate property taxes paid for housing units in 2022:
This zip code:
1.2% ($1,102)
Iowa:
1.4% ($2,724)
Median real estate property taxes paid for housing units with mortgages in 2022: $977 (1.1%) Median real estate property taxes paid for housing units with no mortgage in 2022: $1,416 (1.3%)
Business Search- 14 Million verified businesses
Males: 693
(52.6%)
Females: 626
(47.4%)
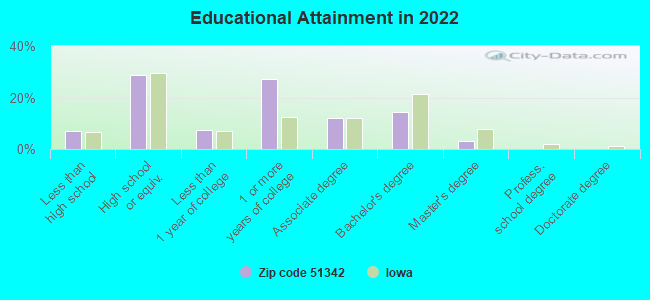
For population 25 years and over in 51342:
High school or higher: 91.5%
Bachelor's degree or higher: 17.3%
Graduate or professional degree: 3.3%
Unemployed: 0.8%
Mean travel time to work (commute): 21.6 minutes
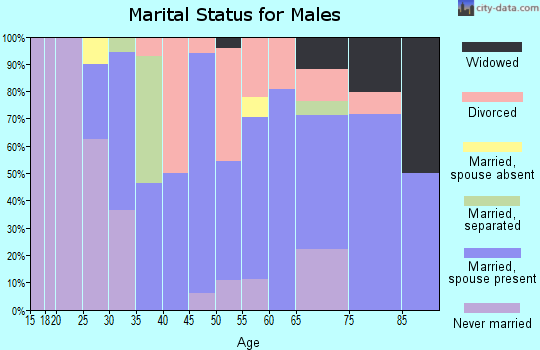
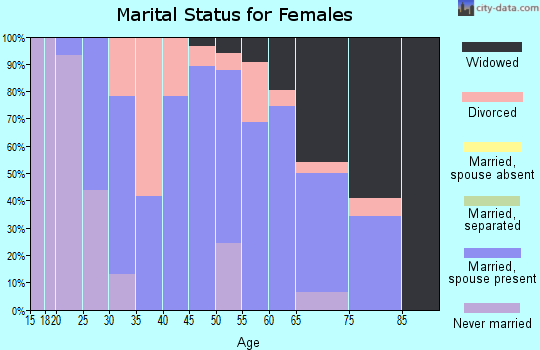
For population 15 years and over in 51342:
Never married: 26.8%
Now married: 54.8%
Separated: 1.2%
Widowed: 5.2%
Divorced: 12.0%
Zip code 51342 compared to state average:
Median house value below state average.
Unemployed percentage significantly below state average.
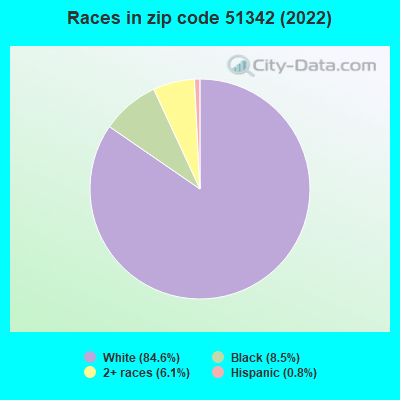
Black race population percentage above state average.
Hispanic race population percentage significantly below state average.
Number of college students below state average.
Percentage of population with a bachelor's degree or higher below state average.
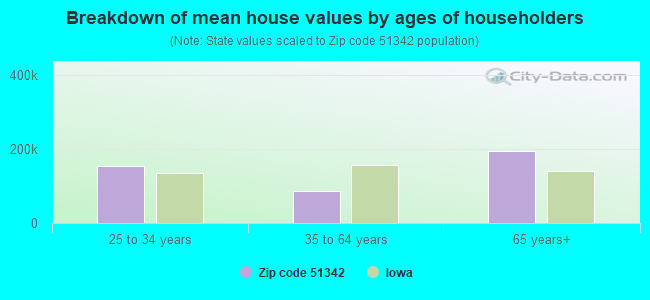
Estimated median house/condo value in 2022: $90,335
51342:
$90,335
Iowa:
$194,600
According to our research of Iowa and other state lists, there was 1 registered sex offender living in 51342 zip code as of April 28, 2024. The ratio of all residents to sex offenders in zip code 51342 is 1,217 to 1. The ratio of registered sex offenders to all residents in this zip code is much lower than the state average.
Median resident age:
This zip code:
42.6 years
Iowa median age:
38.9 years
Average household size:
This zip code:
2.3 people
Iowa:
2.3 people
Averages for the 2020 tax year for zip code 51342, filed in 2021:
Average Adjusted Gross Income (AGI) in 2020: $54,668 (Individual Income Tax Returns)
Here:
$54,668
State:
$71,087
Salary/wage: $46,939 (reported on 80.7% of returns)
Here:
$46,939
State:
$57,361
(% of AGI for various income ranges: 1384.5% for AGIs below $25k, 3940.8% for AGIs $25k-50k, 7145.0% for AGIs $50k-75k, 13146.7% for AGIs $75k-100k, 22383.3% for AGIs $100k-200k)
Taxable interest for individuals: $895 (reported on 33.3% of returns)
This zip code:
$895
Iowa:
$1,633
(% of AGI for various income ranges: 33.6% for AGIs below $25k, 3.8% for AGIs $25k-50k, 61.7% for AGIs $50k-75k, 56.7% for AGIs $75k-100k, 246.7% for AGIs $100k-200k)
Ordinary dividends: $2,244 (reported on 15.8% of returns)
Here:
$2,244
State:
$5,432
(% of AGI for various income ranges: 24.5% for AGIs below $25k, 178.3% for AGIs $50k-75k, 226.7% for AGIs $100k-200k)
Net capital gain/loss in AGI: +$2,912 (reported on 14.0% of returns)
Here:
+$2,912
State:
+$15,243
(% of AGI for various income ranges: 27.3% for AGIs below $25k, 151.7% for AGIs $50k-75k, 373.3% for AGIs $100k-200k)
Profit/loss from business: +$9,210 (reported on 17.5% of returns)
Here:
+$9,210
State:
+$11,763
(% of AGI for various income ranges: 211.8% for AGIs below $25k, 35.4% for AGIs $25k-50k, 485.0% for AGIs $50k-75k, 1170.0% for AGIs $100k-200k)
Taxable individual retirement arrangement distribution: $9,450 (reported on 7.0% of returns)
51342:
$9,450
Iowa:
$17,324
(% of AGI for various income ranges: 108.2% for AGIs below $25k, 431.7% for AGIs $50k-75k)
Earned income credit: $2,067 (reported on 15.8% of returns)
Here:
$2,067
State:
$2,195
(% of AGI for various income ranges: 92.7% for AGIs below $25k, 64.6% for AGIs $25k-50k)
Percentage of individuals using paid preparers for their 2020 taxes: 94.7%
Here:
95%
State:
95%
(% for various income ranges: 88.9% for AGIs below $25k, 94.1% for AGIs $25k-50k, 100.0% for AGIs $50k-75k, 100.0% for AGIs $75k-100k, 100.0% for AGIs $100k-200k)
Averages for the 2012 tax year for zip code 51342, filed in 2013:
Average Adjusted Gross Income (AGI) in 2012: $53,805 (Individual Income Tax Returns)
Here:
$53,805
State:
$58,860
Salary/wage: $34,915 (reported on 83.9% of returns)
Here:
$34,915
State:
$46,659
(% of AGI for various income ranges: 70.7% for AGIs below $25k, 79.9% for AGIs $25k-50k, 67.1% for AGIs $50k-75k, 74.4% for AGIs $75k-100k, 19.2% for AGIs $100k-200k)
Taxable interest for individuals: $700 (reported on 32.1% of returns)
This zip code:
$700
Iowa:
$1,537
(% of AGI for various income ranges: 1.8% for AGIs below $25k, 0.3% for AGIs $25k-50k, 0.4% for AGIs $50k-75k, 0.3% for AGIs $75k-100k, 0.2% for AGIs $100k-200k)
Ordinary dividends: $1,962 (reported on 14.3% of returns)
Here:
$1,962
State:
$4,542
(% of AGI for various income ranges: 1.5% for AGIs below $25k, 0.6% for AGIs $50k-75k, 1.5% for AGIs $75k-100k)
Net capital gain/loss in AGI: +$12,343 (reported on 12.5% of returns)
Here:
+$12,343
State:
+$11,802
Profit/loss from business: +$5,333 (reported on 16.1% of returns)
Here:
+$5,333
State:
+$10,509
(% of AGI for various income ranges: 8.0% for AGIs below $25k, 2.9% for AGIs $25k-50k, 1.5% for AGIs $50k-75k)
Taxable individual retirement arrangement distribution: $6,650 (reported on 10.7% of returns)
51342:
$6,650
Iowa:
$11,773
Total itemized deductions: $19,810 (20% of AGI, reported on 17.9% of returns)
Here:
$19,810
State:
$21,278
Here:
19.6% of AGI
State:
18.9% of AGI
(% of AGI for various income ranges: 7.5% for AGIs $25k-50k, 8.2% for AGIs $50k-75k, 7.5% for AGIs $75k-100k, 6.5% for AGIs $100k-200k)
Charity contributions: $2,233 (reported on 16.1% of returns)
Here:
$2,233
State:
$4,044
(% of AGI for various income ranges: 0.4% for AGIs $25k-50k, 1.1% for AGIs $50k-75k, 0.8% for AGIs $75k-100k, 0.7% for AGIs $100k-200k)
Taxes paid: $6,410 (reported on 17.9% of returns)
51342:
$6,410
State:
$8,846
(% of AGI for various income ranges: 1.3% for AGIs $25k-50k, 1.7% for AGIs $50k-75k, 2.4% for AGIs $75k-100k, 3.2% for AGIs $100k-200k)
Earned income credit: $1,950 (reported on 17.9% of returns)
Here:
$1,950
State:
$2,098
(% of AGI for various income ranges: 4.5% for AGIs below $25k, 1.1% for AGIs $25k-50k)
Percentage of individuals using paid preparers for their 2012 taxes: 73.2%
Here:
73%
State:
65%
(% for various income ranges: 61.9% for AGIs below $25k, 70.6% for AGIs $25k-50k, 87.5% for AGIs $50k-75k, 83.3% for AGIs $75k-100k, 100.0% for AGIs $100k-200k)
Averages for the 2004 tax year for zip code 51342, filed in 2005:
Average Adjusted Gross Income (AGI) in 2004: $33,057 (Individual Income Tax Returns)
Here:
$33,057
State:
$43,875
Salary/wage: $29,422 (reported on 83.3% of returns)
Here:
$29,422
State:
$38,265
(% of AGI for various income ranges: 82.1% for AGIs below $10k, 60.4% for AGIs $10k-25k, 83.0% for AGIs $25k-50k, 84.0% for AGIs $50k-75k, 149.0% for AGIs $75k-100k)
Taxable interest for individuals: $1,155 (reported on 44.9% of returns)
This zip code:
$1,155
Iowa:
$1,768
(% of AGI for various income ranges: 2.7% for AGIs below $10k, 3.8% for AGIs $10k-25k, 2.0% for AGIs $25k-50k, 0.6% for AGIs $50k-75k, 0.9% for AGIs $75k-100k)
Taxable dividends: $605 (reported on 21.8% of returns)
Here:
$605
State:
$2,510
Net capital gain/loss: +$1,808 (reported on 14.3% of returns)
Here:
+$1,808
State:
+$6,139
(% of AGI for various income ranges: 3.8% for AGIs below $10k, 1.8% for AGIs $10k-25k, 0.4% for AGIs $25k-50k, 0.9% for AGIs $50k-75k)
Profit/loss from business: +$3,511 (reported on 16.8% of returns)
Here:
+$3,511
State:
+$8,574
(% of AGI for various income ranges: 9.3% for AGIs below $10k, 5.6% for AGIs $10k-25k, 2.0% for AGIs $25k-50k, 0.1% for AGIs $50k-75k)
Profit/loss from farming: +$129 (reported on 11.4% of returns)
Here:
+$129
State:
-$74
IRA payment deduction: $2,750 (reported on 2.9% of returns)
51342:
$2,750
Iowa:
$2,970
Total itemized deductions: $14,258 (26% of AGI, reported on 17.8% of returns)
Here:
$14,258
State:
$16,976
Here:
25.7% of AGI
State:
20.8% of AGI
(% of AGI for various income ranges: 14.4% for AGIs $10k-25k, 5.9% for AGIs $25k-50k, 7.3% for AGIs $50k-75k, 11.2% for AGIs over 100k)
Charity contributions deductions: $1,682 (3% of AGI, reported on 16.1% of returns)
Here:
$1,682
State:
$3,089
Here:
3.2% of AGI
State:
3.6% of AGI
(% of AGI for various income ranges: 1.1% for AGIs $10k-25k, 0.7% for AGIs $25k-50k, 0.6% for AGIs $50k-75k, 3.3% for AGIs $75k-100k)
Total tax: $3,480 (reported on 72.9% of returns)
51342:
$3,480
State:
$6,177
(% of AGI for various income ranges: 4.0% for AGIs below $10k, 3.7% for AGIs $10k-25k, 6.5% for AGIs $25k-50k, 7.3% for AGIs $50k-75k, 10.1% for AGIs $75k-100k, 16.1% for AGIs over 100k)
Earned income credit: $1,526 (reported on 14.3% of returns)
Here:
$1,526
State:
$1,540
Percentage of individuals using paid preparers for their 2004 taxes: 78.4%
Here:
78%
State:
70%
(% for various income ranges: 67.6% for AGIs below $10k, 79.9% for AGIs $10k-25k, 81.2% for AGIs $25k-50k, 83.0% for AGIs $50k-75k, 71.4% for AGIs $75k-100k, 91.7% for AGIs over 100k)
Household received Food Stamps/SNAP in the past 12 months: 35 Household did not receive Food Stamps/SNAP in the past 12 months: 538
Women who had a birth in the past 12 months: 3 (3 now married, 0 unmarried) Women who did not have a birth in the past 12 months: 231 (133 now married, 97 unmarried)
Housing units in zip code 51342 with a mortgage: 302 (33 second mortgage, 17 both second mortgage and home equity loan) Median monthly owner costs for units with a mortgage: $1,095 Median monthly owner costs for units without a mortgage: $455
Residents with income below the poverty level in 2022:
This zip code:
4.8%
Whole state:
11.0%
Residents with income below 50% of the poverty level in 2022:
This zip code:
2.2%
Whole state:
5.5%
Median number of rooms in houses and condos:
Here:
7.2
State:
6.8
Median number of rooms in apartments:
Here:
4.5
State:
4.2
Notable locations in this zip code not listed on our city pages
Notable locations in zip code 51342: Graettinger (A), Hillcrest Golf and Country Club (B), Farmers Co-op Elevator (C), Palo Alto Community Ambulance Graettinger (D), Graettinger Fire Department (E), Graettinger Public Library (F), Graettinger Police Department (G), Graettinger City Hall (H), Lammers Museum (I). Display/hide their locations on the map
Churches in zip code 51342 include: Bethel Lutheran Church (A), Graettinger United Methodist Church (B), Immaculate Conception Church (C). Display/hide their locations on the map
Parks in zip code 51342 include: Evergreen Park (1), Fallow Marsh Wildlife Management Area (2), Riverview Wildlife Area (3). Display/hide their locations on the map
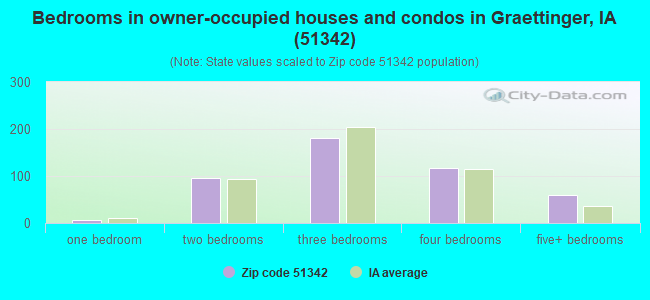
Size of family households: 215 2-persons, 33 3-persons, 52 4-persons, 38 5-persons, 7 6-persons, 29 7-or-more-persons
Size of nonfamily households: 181 1-person, 15 2-persons, 1 3-persons
280 married couples with children.
37 single-parent households (11 men, 26 women).
92.9% of residents of 51342 zip code speak English at home.
0.9% of residents speak Spanish at home (100% very well).
0.4% of residents speak other Indo-European language at home (100% very well).
4.3% of residents speak other language at home (13% very well, 87% well).
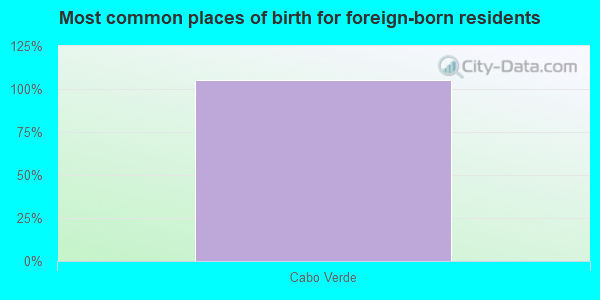
Foreign born population: 67 (5.1%) (100.0% of them are naturalized citizens)
This zip code:
5.1%
Whole state:
6.0%
105%Cabo Verde
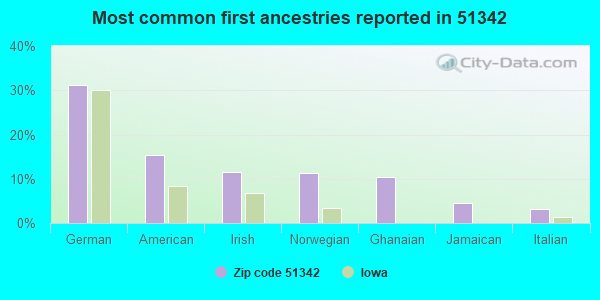
31%German
15%American
12%Irish
11%Norwegian
10%Ghanaian
4%Jamaican
3%Italian
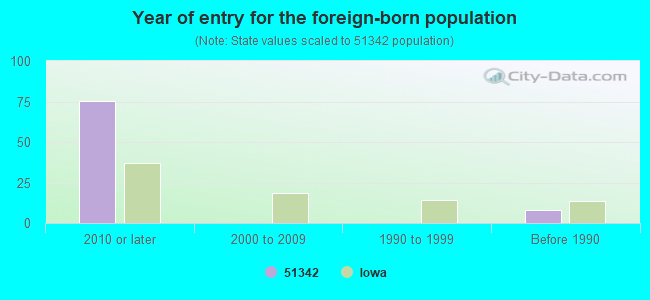
Year of entry for the foreign-born population
752010 or later
02000 to 2009
01990 to 1999
8Before 1990
Facilities with environmental interests located in this zip code:
SPIES FARM TRUST-FORMER SITE OF (MAIN ST in GRAETTINGER, IA)
(Resource Conservation and Recovery Act (tracking hazardous waste)) Business NAICS classification: ALL OTHER MISCELLANEOUS CROP FARMING.; SOIL PREPARATION, PLANTING, AND CULTIVATING.; FARM MANAGEMENT SERVICES. Organizations: X (CONTACT/OWNER)
SHAVER MANUFACTURING COMPANY (103 SOUTH WASHINGTON STREET in GRAETTINGER, IA)
AIR SYNTHETIC MINOR (AIRS/AFS) Conditionally Exempt Small Quantity Generators, less than 100 kg/month of hazardous waste (Resource Conservation and Recovery Act (tracking hazardous waste)) Business SIC classification: FARM MACHINERY AND EQUIPMENT; LAWN AND GARDEN TRACTORS AND HOME LAWN AND GARDEN EQUIPMENT
Housing units lacking complete plumbing facilities: 2.0% Housing units lacking complete kitchen facilities: 0.5%
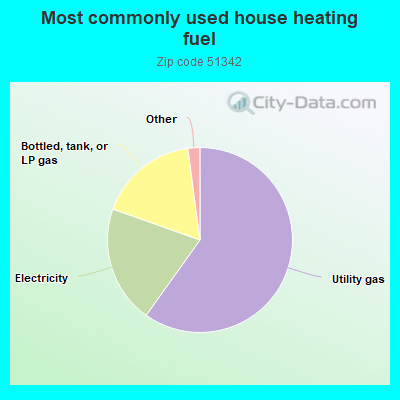
60.0%Utility gas
20.6%Electricity
17.5%Bottled, tank, or LP gas
0.9%Fuel oil, kerosene, etc.
0.7%No fuel used
0.5%Other fuel
Population in 1990: 1,259. Population change in the 1990s: +42 (+3.3%).
Place of birth for U.S.-born residents:
This state: 1,022
Northeast: 45
Midwest: 112
South: 28
West: 38
68% of the 51342 zip code residents lived in the same house 5 years ago. Out of people who lived in different houses, 50% lived in this county. Out of people who lived in different counties, 50% lived in Iowa.
86% of the 51342 zip code residents lived in the same house 1 year ago. Out of people who lived in different houses, 21% moved from this county. Out of people who lived in different houses, 53% moved from different county within same state. Out of people who lived in different houses, 26% moved from different state.
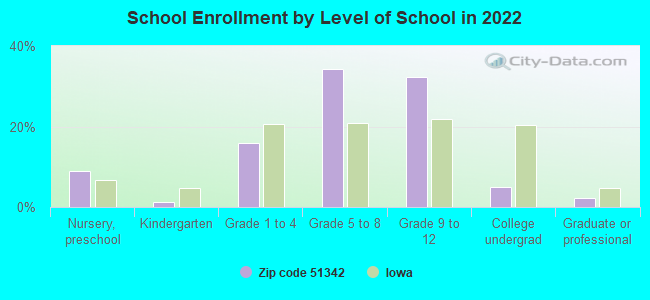
Private vs. public school enrollment:
Students in private schools in grades 1 to 8 (elementary and middle school): 17
Here:
11.3%
Iowa:
10.6%
Students in private schools in grades 9 to 12 (high school): 3
Here:
3.1%
Iowa:
7.9%
Students in private undergraduate colleges:
Here:
0.0%
Iowa:
23.9%
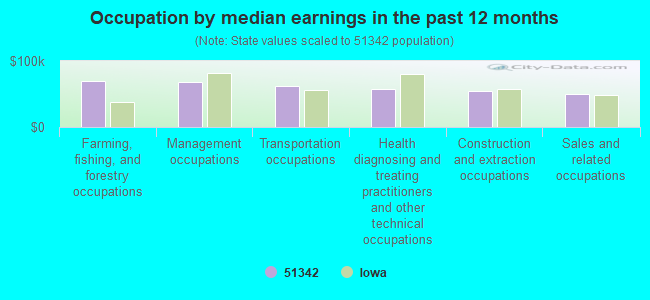
Occupation by median earnings in the past 12 months ($)
70,035Farming, fishing, and forestry occupations
68,292Management occupations
62,475Transportation occupations
58,320Health diagnosing and treating practitioners and other technical occupations
54,664Construction and extraction occupations
50,337Sales and related occupations
Top industries in this zip code by the number of employees in 2005:
Health Care and Social Assistance: Other Residential Care Facilities (20-49 employees: 1 establishment)
Health Care and Social Assistance: Other Individual and Family Services (20-49: 1)
Accommodation and Food Services: Full-Service Restaurants (5-9: 2, 1-4: 1)
Other Services (except Public Administration): Religious Organizations (5-9: 2, 1-4: 1)
Wholesale Trade: Grain and Field Bean Merchant Wholesalers (10-19: 1)
Finance and Insurance: Commercial Banking (5-9: 1)
People in group quarters in 2000:
10 people in unknown juvenile institutions
Fatal accident statistics in 2010:
Fatal accident count: 2
Vehicles involved in fatal accidents: 4
Fatal accidents caused by drunken drivers: 0
Fatalities: 2
Persons involved in fatal accidents: 4
Pedestrians involved in fatal accidents: 0
2002 - 2018 National Fire Incident Reporting System (NFIRS) incidents
Based on the data from the years 2002 - 2018 the average number of fire incidents per year is 8. The highest number of fire incidents - 15 took place in 2006, and the least - 1 in 2018. The data has a decreasing trend.
When looking into fire subcategories, the most incidents belonged to: Outside Fires (48.1%), and Structure Fires (36.4%).
Fire incident types reported to NFIRS in Zip Code 51342


+$129
-$74
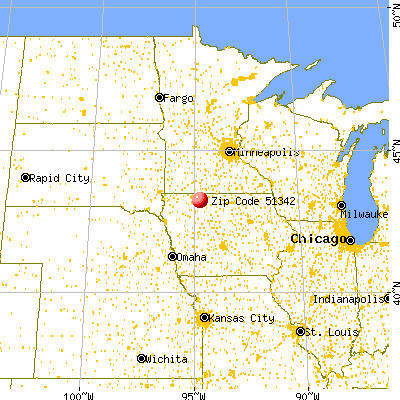
 Nearest zip codes: 51365, 50536, 51334, 50578, 51358, 50528.
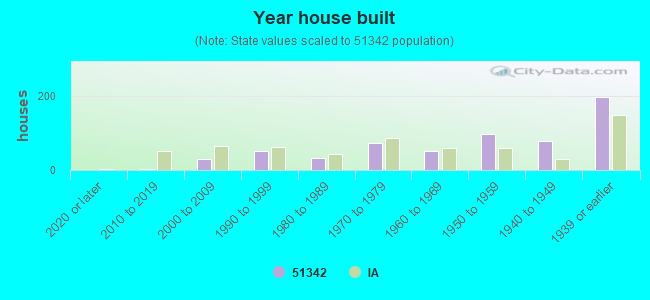


 Based on the data from the years 2002 - 2018 the average number of fire incidents per year is 8. The highest number of fire incidents - 15 took place in 2006, and the least - 1 in 2018. The data has a decreasing trend.
 When looking into fire subcategories, the most incidents belonged to: Outside Fires (48.1%), and Structure Fires (36.4%).