Estimated zip code population in 2022: 2,042 Zip code population in 2010: 2,099 Zip code population in 2000: 2,092
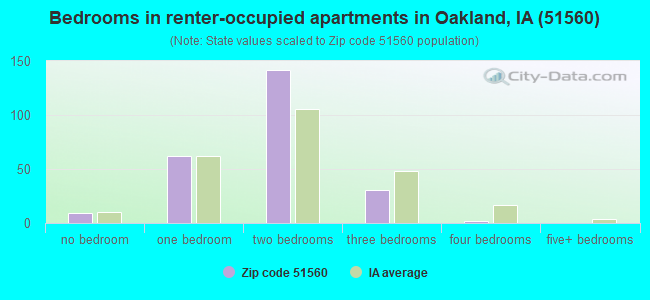
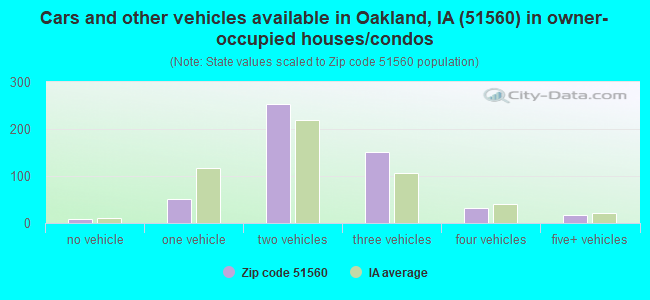
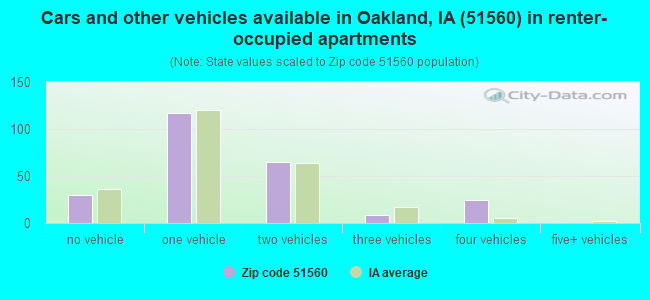
Houses and condos: 902 Renter-occupied apartments: 245
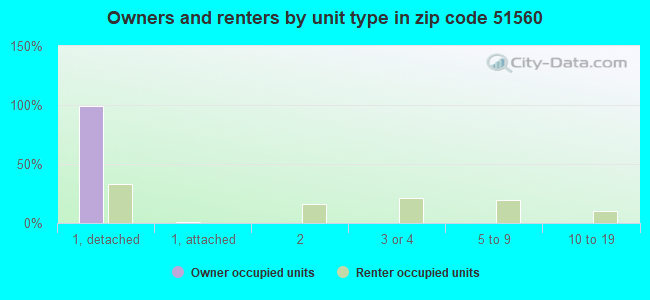
% of renters here:
32%
State:
28%
March 2022 cost of living index in zip code 51560: 82.5 (low, U.S. average is 100)
Land area: 97.4 sq. mi. Water area: 1.1 sq. mi.
Population density: 21 people per square mile
(very low).
OSM Map
General Map
Google Map
MSN Map
OSM Map
General Map
Google Map
MSN Map
OSM Map
General Map
Google Map
MSN Map
OSM Map
General Map
Google Map
MSN Map
Please wait while loading the map...
Real estate property taxes paid for housing units in 2022:
This zip code:
1.2% ($1,866)
Iowa:
1.4% ($2,724)
Median real estate property taxes paid for housing units with mortgages in 2022: $1,920 (1.1%) Median real estate property taxes paid for housing units with no mortgage in 2022: $1,776 (1.2%)
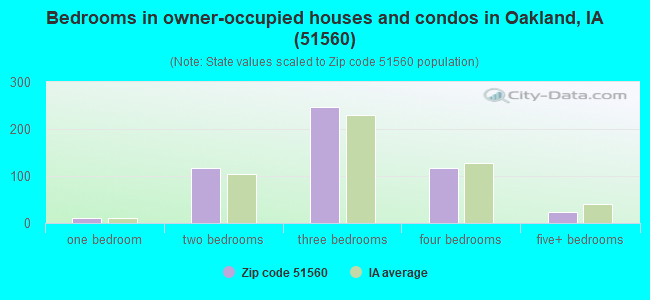
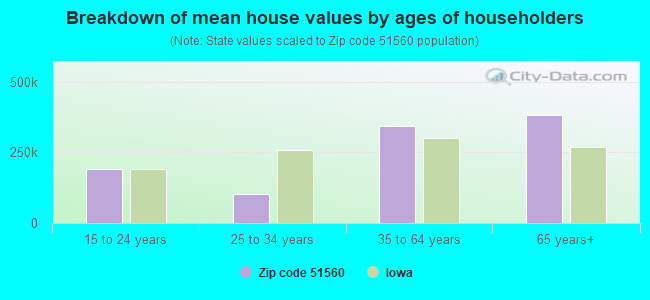
Estimated median house/condo value in 2022: $161,917
51560:
$161,917
Iowa:
$194,600
According to our research of Iowa and other state lists, there were 2 registered sex offenders living in 51560 zip code as of April 27, 2024. The ratio of all residents to sex offenders in zip code 51560 is 1,170 to 1. The ratio of registered sex offenders to all residents in this zip code is much lower than the state average.
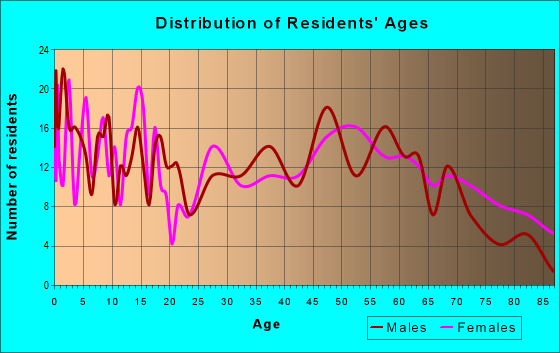
Median resident age:
This zip code:
38.1 years
Iowa median age:
38.9 years
Average household size:
This zip code:
2.6 people
Iowa:
2.3 people
Averages for the 2020 tax year for zip code 51560, filed in 2021:
Average Adjusted Gross Income (AGI) in 2020: $66,419 (Individual Income Tax Returns)
Here:
$66,419
State:
$71,087
Salary/wage: $56,158 (reported on 81.9% of returns)
Here:
$56,158
State:
$57,361
(% of AGI for various income ranges: 1064.0% for AGIs below $25k, 3843.7% for AGIs $25k-50k, 6713.3% for AGIs $50k-75k, 8942.9% for AGIs $75k-100k, 17881.1% for AGIs $100k-200k)
Taxable interest for individuals: $1,244 (reported on 34.0% of returns)
This zip code:
$1,244
Iowa:
$1,633
(% of AGI for various income ranges: 18.0% for AGIs below $25k, 22.1% for AGIs $25k-50k, 54.2% for AGIs $50k-75k, 40.0% for AGIs $75k-100k, 262.2% for AGIs $100k-200k)
Ordinary dividends: $4,519 (reported on 17.0% of returns)
Here:
$4,519
State:
$5,432
(% of AGI for various income ranges: 23.3% for AGIs below $25k, 36.8% for AGIs $25k-50k, 60.8% for AGIs $50k-75k, 35.7% for AGIs $75k-100k, 577.8% for AGIs $100k-200k)
Net capital gain/loss in AGI: +$11,981 (reported on 17.0% of returns)
Here:
+$11,981
State:
+$15,243
(% of AGI for various income ranges: 3.3% for AGIs below $25k, 55.3% for AGIs $25k-50k, 14.2% for AGIs $50k-75k, 205.7% for AGIs $75k-100k, 1828.9% for AGIs $100k-200k)
Profit/loss from business: +$6,883 (reported on 12.8% of returns)
Here:
+$6,883
State:
+$11,763
(% of AGI for various income ranges: 109.3% for AGIs below $25k, 40.0% for AGIs $25k-50k, 253.3% for AGIs $50k-75k, 313.3% for AGIs $100k-200k)
Taxable individual retirement arrangement distribution: $14,700 (reported on 11.7% of returns)
51560:
$14,700
Iowa:
$17,324
(% of AGI for various income ranges: 174.7% for AGIs $25k-50k, 480.8% for AGIs $50k-75k, 786.7% for AGIs $100k-200k)
Total itemized deductions: $24,875 (reported on 4.3% of returns)
Here:
$24,875
State:
$33,775
(% of AGI for various income ranges: 1105.6% for AGIs $100k-200k)
Charity contributions: $5,867 (reported on 3.2% of returns)
Here:
$5,867
State:
$13,075
(% of AGI for various income ranges: 251.4% for AGIs $75k-100k)
Taxes paid: $7,467 (reported on 3.2% of returns)
51560:
$7,467
State:
$7,704
(% of AGI for various income ranges: 248.9% for AGIs $100k-200k)
Earned income credit: $2,367 (reported on 9.6% of returns)
Here:
$2,367
State:
$2,195
(% of AGI for various income ranges: 68.7% for AGIs below $25k, 57.9% for AGIs $25k-50k)
Percentage of individuals using paid preparers for their 2020 taxes: 95.7%
Here:
96%
State:
95%
(% for various income ranges: 90.5% for AGIs below $25k, 100.0% for AGIs $25k-50k, 100.0% for AGIs $50k-75k, 90.0% for AGIs $75k-100k, 94.1% for AGIs $100k-200k, 100.0% for AGIs over 200k)
Averages for the 2012 tax year for zip code 51560, filed in 2013:
Average Adjusted Gross Income (AGI) in 2012: $54,228 (Individual Income Tax Returns)
Here:
$54,228
State:
$58,860
Salary/wage: $43,544 (reported on 83.3% of returns)
Here:
$43,544
State:
$46,659
(% of AGI for various income ranges: 67.5% for AGIs below $25k, 77.0% for AGIs $25k-50k, 79.0% for AGIs $50k-75k, 78.6% for AGIs $75k-100k, 85.5% for AGIs $100k-200k)
Taxable interest for individuals: $1,480 (reported on 36.5% of returns)
This zip code:
$1,480
Iowa:
$1,537
(% of AGI for various income ranges: 1.6% for AGIs below $25k, 0.9% for AGIs $25k-50k, 0.4% for AGIs $50k-75k, 0.6% for AGIs $75k-100k, 2.3% for AGIs $100k-200k)
Ordinary dividends: $2,689 (reported on 19.8% of returns)
Here:
$2,689
State:
$4,542
(% of AGI for various income ranges: 2.1% for AGIs below $25k, 0.8% for AGIs $25k-50k, 0.6% for AGIs $50k-75k, 0.5% for AGIs $75k-100k, 2.1% for AGIs $100k-200k)
Net capital gain/loss in AGI: +$1,712 (reported on 16.7% of returns)
Here:
+$1,712
State:
+$11,802
(% of AGI for various income ranges: 0.1% for AGIs $25k-50k, 0.7% for AGIs $50k-75k, 1.7% for AGIs $100k-200k)
Profit/loss from business: +$5,892 (reported on 13.5% of returns)
Here:
+$5,892
State:
+$10,509
(% of AGI for various income ranges: 6.7% for AGIs below $25k, 1.7% for AGIs $25k-50k, 0.5% for AGIs $50k-75k, 2.4% for AGIs $100k-200k)
Taxable individual retirement arrangement distribution: $10,245 (reported on 11.5% of returns)
51560:
$10,245
Iowa:
$11,773
(% of AGI for various income ranges: 3.3% for AGIs below $25k, 2.1% for AGIs $25k-50k, 3.4% for AGIs $50k-75k, 3.9% for AGIs $100k-200k)
Total itemized deductions: $17,393 (19% of AGI, reported on 30.2% of returns)
Here:
$17,393
State:
$21,278
Here:
19.0% of AGI
State:
18.9% of AGI
(% of AGI for various income ranges: 14.1% for AGIs below $25k, 9.3% for AGIs $25k-50k, 7.2% for AGIs $50k-75k, 9.6% for AGIs $75k-100k, 17.3% for AGIs $100k-200k)
Charity contributions: $3,033 (reported on 21.9% of returns)
Here:
$3,033
State:
$4,044
(% of AGI for various income ranges: 0.7% for AGIs below $25k, 0.6% for AGIs $25k-50k, 0.7% for AGIs $50k-75k, 1.4% for AGIs $75k-100k, 3.0% for AGIs $100k-200k)
Taxes paid: $6,376 (reported on 30.2% of returns)
51560:
$6,376
State:
$8,846
(% of AGI for various income ranges: 2.0% for AGIs below $25k, 1.8% for AGIs $25k-50k, 1.9% for AGIs $50k-75k, 3.6% for AGIs $75k-100k, 9.3% for AGIs $100k-200k)
Earned income credit: $2,127 (reported on 15.6% of returns)
Here:
$2,127
State:
$2,098
(% of AGI for various income ranges: 6.0% for AGIs below $25k, 0.9% for AGIs $25k-50k)
Percentage of individuals using paid preparers for their 2012 taxes: 77.1%
Here:
77%
State:
65%
(% for various income ranges: 68.8% for AGIs below $25k, 81.5% for AGIs $25k-50k, 75.0% for AGIs $50k-75k, 80.0% for AGIs $75k-100k, 88.9% for AGIs $100k-200k, 100.0% for AGIs over 200k)
Averages for the 2004 tax year for zip code 51560, filed in 2005:
Average Adjusted Gross Income (AGI) in 2004: $39,510 (Individual Income Tax Returns)
Here:
$39,510
State:
$43,875
Salary/wage: $37,172 (reported on 82.7% of returns)
Here:
$37,172
State:
$38,265
(% of AGI for various income ranges: 134.3% for AGIs below $10k, 67.8% for AGIs $10k-25k, 77.5% for AGIs $25k-50k, 82.2% for AGIs $50k-75k, 85.8% for AGIs $75k-100k, 66.1% for AGIs over 100k)
Taxable interest for individuals: $1,990 (reported on 50.9% of returns)
This zip code:
$1,990
Iowa:
$1,768
(% of AGI for various income ranges: 15.1% for AGIs below $10k, 5.5% for AGIs $10k-25k, 3.2% for AGIs $25k-50k, 1.4% for AGIs $50k-75k, 1.7% for AGIs $75k-100k, 1.6% for AGIs over 100k)
Taxable dividends: $1,730 (reported on 25.0% of returns)
Here:
$1,730
State:
$2,510
(% of AGI for various income ranges: 2.7% for AGIs below $10k, 1.4% for AGIs $10k-25k, 1.2% for AGIs $25k-50k, 0.3% for AGIs $50k-75k, 0.3% for AGIs $75k-100k, 2.4% for AGIs over 100k)
Net capital gain/loss: +$2,882 (reported on 19.4% of returns)
Here:
+$2,882
State:
+$6,139
(% of AGI for various income ranges: -0.7% for AGIs below $10k, 0.8% for AGIs $10k-25k, 0.6% for AGIs $25k-50k, 0.4% for AGIs $50k-75k, -0.2% for AGIs $75k-100k, 5.4% for AGIs over 100k)
Profit/loss from business: +$6,082 (reported on 15.1% of returns)
Here:
+$6,082
State:
+$8,574
(% of AGI for various income ranges: 0.9% for AGIs below $10k, 5.1% for AGIs $10k-25k, 3.0% for AGIs $25k-50k, 3.3% for AGIs $50k-75k, 0.1% for AGIs $75k-100k, 0.6% for AGIs over 100k)
Profit/loss from farming: +$4,426 (reported on 6.3% of returns)
Here:
+$4,426
State:
-$74
IRA payment deduction: $3,167 (reported on 3.7% of returns)
51560:
$3,167
Iowa:
$2,970
Total itemized deductions: $15,534 (23% of AGI, reported on 30.7% of returns)
Here:
$15,534
State:
$16,976
Here:
23.3% of AGI
State:
20.8% of AGI
(% of AGI for various income ranges: 41.7% for AGIs below $10k, 17.2% for AGIs $10k-25k, 8.2% for AGIs $25k-50k, 11.6% for AGIs $50k-75k, 14.0% for AGIs $75k-100k, 10.7% for AGIs over 100k)
Charity contributions deductions: $1,732 (2% of AGI, reported on 25.5% of returns)
Here:
$1,732
State:
$3,089
Here:
2.5% of AGI
State:
3.6% of AGI
(% of AGI for various income ranges: 1.2% for AGIs $10k-25k, 0.7% for AGIs $25k-50k, 1.2% for AGIs $50k-75k, 1.6% for AGIs $75k-100k, 1.2% for AGIs over 100k)
Total tax: $4,950 (reported on 76.1% of returns)
51560:
$4,950
State:
$6,177
(% of AGI for various income ranges: 3.9% for AGIs below $10k, 4.5% for AGIs $10k-25k, 6.7% for AGIs $25k-50k, 8.4% for AGIs $50k-75k, 10.0% for AGIs $75k-100k, 16.8% for AGIs over 100k)
Earned income credit: $1,413 (reported on 10.8% of returns)
Here:
$1,413
State:
$1,540
Percentage of individuals using paid preparers for their 2004 taxes: 78.8%
Here:
79%
State:
70%
(% for various income ranges: 70.7% for AGIs below $10k, 76.7% for AGIs $10k-25k, 80.7% for AGIs $25k-50k, 86.4% for AGIs $50k-75k, 75.4% for AGIs $75k-100k, 86.5% for AGIs over 100k)
Likely homosexual households (counted as self-reported same-sex unmarried-partner households)
Lesbian couples: 1.0% of all households
Gay men: 0.0% of all households
Household received Food Stamps/SNAP in the past 12 months: 92 Household did not receive Food Stamps/SNAP in the past 12 months: 666
Women who had a birth in the past 12 months: 30 (11 now married, 17 unmarried) Women who did not have a birth in the past 12 months: 382 (168 now married, 214 unmarried)
Housing units in zip code 51560 with a mortgage: 295 (14 second mortgage, 11 both second mortgage and home equity loan) Houses without a mortgage: 1
Median monthly owner costs for units with a mortgage: $1,160 Median monthly owner costs for units without a mortgage: $524
Residents with income below the poverty level in 2022:
This zip code:
15.5%
Whole state:
11.0%
Residents with income below 50% of the poverty level in 2022:
This zip code:
13.2%
Whole state:
5.5%
Median number of rooms in houses and condos:
Here:
6.9
State:
6.8
Median number of rooms in apartments:
Here:
4.8
State:
4.2
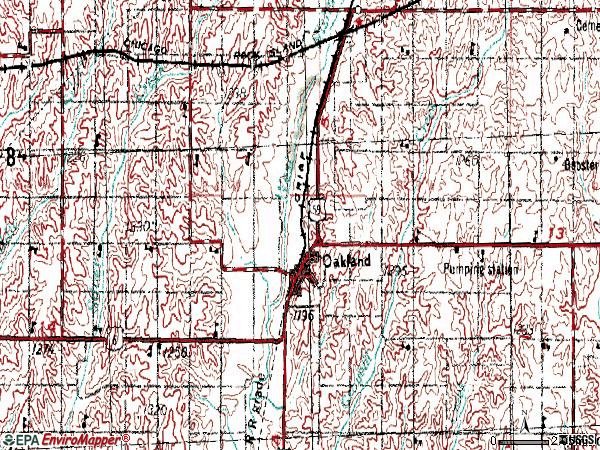
Notable locations in this zip code not listed on our city pages
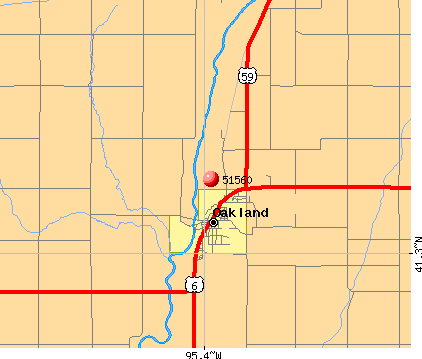
Notable locations in zip code 51560: Oakland Elevator (A), Oakland (B), Oakland Country Club (C), Nishna Heritage Museum (D), Oakland Fire and Rescue Department (E), Eckels Memorial Library (F). Display/hide their locations on the map
Churches in zip code 51560 include: United Methodist Church (A), First Congregational Church (B), Saint Pauls Lutheran Church (C), Oakland Christian Church (D), Fellowship of Faith Christian Center (E), Harlan Mission Lutheran Church (F), Sharon Church (G). Display/hide their locations on the map
285 married couples with children.
213 single-parent households (55 men, 158 women).
87.0% of residents of 51560 zip code speak English at home.
10.1% of residents speak Spanish at home (37% very well, 17% well, 21% not well, 25% not at all).
3.7% of residents speak other Indo-European language at home (39% very well, 47% well, 14% not well).
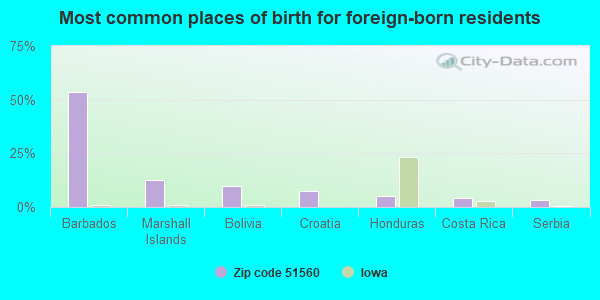
Foreign born population: 238 (11.7%) (43.0% of them are naturalized citizens)
This zip code:
11.7%
Whole state:
6.0%
54%Barbados
13%Marshall Islands
10%Bolivia
7%Croatia
5%Honduras
4%Costa Rica
3%Serbia
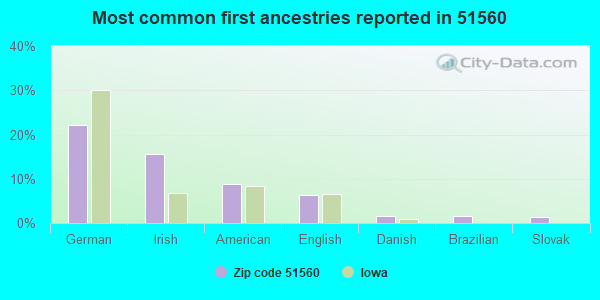
22%German
16%Irish
9%American
6%English
2%Danish
2%Brazilian
1%Slovak
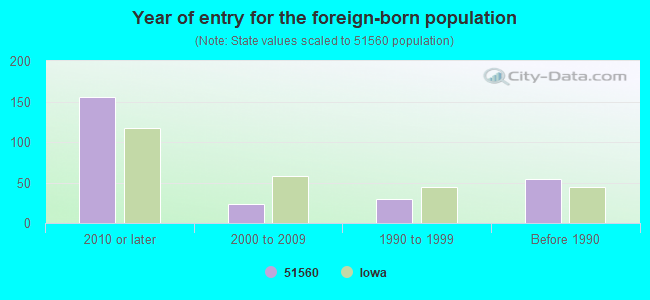
Year of entry for the foreign-born population
1552010 or later
242000 to 2009
301990 to 1999
54Before 1990
Facilities with environmental interests located in this zip code:
RIVERSIDE COMMUNITY HIGH SCHOOL (501 OAKLAND AVE in OAKLAND, IA)
(Geographic Names Information System) (National Center for Education Statistics) - STATE ID-785510 209 Organizations: RIVERSIDE COMM SCHOOL DISTRICT (SCHOOL DISTRICT)
NORTHERN NATURAL GAS COMPANY (46322 HIGHWAY 6 in OAKLAND, IA)
AIR MAJOR (AIRS/AFS) National Pollutant Discharge Elimination System NON-MAJOR (Tracking pollutant discharge elimination systems) - permit Conditionally Exempt Small Quantity Generators, less than 100 kg/month of hazardous waste (Resource Conservation and Recovery Act (tracking hazardous waste)) - notification Business SIC classification: NATURAL GAS TRANSMISSION; NATURAL GAS TRANSMISSION AND DISTRIBUTION Organizations: NORTHERN NATURAL GAS CO (CONTACT/OPERATOR)
, NORTHERN NATURAL GAS CO. (CONTACT/OWNER)
Alternative names: NORTHERN NATURAL GAS CO. OAKLA
RIVERSIDE ELEMENTARY (708 GLASS ST in OAKLAND, IA)
(National Center for Education Statistics) - STATE ID-785510 418 Organizations: RIVERSIDE COMM SCHOOL DISTRICT (SCHOOL DISTRICT)
OAKLAND FOODS LLC (21876 HIGHWAY 59 in OAKLAND, IA)
AIR SYNTHETIC MINOR (AIRS/AFS) National Pollutant Discharge Elimination System NON-MAJOR (Tracking pollutant discharge elimination systems) - permit TRI REPORTER (Tracking of toxic chemicals releasing facilities) Business SIC classification: SAUSAGES AND OTHER PREPARED MEAT PRODUCTS Organizations: OAKLAND FOODS, L.L.C. (CONTACT/OWNER)
Alternative names: OAKLAND FOODS CORP
OAKLAND CITY OF STP (CITY CLERK in OAKLAND, IA)
National Pollutant Discharge Elimination System NON-MAJOR (Tracking pollutant discharge elimination systems) - permit Business SIC classification: SEWERAGE SYSTEMS Organizations: CITY OF OAKLAND (CONTACT/OWNER)
CODY FARMS (47750 DOGWOOD ROAD in OAKLAND, IA)
National Pollutant Discharge Elimination System NON-MAJOR (Tracking pollutant discharge elimination systems) - permit Business SIC classification: BEEF CATTLE FEEDLOTS
OAKLAND FEEDING CORP (RR in OAKLAND, IA)
AIR MINOR (AIRS/AFS) Business SIC classification: GRAIN AND FIELD BEANS Alternative names: CLOSED FACILITY -- OAKLAND FEEDING CORP
NORTHERN NATURAL GAS CO-OAKLAND COMPRESSOR (46299 HIGHWAY 6 in OAKLAND, IA)
CRITERIA AND HAZARDOUS AIR POLLUTANT INVENTORY (Inventory of air pollution sources) Business SIC classification: NATURAL GAS TRANSMISSION
OAKLAND COMMUNITY SCHOOL DISTRICT (501 OAKLAND in OAKLAND, IA)
COMPLIANCE ACTIVITY (Tracking inspections of insecticide, fungicide, and rodenticide, and toxic substances)
OAKLAND FORD INC (HWY 59 AND 6 N, NE CORNER in OAKLAND, IA)
Conditionally Exempt Small Quantity Generators, less than 100 kg/month of hazardous waste (Resource Conservation and Recovery Act (tracking hazardous waste)) Business NAICS classification: GENERAL AUTOMOTIVE REPAIR.
Housing units lacking complete plumbing facilities: 3.6% Housing units lacking complete kitchen facilities: 6.4%
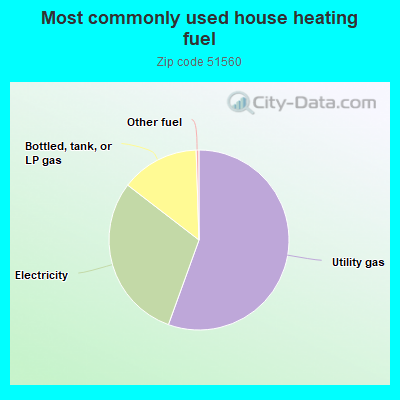
55.7%Utility gas
30.0%Electricity
14.1%Bottled, tank, or LP gas
0.5%Other fuel
Population in 1990: 2,385.
Place of birth for U.S.-born residents:
This state: 1,088
Northeast: 19
Midwest: 521
South: 56
West: 98
61% of the 51560 zip code residents lived in the same house 5 years ago. Out of people who lived in different houses, 68% lived in this county. Out of people who lived in different counties, 50% lived in Iowa.
94% of the 51560 zip code residents lived in the same house 1 year ago. Out of people who lived in different houses, 72% moved from this county. Out of people who lived in different houses, 4% moved from different county within same state. Out of people who lived in different houses, 13% moved from different state. Out of people who lived in different houses, 11% moved from abroad.
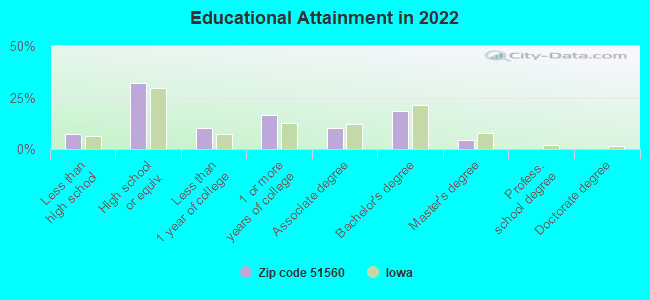
Private vs. public school enrollment:
Students in private schools in grades 1 to 8 (elementary and middle school):
Here:
0.0%
Iowa:
10.6%
Students in private schools in grades 9 to 12 (high school): 5
Here:
4.3%
Iowa:
7.9%
Students in private undergraduate colleges: 5
Here:
9.7%
Iowa:
23.9%
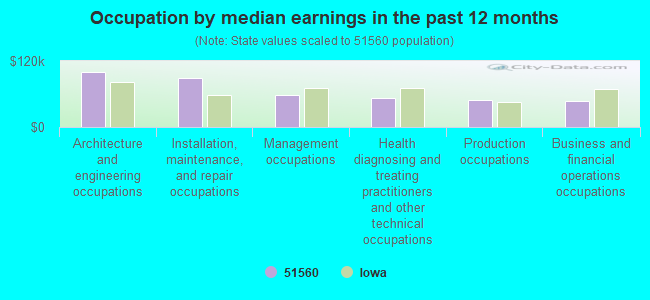
Occupation by median earnings in the past 12 months ($)
99,701Architecture and engineering occupations
89,517Installation, maintenance, and repair occupations
57,560Management occupations
51,840Health diagnosing and treating practitioners and other technical occupations
49,713Production occupations
47,975Business and financial operations occupations
Top industries in this zip code by the number of employees in 2005:
Health Care and Social Assistance: Continuing Care Retirement Communities (50-99 employees: 1 establishment)
Finance and Insurance: Commercial Banking (10-19: 1, 5-9: 1)
Other Services (except Public Administration): Religious Organizations (10-19: 1, 1-4: 2)
Construction: Site Preparation Contractors (10-19: 1, 1-4: 1)
Construction: Water and Sewer Line and Related Structures Construction (10-19: 1)
Accommodation and Food Services: Limited-Service Restaurants (10-19: 1)
People in group quarters in 2010:
53 people in nursing facilities/skilled-nursing facilities
People in group quarters in 2000:
64 people in nursing homes
Fatal accident statistics in 2014:
Fatal accident count: 1
Vehicles involved in fatal accidents: 1
Fatal accidents caused by drunken drivers: 0
Fatalities: 2
Persons involved in fatal accidents: 2
Pedestrians involved in fatal accidents: 0
Fatal accident statistics in 2011:
Fatal accident count: 1
Vehicles involved in fatal accidents: 2
Fatal accidents caused by drunken drivers: 0
Fatalities: 2
Persons involved in fatal accidents: 9
Pedestrians involved in fatal accidents: 0
Home Mortgage Disclosure Act Aggregated Statistics For Year 2009 (Based on 8 partial tracts)
A) FHA, FSA/RHS & VA Home Purchase Loans
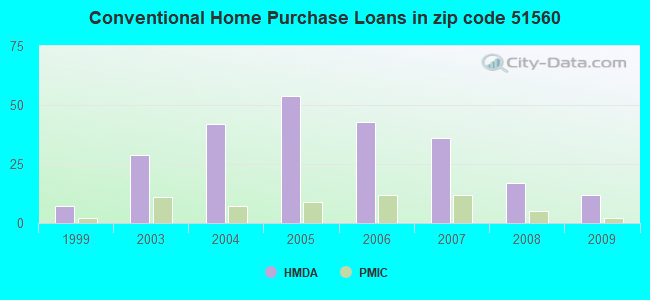
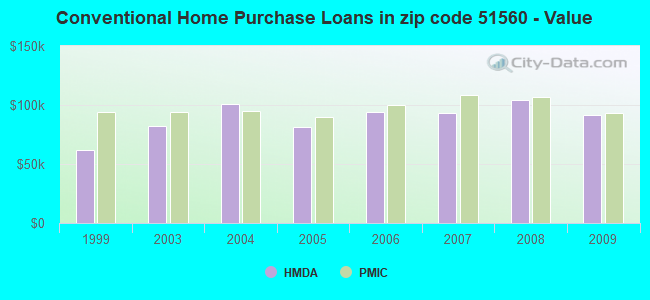
B) Conventional Home Purchase Loans
C) Refinancings
D) Home Improvement Loans
E) Loans on Dwellings For 5+ Families
F) Non-occupant Loans on < 5 Family Dwellings (A B C & D)
G) Loans On Manufactured Home Dwelling (A B C & D)
Number
Average Value
Number
Average Value
Number
Average Value
Number
Average Value
Number
Average Value
Number
Average Value
Number
Average Value
LOANS ORIGINATED
12
$114,008
12
$91,295
60
$132,982
11
$47,949
1
$323,400
7
$47,200
1
$144,770
APPLICATIONS APPROVED, NOT ACCEPTED
0
$0
0
$0
9
$122,438
2
$55,095
0
$0
0
$0
1
$76,170
APPLICATIONS DENIED
4
$105,028
4
$66,730
24
$124,119
4
$30,022
0
$0
1
$86,800
1
$57,200
APPLICATIONS WITHDRAWN
0
$0
2
$72,730
14
$143,529
2
$40,675
0
$0
0
$0
0
$0
FILES CLOSED FOR INCOMPLETENESS
0
$0
0
$0
2
$127,230
0
$0
0
$0
0
$0
0
$0
Aggregated Statistics For Year 2008 (Based on 8 partial tracts)
A) FHA, FSA/RHS & VA Home Purchase Loans
B) Conventional Home Purchase Loans
C) Refinancings
D) Home Improvement Loans
F) Non-occupant Loans on < 5 Family Dwellings (A B C & D)
G) Loans On Manufactured Home Dwelling (A B C & D)
Number
Average Value
Number
Average Value
Number
Average Value
Number
Average Value
Number
Average Value
Number
Average Value
LOANS ORIGINATED
11
$110,261
17
$104,255
32
$117,647
12
$18,007
7
$66,297
1
$30,130
APPLICATIONS APPROVED, NOT ACCEPTED
1
$133,010
0
$0
2
$109,310
1
$27,560
0
$0
0
$0
APPLICATIONS DENIED
2
$95,185
4
$89,498
26
$117,639
7
$40,217
2
$77,870
1
$127,160
APPLICATIONS WITHDRAWN
1
$144,820
2
$106,020
9
$123,996
1
$83,460
2
$73,285
0
$0
FILES CLOSED FOR INCOMPLETENESS
0
$0
0
$0
3
$136,743
0
$0
0
$0
0
$0
Aggregated Statistics For Year 2007 (Based on 8 partial tracts)
A) FHA, FSA/RHS & VA Home Purchase Loans
B) Conventional Home Purchase Loans
C) Refinancings
D) Home Improvement Loans
F) Non-occupant Loans on < 5 Family Dwellings (A B C & D)
G) Loans On Manufactured Home Dwelling (A B C & D)
Number
Average Value
Number
Average Value
Number
Average Value
Number
Average Value
Number
Average Value
Number
Average Value
LOANS ORIGINATED
2
$132,285
36
$93,236
36
$96,460
10
$20,869
5
$61,588
2
$44,400
APPLICATIONS APPROVED, NOT ACCEPTED
0
$0
4
$69,952
15
$106,747
0
$0
0
$0
0
$0
APPLICATIONS DENIED
0
$0
11
$82,341
37
$90,384
8
$37,346
3
$103,100
1
$66,980
APPLICATIONS WITHDRAWN
1
$54,700
3
$64,287
11
$113,941
1
$101,390
1
$41,580
0
$0
FILES CLOSED FOR INCOMPLETENESS
0
$0
2
$99,430
4
$115,368
0
$0
1
$53,980
0
$0
Aggregated Statistics For Year 2006 (Based on 8 partial tracts)
A) FHA, FSA/RHS & VA Home Purchase Loans
B) Conventional Home Purchase Loans
C) Refinancings
D) Home Improvement Loans
E) Loans on Dwellings For 5+ Families
F) Non-occupant Loans on < 5 Family Dwellings (A B C & D)
G) Loans On Manufactured Home Dwelling (A B C & D)
Number
Average Value
Number
Average Value
Number
Average Value
Number
Average Value
Number
Average Value
Number
Average Value
Number
Average Value
LOANS ORIGINATED
3
$118,910
43
$93,963
59
$94,318
20
$31,416
1
$282,280
7
$86,950
1
$100,820
APPLICATIONS APPROVED, NOT ACCEPTED
0
$0
3
$65,277
7
$109,687
2
$12,985
0
$0
0
$0
0
$0
APPLICATIONS DENIED
0
$0
9
$75,681
38
$102,539
9
$41,100
0
$0
1
$80,230
1
$25,500
APPLICATIONS WITHDRAWN
0
$0
5
$94,538
14
$88,189
0
$0
0
$0
0
$0
0
$0
FILES CLOSED FOR INCOMPLETENESS
0
$0
1
$30,630
5
$144,876
1
$18,530
0
$0
0
$0
0
$0
Aggregated Statistics For Year 2005 (Based on 8 partial tracts)
A) FHA, FSA/RHS & VA Home Purchase Loans
B) Conventional Home Purchase Loans
C) Refinancings
D) Home Improvement Loans
F) Non-occupant Loans on < 5 Family Dwellings (A B C & D)
G) Loans On Manufactured Home Dwelling (A B C & D)
Number
Average Value
Number
Average Value
Number
Average Value
Number
Average Value
Number
Average Value
Number
Average Value
LOANS ORIGINATED
6
$98,487
54
$81,267
64
$95,670
14
$21,766
11
$48,934
1
$28,660
APPLICATIONS APPROVED, NOT ACCEPTED
1
$71,480
13
$81,106
9
$93,862
1
$32,320
0
$0
1
$76,950
APPLICATIONS DENIED
1
$46,400
13
$70,485
38
$96,517
10
$32,695
0
$0
1
$84,320
APPLICATIONS WITHDRAWN
0
$0
8
$78,619
22
$96,207
2
$21,625
1
$75,180
0
$0
FILES CLOSED FOR INCOMPLETENESS
0
$0
2
$102,835
12
$99,634
0
$0
0
$0
0
$0
Aggregated Statistics For Year 2004 (Based on 8 partial tracts)
A) FHA, FSA/RHS & VA Home Purchase Loans
B) Conventional Home Purchase Loans
C) Refinancings
D) Home Improvement Loans
F) Non-occupant Loans on < 5 Family Dwellings (A B C & D)
G) Loans On Manufactured Home Dwelling (A B C & D)
Number
Average Value
Number
Average Value
Number
Average Value
Number
Average Value
Number
Average Value
Number
Average Value
LOANS ORIGINATED
3
$138,290
42
$100,587
79
$100,023
17
$32,949
6
$92,523
2
$89,010
APPLICATIONS APPROVED, NOT ACCEPTED
1
$109,410
2
$80,080
11
$104,955
4
$47,485
0
$0
0
$0
APPLICATIONS DENIED
2
$87,380
9
$71,251
50
$90,342
13
$33,750
4
$61,358
1
$86,800
APPLICATIONS WITHDRAWN
0
$0
7
$95,430
16
$82,593
1
$130,910
0
$0
0
$0
FILES CLOSED FOR INCOMPLETENESS
0
$0
2
$66,820
8
$95,118
0
$0
0
$0
0
$0
Aggregated Statistics For Year 2003 (Based on 8 partial tracts)
A) FHA, FSA/RHS & VA Home Purchase Loans
B) Conventional Home Purchase Loans
C) Refinancings
D) Home Improvement Loans
F) Non-occupant Loans on < 5 Family Dwellings (A B C & D)
Number
Average Value
Number
Average Value
Number
Average Value
Number
Average Value
Number
Average Value
LOANS ORIGINATED
6
$79,877
29
$81,797
124
$89,883
20
$18,828
6
$46,975
APPLICATIONS APPROVED, NOT ACCEPTED
0
$0
3
$94,937
12
$131,380
1
$13,870
1
$37,200
APPLICATIONS DENIED
1
$76,590
7
$50,550
38
$84,246
5
$23,962
1
$32,090
APPLICATIONS WITHDRAWN
1
$80,800
3
$90,663
26
$84,025
0
$0
0
$0
FILES CLOSED FOR INCOMPLETENESS
0
$0
0
$0
9
$90,871
0
$0
0
$0
Aggregated Statistics For Year 1999 (Based on 1 partial tract)
2002 - 2018 National Fire Incident Reporting System (NFIRS) incidents
Based on the data from the years 2002 - 2018 the average number of fire incidents per year is 6. The highest number of fires - 19 took place in 2013, and the least - 0 in 2003. The data has an increasing trend.
When looking into fire subcategories, the most incidents belonged to: Structure Fires (40.0%), and Outside Fires (32.7%).
Fire incident types reported to NFIRS in Zip Code 51560


+$4,426
-$74
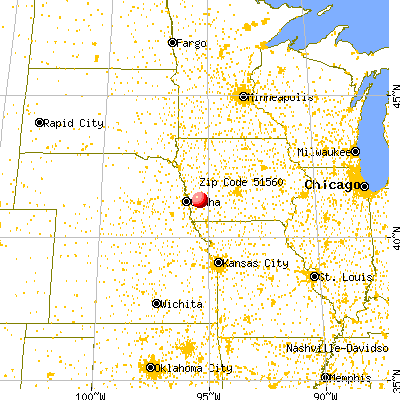
 Nearest zip codes: 51536, 51525, 51549, 51541, 51521, 51553.
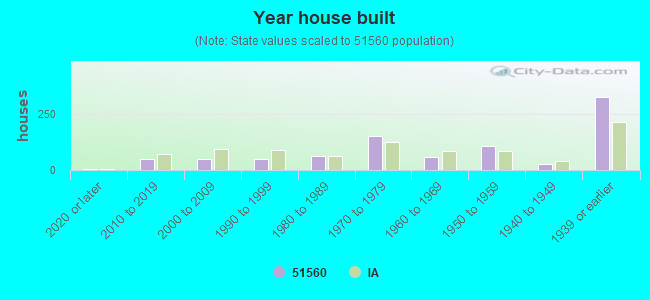


 Based on the data from the years 2002 - 2018 the average number of fire incidents per year is 6. The highest number of fires - 19 took place in 2013, and the least - 0 in 2003. The data has an increasing trend.
 When looking into fire subcategories, the most incidents belonged to: Structure Fires (40.0%), and Outside Fires (32.7%).