Estimated zip code population in 2022: 946 Zip code population in 2010: 1,223 Zip code population in 2000: 1,246
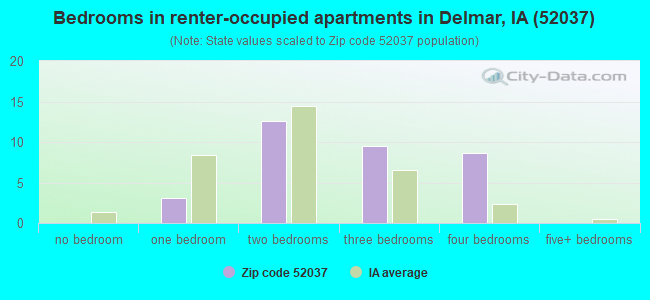
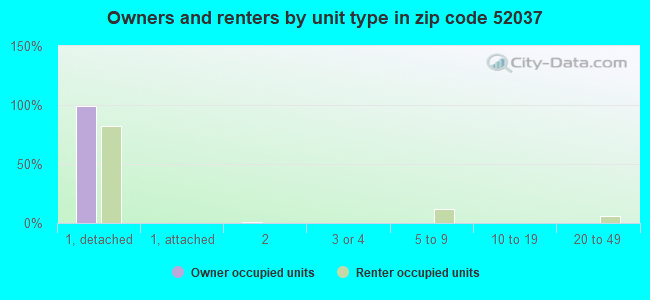
Houses and condos: 425 Renter-occupied apartments: 33
% of renters here:
9%
State:
28%
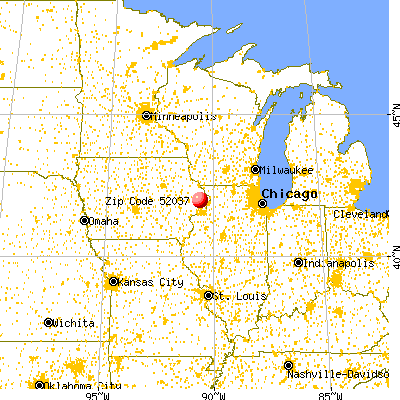
March 2022 cost of living index in zip code 52037: 82.0 (low, U.S. average is 100)
Land area: 68.2 sq. mi. Water area: 0.0 sq. mi.
Population density: 14 people per square mile
(very low).
OSM Map
General Map
Google Map
MSN Map
OSM Map
General Map
Google Map
MSN Map
OSM Map
General Map
Google Map
MSN Map
OSM Map
General Map
Google Map
MSN Map
Please wait while loading the map...
Real estate property taxes paid for housing units in 2022:
This zip code:
1.1% ($1,967)
Iowa:
1.4% ($2,724)
Median real estate property taxes paid for housing units with mortgages in 2022: $1,798 (1.0%) Median real estate property taxes paid for housing units with no mortgage in 2022: $2,364 (1.2%)
Business Search- 14 Million verified businesses
Males: 464
(49.1%)
Females: 481
(50.9%)
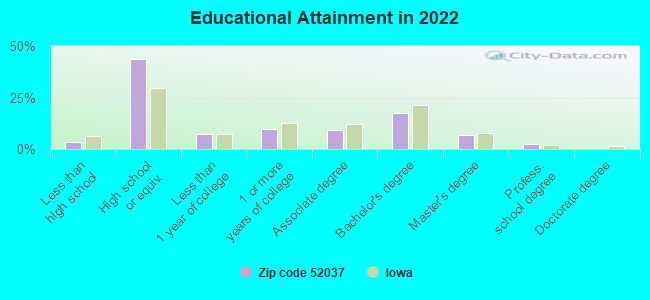
For population 25 years and over in 52037:
High school or higher: 96.1%
Bachelor's degree or higher: 27.1%
Graduate or professional degree: 9.6%
Unemployed: 1.7%
Mean travel time to work (commute): 25.4 minutes
For population 15 years and over in 52037:
Never married: 25.4%
Now married: 61.3%
Separated: 0.1%
Widowed: 7.1%
Divorced: 6.0%
Zip code 52037 compared to state average:
Unemployed percentage below state average.
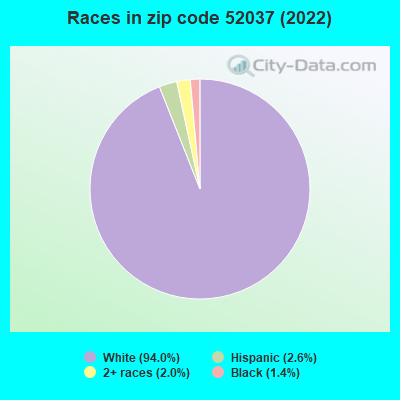
Black race population percentage below state average.
Hispanic race population percentage below state average.
Median age above state average.
Foreign-born population percentage significantly below state average.
Renting percentage significantly below state average.
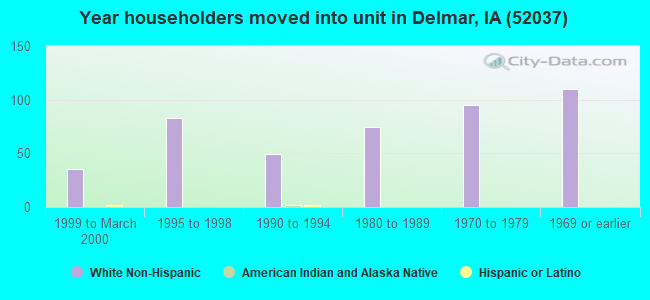
Length of stay since moving in significantly above state average.
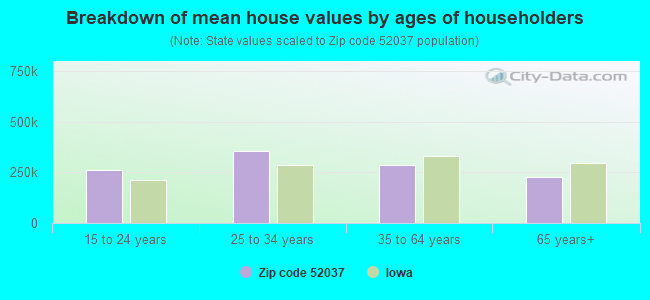
Estimated median house/condo value in 2022: $181,741
52037:
$181,741
Iowa:
$194,600
According to our research of Iowa and other state lists, there was 1 registered sex offender living in 52037 zip code as of April 27, 2024. The ratio of all residents to sex offenders in zip code 52037 is 1,134 to 1. The ratio of registered sex offenders to all residents in this zip code is lower than the state average.
Median resident age:
This zip code:
43.3 years
Iowa median age:
38.9 years
Average household size:
This zip code:
2.5 people
Iowa:
2.3 people
Averages for the 2020 tax year for zip code 52037, filed in 2021:
Average Adjusted Gross Income (AGI) in 2020: $68,687 (Individual Income Tax Returns)
Here:
$68,687
State:
$71,087
Salary/wage: $52,798 (reported on 84.6% of returns)
Here:
$52,798
State:
$57,361
(% of AGI for various income ranges: 1524.4% for AGIs below $25k, 3823.7% for AGIs $25k-50k, 5898.6% for AGIs $50k-75k, 8902.0% for AGIs $75k-100k, 17033.3% for AGIs $100k-200k)
Taxable interest for individuals: $1,008 (reported on 46.2% of returns)
This zip code:
$1,008
Iowa:
$1,633
(% of AGI for various income ranges: 14.4% for AGIs below $25k, 95.0% for AGIs $25k-50k, 48.6% for AGIs $50k-75k, 86.0% for AGIs $75k-100k, 126.7% for AGIs $100k-200k)
Ordinary dividends: $2,855 (reported on 21.2% of returns)
Here:
$2,855
State:
$5,432
(% of AGI for various income ranges: 110.0% for AGIs $25k-50k, 104.0% for AGIs $75k-100k, 290.0% for AGIs $100k-200k)
Net capital gain/loss in AGI: +$6,590 (reported on 19.2% of returns)
Here:
+$6,590
State:
+$15,243
(% of AGI for various income ranges: 131.4% for AGIs $50k-75k, 955.0% for AGIs $100k-200k)
Profit/loss from business: +$11,100 (reported on 17.3% of returns)
Here:
+$11,100
State:
+$11,763
(% of AGI for various income ranges: 88.9% for AGIs below $25k, 405.0% for AGIs $25k-50k, 1190.0% for AGIs $75k-100k)
Taxable individual retirement arrangement distribution: $11,957 (reported on 13.5% of returns)
52037:
$11,957
Iowa:
$17,324
(% of AGI for various income ranges: 400.0% for AGIs $25k-50k, 1034.0% for AGIs $75k-100k)
Earned income credit: $2,220 (reported on 9.6% of returns)
Here:
$2,220
State:
$2,195
(% of AGI for various income ranges: 55.6% for AGIs below $25k, 76.2% for AGIs $25k-50k)
Percentage of individuals using paid preparers for their 2020 taxes: 96.2%
Here:
96%
State:
95%
(% for various income ranges: 92.3% for AGIs below $25k, 100.0% for AGIs $25k-50k, 90.0% for AGIs $50k-75k, 100.0% for AGIs $75k-100k, 100.0% for AGIs $100k-200k)
Averages for the 2012 tax year for zip code 52037, filed in 2013:
Average Adjusted Gross Income (AGI) in 2012: $59,045 (Individual Income Tax Returns)
Here:
$59,045
State:
$58,860
Salary/wage: $42,957 (reported on 85.5% of returns)
Here:
$42,957
State:
$46,659
(% of AGI for various income ranges: 67.6% for AGIs below $25k, 79.6% for AGIs $25k-50k, 76.9% for AGIs $50k-75k, 70.1% for AGIs $75k-100k, 43.9% for AGIs $100k-200k)
Taxable interest for individuals: $876 (reported on 45.5% of returns)
This zip code:
$876
Iowa:
$1,537
(% of AGI for various income ranges: 0.9% for AGIs below $25k, 1.1% for AGIs $25k-50k, 0.4% for AGIs $50k-75k, 0.8% for AGIs $75k-100k, 0.6% for AGIs $100k-200k)
Ordinary dividends: $1,775 (reported on 21.8% of returns)
Here:
$1,775
State:
$4,542
(% of AGI for various income ranges: 0.9% for AGIs below $25k, 0.8% for AGIs $25k-50k, 1.2% for AGIs $50k-75k, 0.6% for AGIs $100k-200k)
Net capital gain/loss in AGI: +$4,030 (reported on 18.2% of returns)
Here:
+$4,030
State:
+$11,802
(% of AGI for various income ranges: 0.8% for AGIs below $25k, 1.0% for AGIs $50k-75k, 2.4% for AGIs $100k-200k)
Profit/loss from business: +$3,300 (reported on 18.2% of returns)
Here:
+$3,300
State:
+$10,509
(% of AGI for various income ranges: 1.1% for AGIs below $25k, 3.3% for AGIs $50k-75k, 1.8% for AGIs $75k-100k)
Taxable individual retirement arrangement distribution: $5,050 (reported on 10.9% of returns)
52037:
$5,050
Iowa:
$11,773
Total itemized deductions: $17,250 (18% of AGI, reported on 25.5% of returns)
Here:
$17,250
State:
$21,278
Here:
18.0% of AGI
State:
18.9% of AGI
(% of AGI for various income ranges: 13.8% for AGIs below $25k, 9.3% for AGIs $50k-75k, 7.2% for AGIs $75k-100k, 7.9% for AGIs $100k-200k)
Charity contributions: $2,055 (reported on 20.0% of returns)
Here:
$2,055
State:
$4,044
Taxes paid: $6,929 (reported on 25.5% of returns)
52037:
$6,929
State:
$8,846
(% of AGI for various income ranges: 3.2% for AGIs below $25k, 2.6% for AGIs $50k-75k, 2.2% for AGIs $75k-100k, 4.5% for AGIs $100k-200k)
Earned income credit: $1,929 (reported on 12.7% of returns)
Here:
$1,929
State:
$2,098
(% of AGI for various income ranges: 3.5% for AGIs below $25k, 1.0% for AGIs $25k-50k)
Percentage of individuals using paid preparers for their 2012 taxes: 83.6%
Here:
84%
State:
65%
(% for various income ranges: 73.7% for AGIs below $25k, 83.3% for AGIs $25k-50k, 90.0% for AGIs $50k-75k, 85.7% for AGIs $75k-100k, 100.0% for AGIs $100k-200k)
Averages for the 2004 tax year for zip code 52037, filed in 2005:
Average Adjusted Gross Income (AGI) in 2004: $35,302 (Individual Income Tax Returns)
Here:
$35,302
State:
$43,875
Salary/wage: $33,131 (reported on 83.3% of returns)
Here:
$33,131
State:
$38,265
(% of AGI for various income ranges: 94.0% for AGIs below $10k, 78.1% for AGIs $10k-25k, 79.5% for AGIs $25k-50k, 80.1% for AGIs $50k-75k, 80.1% for AGIs $75k-100k, 65.9% for AGIs over 100k)
Taxable interest for individuals: $1,146 (reported on 52.3% of returns)
This zip code:
$1,146
Iowa:
$1,768
(% of AGI for various income ranges: 6.9% for AGIs below $10k, 3.1% for AGIs $10k-25k, 2.1% for AGIs $25k-50k, 1.1% for AGIs $50k-75k, 1.3% for AGIs $75k-100k, 0.6% for AGIs over 100k)
Taxable dividends: $707 (reported on 25.5% of returns)
Here:
$707
State:
$2,510
(% of AGI for various income ranges: 6.7% for AGIs below $10k, 0.9% for AGIs $10k-25k, 0.3% for AGIs $25k-50k, 0.3% for AGIs $50k-75k, 0.3% for AGIs $75k-100k, 0.3% for AGIs over 100k)
Net capital gain/loss: +$105 (reported on 21.5% of returns)
Here:
+$105
State:
+$6,139
(% of AGI for various income ranges: -2.9% for AGIs below $10k, -0.2% for AGIs $10k-25k, -0.1% for AGIs $25k-50k, 0.2% for AGIs $50k-75k, 0.7% for AGIs $75k-100k)
Profit/loss from business: +$4,519 (reported on 18.4% of returns)
Here:
+$4,519
State:
+$8,574
(% of AGI for various income ranges: 0.4% for AGIs below $10k, 2.7% for AGIs $10k-25k, 4.4% for AGIs $25k-50k, 2.2% for AGIs $50k-75k, 1.4% for AGIs $75k-100k)
Profit/loss from farming: +$765 (reported on 20.0% of returns)
Here:
+$765
State:
-$74
(% of AGI for various income ranges: -14.0% for AGIs below $10k, -0.3% for AGIs $10k-25k, -4.0% for AGIs $25k-50k, 1.0% for AGIs $50k-75k, 8.7% for AGIs $75k-100k)
IRA payment deduction: $2,882 (reported on 3.0% of returns)
52037:
$2,882
Iowa:
$2,970
Total itemized deductions: $13,729 (22% of AGI, reported on 20.5% of returns)
Here:
$13,729
State:
$16,976
Here:
22.0% of AGI
State:
20.8% of AGI
(% of AGI for various income ranges: 9.7% for AGIs $10k-25k, 7.2% for AGIs $25k-50k, 7.4% for AGIs $50k-75k, 9.4% for AGIs $75k-100k, 8.8% for AGIs over 100k)
Charity contributions deductions: $1,407 (2% of AGI, reported on 15.8% of returns)
Here:
$1,407
State:
$3,089
Here:
2.0% of AGI
State:
3.6% of AGI
(% of AGI for various income ranges: 0.5% for AGIs $25k-50k, 0.4% for AGIs $50k-75k, 0.6% for AGIs $75k-100k, 2.2% for AGIs over 100k)
Total tax: $4,048 (reported on 76.6% of returns)
52037:
$4,048
State:
$6,177
(% of AGI for various income ranges: 4.0% for AGIs below $10k, 4.3% for AGIs $10k-25k, 6.6% for AGIs $25k-50k, 8.3% for AGIs $50k-75k, 11.5% for AGIs $75k-100k, 15.8% for AGIs over 100k)
Earned income credit: $1,486 (reported on 12.2% of returns)
Here:
$1,486
State:
$1,540
Percentage of individuals using paid preparers for their 2004 taxes: 83.0%
Here:
83%
State:
70%
(% for various income ranges: 77.7% for AGIs below $10k, 83.1% for AGIs $10k-25k, 83.1% for AGIs $25k-50k, 87.1% for AGIs $50k-75k, 85.4% for AGIs $75k-100k, 90.0% for AGIs over 100k)
Household received Food Stamps/SNAP in the past 12 months: 19 Household did not receive Food Stamps/SNAP in the past 12 months: 365
Women who had a birth in the past 12 months: 8 (2 now married, 5 unmarried) Women who did not have a birth in the past 12 months: 174 (81 now married, 92 unmarried)
Housing units in zip code 52037 with a mortgage: 184 (16 second mortgage, 14 both second mortgage and home equity loan) Median monthly owner costs for units with a mortgage: $1,180 Median monthly owner costs for units without a mortgage: $579
Residents with income below the poverty level in 2022:
This zip code:
4.6%
Whole state:
11.0%
Residents with income below 50% of the poverty level in 2022:
This zip code:
3.5%
Whole state:
5.5%
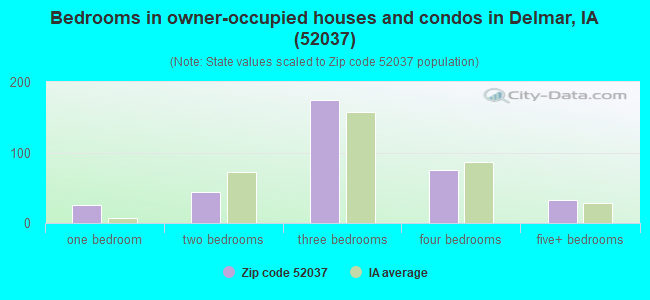
Median number of rooms in houses and condos:
Here:
7.2
State:
6.8
Median number of rooms in apartments:
Here:
6.6
State:
4.2
Notable locations in this zip code not listed on our city pages
Cemeteries: Oak View Cemetery (1), Bloomfield Cemetery (2), Pine Hill Cemetery (3), Saint Columbkille Cemetery (4), Saint Patricks Cemetery (5), Evergreen Cemetery (6). Display/hide their locations on the map
Size of family households: 180 2-persons, 43 3-persons, 17 4-persons, 24 5-persons, 12 7-or-more-persons
Size of nonfamily households: 102 1-person, 5 2-persons
142 married couples with children.
40 single-parent households (22 men, 18 women).
99.8% of residents of 52037 zip code speak English at home.
0.3% of residents speak other Indo-European language at home (100% not well).
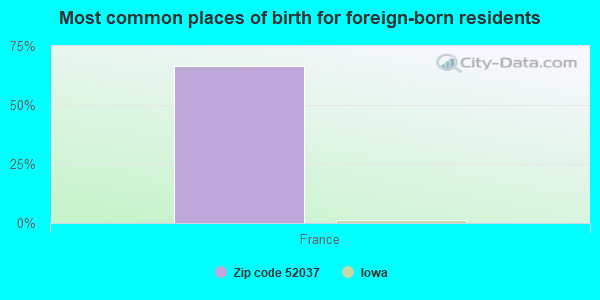
Foreign born population: 3 (0.3%) (100.0% of them are naturalized citizens)
This zip code:
0.3%
Whole state:
6.0%
67%France
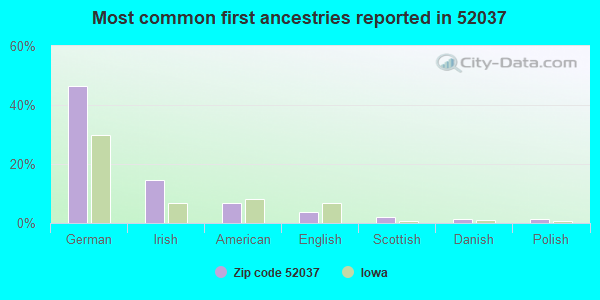
47%German
15%Irish
7%American
4%English
2%Scottish
1%Danish
1%Polish
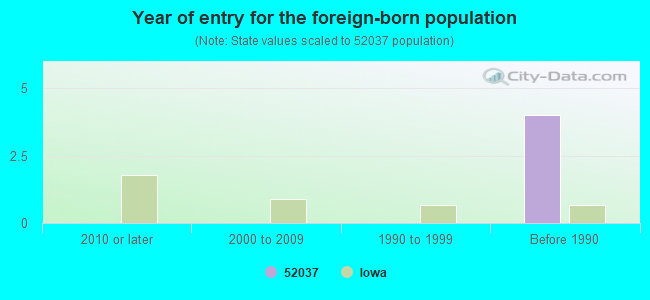
Year of entry for the foreign-born population
02010 or later
02000 to 2009
01990 to 1999
4Before 1990
Facilities with environmental interests located in this zip code:
DELWOOD ELEMENTARY SCHOOL (311 DELMAR AVENUE in DELMAR, IA)
(Geographic Names Information System) COMPLIANCE ACTIVITY (Tracking inspections of insecticide, fungicide, and rodenticide, and toxic substances) (National Center for Education Statistics) - STATE ID-231675 409 Organizations: DELWOOD COMM SCHOOL DISTRICT (SCHOOL DISTRICT)
Alternative names: DELWOOD C S D
NORTHERN NATURAL GAS - DELMAR TBS (2450 HIGHWAY 136 in DELMAR, IA)
Conditionally Exempt Small Quantity Generators, less than 100 kg/month of hazardous waste (Resource Conservation and Recovery Act (tracking hazardous waste)) - ICIS-, ENFORCEMENT/COMPLIANCE ACTIVITY
DELMAR, CITY OF STP (EAST OF THE SOUTH END OF DELMA in DELMAR, IA)
National Pollutant Discharge Elimination System NON-MAJOR (Tracking pollutant discharge elimination systems) - permit Business SIC classification: SEWERAGE SYSTEMS
Housing units lacking complete plumbing facilities: 4.6% Housing units lacking complete kitchen facilities: 2.7%
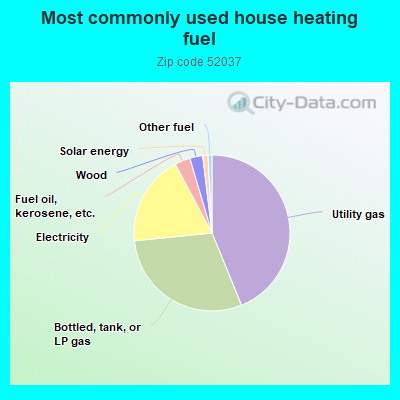
44.0%Utility gas
29.7%Bottled, tank, or LP gas
18.9%Electricity
3.2%Fuel oil, kerosene, etc.
2.7%Wood
1.1%Solar energy
0.8%Other fuel
Population in 1990: 927. Population change in the 1990s: +319 (+34.4%).
Place of birth for U.S.-born residents:
This state: 816
Northeast: 7
Midwest: 77
South: 9
West: 30
73% of the 52037 zip code residents lived in the same house 5 years ago. Out of people who lived in different houses, 46% lived in this county. Out of people who lived in different counties, 50% lived in Iowa.
97% of the 52037 zip code residents lived in the same house 1 year ago. Out of people who lived in different houses, 45% moved from this county. Out of people who lived in different houses, 27% moved from different county within same state. Out of people who lived in different houses, 5% moved from different state. Out of people who lived in different houses, 27% moved from abroad.
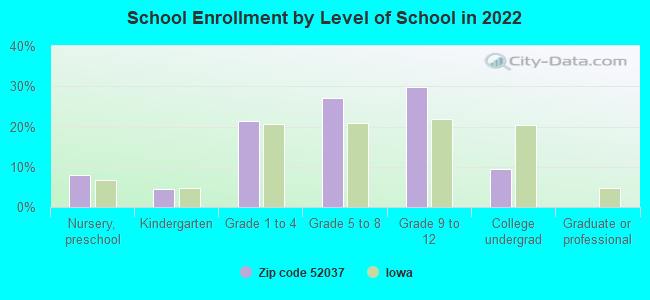
Private vs. public school enrollment:
Students in private schools in grades 1 to 8 (elementary and middle school):
Here:
0.0%
Iowa:
10.6%
Students in private schools in grades 9 to 12 (high school): 10
Here:
20.5%
Iowa:
7.9%
Students in private undergraduate colleges: 11
Here:
62.2%
Iowa:
23.9%
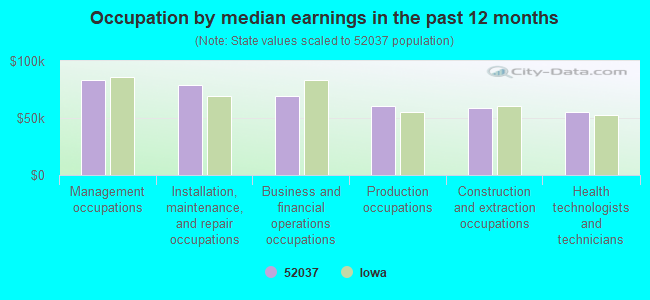
Occupation by median earnings in the past 12 months ($)
83,383Management occupations
78,639Installation, maintenance, and repair occupations
69,230Business and financial operations occupations
60,190Production occupations
59,198Construction and extraction occupations
55,158Health technologists and technicians
Top industries in this zip code by the number of employees in 2005:
Wholesale Trade: Grain and Field Bean Merchant Wholesalers (5-9 employees: 1 establishment)
Finance and Insurance: Insurance Agencies and Brokerages (5-9: 1)
Other Services (except Public Administration): Religious Organizations (1-4: 2)
Administrative and Support and Waste Management and Remediation Services: Office Administrative Services (1-4: 1)
Administrative and Support and Waste Management and Remediation Services: Landscaping Services (1-4: 1)
Finance and Insurance: Direct Property and Casualty Insurance Carriers (1-4: 1)
Accommodation and Food Services: Full-Service Restaurants (1-4: 1)
2002 - 2018 National Fire Incident Reporting System (NFIRS) incidents
According to the data from the years 2002 - 2018 the average number of fire incidents per year is 8. The highest number of fire incidents - 26 took place in 2005, and the least - 0 in 2009. The data has a growing trend.
When looking into fire subcategories, the most incidents belonged to: Outside Fires (48.9%), and Structure Fires (38.2%).
Fire incident types reported to NFIRS in Zip Code 52037


+$765
-$74
(% of AGI for various income ranges: -14.0% for AGIs below $10k, -0.3% for AGIs $10k-25k, -4.0% for AGIs $25k-50k, 1.0% for AGIs $50k-75k, 8.7% for AGIs $75k-100k) Nearest zip codes: 52774, 52751, 52731, 52060, 52254, 52742.


 According to the data from the years 2002 - 2018 the average number of fire incidents per year is 8. The highest number of fire incidents - 26 took place in 2005, and the least - 0 in 2009. The data has a growing trend.
 When looking into fire subcategories, the most incidents belonged to: Outside Fires (48.9%), and Structure Fires (38.2%).