Estimated zip code population in 2022: 7,558 Zip code population in 2010: 7,681 Zip code population in 2000: 7,400
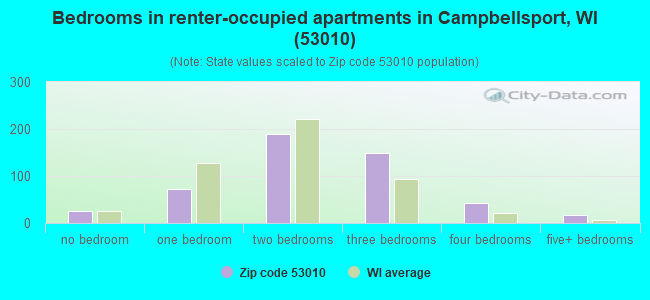
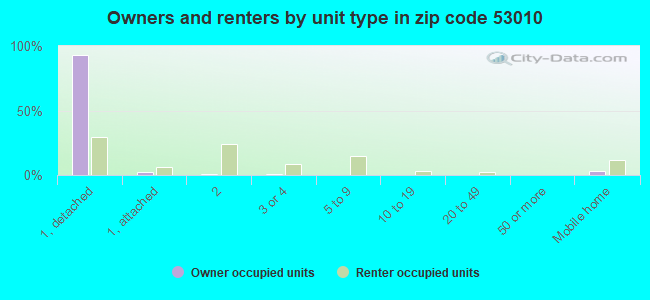
Houses and condos: 3,420 Renter-occupied apartments: 499
% of renters here:
16%
State:
32%
March 2022 cost of living index in zip code 53010: 87.3 (less than average, U.S. average is 100)
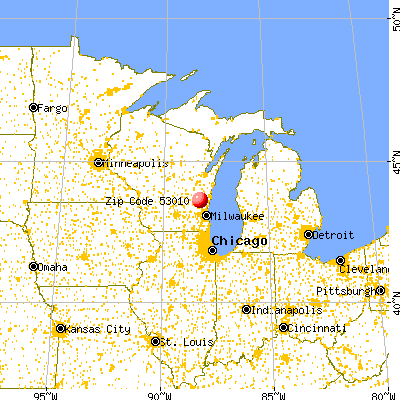
Land area: 102.9 sq. mi. Water area: 2.5 sq. mi.
Population density: 73 people per square mile
(very low).
OSM Map
General Map
Google Map
MSN Map
OSM Map
General Map
Google Map
MSN Map
OSM Map
General Map
Google Map
MSN Map
OSM Map
General Map
Google Map
MSN Map
Please wait while loading the map...
Real estate property taxes paid for housing units in 2022:
This zip code:
1.3% ($3,798)
Wisconsin:
1.4% ($3,497)
Median real estate property taxes paid for housing units with mortgages in 2022: $3,746 (1.3%) Median real estate property taxes paid for housing units with no mortgage in 2022: $3,899 (1.3%)
Business Search- 14 Million verified businesses
Males: 3,787
(50.1%)
Females: 3,770
(49.9%)
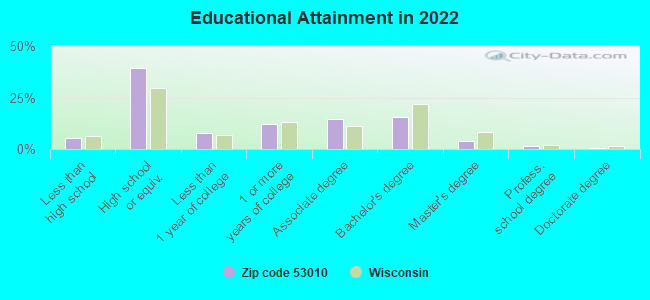
For population 25 years and over in 53010:
High school or higher: 93.7%
Bachelor's degree or higher: 20.8%
Graduate or professional degree: 5.6%
Unemployed: 1.2%
Mean travel time to work (commute): 28.0 minutes
For population 15 years and over in 53010:
Never married: 23.7%
Now married: 63.1%
Separated: 0.4%
Widowed: 4.1%
Divorced: 8.7%
Zip code 53010 compared to state average:
Unemployed percentage below state average.
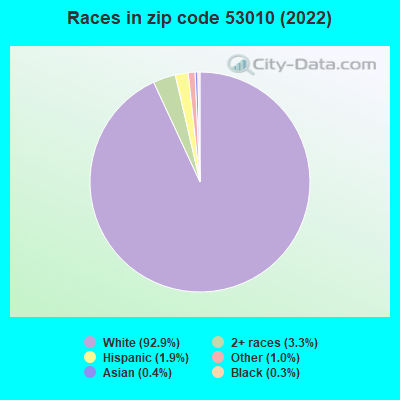
Black race population percentage significantly below state average.
Hispanic race population percentage significantly below state average.
Median age significantly above state average.
Foreign-born population percentage significantly below state average.
Renting percentage below state average.
Length of stay since moving in significantly above state average.
Percentage of population with a bachelor's degree or higher below state average.
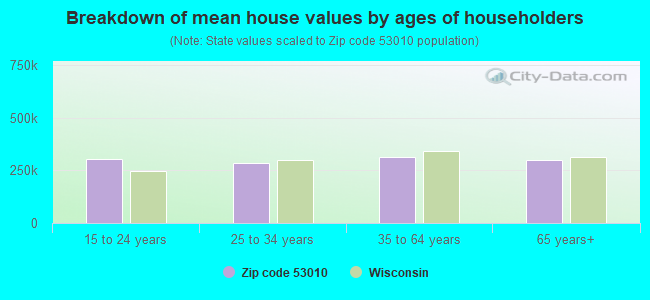
Estimated median house/condo value in 2022: $292,348
53010:
$292,348
Wisconsin:
$252,800
According to our research of Wisconsin and other state lists, there were 14 registered sex offenders living in 53010 zip code as of April 27, 2024. The ratio of all residents to sex offenders in zip code 53010 is 544 to 1. The ratio of registered sex offenders to all residents in this zip code is lower than the state average.
Median resident age:
This zip code:
48.6 years
Wisconsin median age:
40.4 years
Average household size:
This zip code:
2.4 people
Wisconsin:
2.3 people
Averages for the 2020 tax year for zip code 53010, filed in 2021:
Average Adjusted Gross Income (AGI) in 2020: $68,852 (Individual Income Tax Returns)
Here:
$68,852
State:
$72,319
Salary/wage: $60,914 (reported on 82.0% of returns)
Here:
$60,914
State:
$59,242
(% of AGI for various income ranges: 1369.5% for AGIs below $25k, 3727.2% for AGIs $25k-50k, 6561.3% for AGIs $50k-75k, 9663.6% for AGIs $75k-100k, 18693.4% for AGIs $100k-200k, 62550.0% for AGIs over 200k)
Taxable interest for individuals: $927 (reported on 41.5% of returns)
This zip code:
$927
Wisconsin:
$1,431
(% of AGI for various income ranges: 32.8% for AGIs below $25k, 41.0% for AGIs $25k-50k, 59.3% for AGIs $50k-75k, 67.9% for AGIs $75k-100k, 94.4% for AGIs $100k-200k, 425.0% for AGIs over 200k)
Ordinary dividends: $3,890 (reported on 22.9% of returns)
Here:
$3,890
State:
$6,481
(% of AGI for various income ranges: 58.7% for AGIs below $25k, 65.3% for AGIs $25k-50k, 61.5% for AGIs $50k-75k, 109.1% for AGIs $75k-100k, 273.7% for AGIs $100k-200k, 2400.0% for AGIs over 200k)
Net capital gain/loss in AGI: +$13,914 (reported on 19.8% of returns)
Here:
+$13,914
State:
+$18,329
(% of AGI for various income ranges: 40.8% for AGIs below $25k, 56.6% for AGIs $25k-50k, 100.4% for AGIs $50k-75k, 253.6% for AGIs $75k-100k, 509.0% for AGIs $100k-200k, 16877.5% for AGIs over 200k)
Profit/loss from business: +$13,122 (reported on 12.6% of returns)
Here:
+$13,122
State:
+$14,562
(% of AGI for various income ranges: 51.1% for AGIs below $25k, 155.2% for AGIs $25k-50k, 260.4% for AGIs $50k-75k, 340.3% for AGIs $75k-100k, 562.4% for AGIs $100k-200k, 1477.5% for AGIs over 200k)
Taxable individual retirement arrangement distribution: $15,746 (reported on 14.7% of returns)
53010:
$15,746
Wisconsin:
$19,348
(% of AGI for various income ranges: 171.3% for AGIs below $25k, 263.8% for AGIs $25k-50k, 277.2% for AGIs $50k-75k, 461.8% for AGIs $75k-100k, 878.3% for AGIs $100k-200k)
Total itemized deductions: $26,174 (reported on 7.0% of returns)
Here:
$26,174
State:
$33,000
(% of AGI for various income ranges: 86.6% for AGIs below $25k, 151.4% for AGIs $25k-50k, 278.7% for AGIs $50k-75k, 344.2% for AGIs $75k-100k, 525.4% for AGIs $100k-200k, 2722.5% for AGIs over 200k)
Charity contributions: $6,184 (reported on 4.9% of returns)
Here:
$6,184
State:
$12,044
(% of AGI for various income ranges: 22.2% for AGIs $25k-50k, 29.6% for AGIs $50k-75k, 36.7% for AGIs $75k-100k, 119.0% for AGIs $100k-200k, 752.5% for AGIs over 200k)
Taxes paid: $8,026 (reported on 7.0% of returns)
53010:
$8,026
State:
$8,228
(% of AGI for various income ranges: 16.6% for AGIs below $25k, 26.4% for AGIs $25k-50k, 79.6% for AGIs $50k-75k, 147.9% for AGIs $75k-100k, 177.1% for AGIs $100k-200k, 832.5% for AGIs over 200k)
Earned income credit: $1,743 (reported on 7.2% of returns)
Here:
$1,743
State:
$2,155
(% of AGI for various income ranges: 53.3% for AGIs below $25k, 28.1% for AGIs $25k-50k)
Percentage of individuals using paid preparers for their 2020 taxes: 94.8%
Here:
95%
State:
94%
(% for various income ranges: 92.5% for AGIs below $25k, 93.9% for AGIs $25k-50k, 95.4% for AGIs $50k-75k, 96.0% for AGIs $75k-100k, 97.2% for AGIs $100k-200k, 100.0% for AGIs over 200k)
Averages for the 2012 tax year for zip code 53010, filed in 2013:
Average Adjusted Gross Income (AGI) in 2012: $55,114 (Individual Income Tax Returns)
Here:
$55,114
State:
$57,939
Salary/wage: $47,802 (reported on 84.9% of returns)
Here:
$47,802
State:
$48,248
(% of AGI for various income ranges: 67.4% for AGIs below $25k, 76.8% for AGIs $25k-50k, 80.2% for AGIs $50k-75k, 84.3% for AGIs $75k-100k, 79.8% for AGIs $100k-200k, 33.9% for AGIs over 200k)
Taxable interest for individuals: $1,214 (reported on 41.9% of returns)
This zip code:
$1,214
Wisconsin:
$1,224
(% of AGI for various income ranges: 2.6% for AGIs below $25k, 1.0% for AGIs $25k-50k, 0.7% for AGIs $50k-75k, 0.5% for AGIs $75k-100k, 0.5% for AGIs $100k-200k, 1.6% for AGIs over 200k)
Ordinary dividends: $3,435 (reported on 21.1% of returns)
Here:
$3,435
State:
$5,137
(% of AGI for various income ranges: 1.5% for AGIs below $25k, 1.0% for AGIs $25k-50k, 0.8% for AGIs $50k-75k, 0.7% for AGIs $75k-100k, 1.3% for AGIs $100k-200k, 3.4% for AGIs over 200k)
Net capital gain/loss in AGI: +$8,536 (reported on 16.5% of returns)
Here:
+$8,536
State:
+$11,137
(% of AGI for various income ranges: 0.6% for AGIs below $25k, 1.4% for AGIs $25k-50k, 0.9% for AGIs $50k-75k, 1.5% for AGIs $75k-100k, 2.1% for AGIs $100k-200k, 10.2% for AGIs over 200k)
Profit/loss from business: +$8,738 (reported on 12.7% of returns)
Here:
+$8,738
State:
+$11,943
(% of AGI for various income ranges: 3.1% for AGIs below $25k, 3.3% for AGIs $25k-50k, 1.3% for AGIs $50k-75k, 1.1% for AGIs $75k-100k, 3.2% for AGIs $100k-200k)
Taxable individual retirement arrangement distribution: $11,051 (reported on 14.3% of returns)
53010:
$11,051
Wisconsin:
$14,087
(% of AGI for various income ranges: 7.0% for AGIs below $25k, 3.8% for AGIs $25k-50k, 2.8% for AGIs $50k-75k, 2.0% for AGIs $75k-100k, 3.3% for AGIs $100k-200k)
Total itemized deductions: $19,926 (22% of AGI, reported on 40.8% of returns)
Here:
$19,926
State:
$22,257
Here:
22.4% of AGI
State:
20.1% of AGI
(% of AGI for various income ranges: 14.6% for AGIs below $25k, 11.7% for AGIs $25k-50k, 14.0% for AGIs $50k-75k, 17.1% for AGIs $75k-100k, 17.1% for AGIs $100k-200k, 11.7% for AGIs over 200k)
Charity contributions: $2,147 (reported on 31.9% of returns)
Here:
$2,147
State:
$3,370
(% of AGI for various income ranges: 1.1% for AGIs below $25k, 1.0% for AGIs $25k-50k, 1.2% for AGIs $50k-75k, 1.4% for AGIs $75k-100k, 1.5% for AGIs $100k-200k, 1.2% for AGIs over 200k)
Taxes paid: $8,877 (reported on 40.8% of returns)
53010:
$8,877
State:
$10,731
(% of AGI for various income ranges: 3.1% for AGIs below $25k, 4.0% for AGIs $25k-50k, 5.6% for AGIs $50k-75k, 7.6% for AGIs $75k-100k, 8.6% for AGIs $100k-200k, 7.6% for AGIs over 200k)
Earned income credit: $1,876 (reported on 10.3% of returns)
Here:
$1,876
State:
$2,094
(% of AGI for various income ranges: 3.5% for AGIs below $25k, 0.7% for AGIs $25k-50k)
Percentage of individuals using paid preparers for their 2012 taxes: 67.3%
Here:
67%
State:
54%
(% for various income ranges: 60.5% for AGIs below $25k, 67.4% for AGIs $25k-50k, 70.1% for AGIs $50k-75k, 75.0% for AGIs $75k-100k, 70.0% for AGIs $100k-200k, 100.0% for AGIs over 200k)
Averages for the 2004 tax year for zip code 53010, filed in 2005:
Average Adjusted Gross Income (AGI) in 2004: $43,809 (Individual Income Tax Returns)
Here:
$43,809
State:
$47,735
Salary/wage: $39,964 (reported on 87.3% of returns)
Here:
$39,964
State:
$41,540
(% of AGI for various income ranges: 157.3% for AGIs below $10k, 69.7% for AGIs $10k-25k, 83.2% for AGIs $25k-50k, 84.7% for AGIs $50k-75k, 87.7% for AGIs $75k-100k, 60.1% for AGIs over 100k)
Taxable interest for individuals: $1,326 (reported on 56.2% of returns)
This zip code:
$1,326
Wisconsin:
$1,420
(% of AGI for various income ranges: 9.5% for AGIs below $10k, 4.2% for AGIs $10k-25k, 1.0% for AGIs $25k-50k, 1.6% for AGIs $50k-75k, 1.0% for AGIs $75k-100k, 1.9% for AGIs over 100k)
Taxable dividends: $1,430 (reported on 25.1% of returns)
Here:
$1,430
State:
$2,869
(% of AGI for various income ranges: 5.2% for AGIs below $10k, 1.7% for AGIs $10k-25k, 0.8% for AGIs $25k-50k, 0.5% for AGIs $50k-75k, 0.3% for AGIs $75k-100k, 1.2% for AGIs over 100k)
Net capital gain/loss: +$7,054 (reported on 20.3% of returns)
Here:
+$7,054
State:
+$9,569
(% of AGI for various income ranges: 3.9% for AGIs below $10k, 1.9% for AGIs $10k-25k, 0.9% for AGIs $25k-50k, 2.0% for AGIs $50k-75k, 1.2% for AGIs $75k-100k, 10.0% for AGIs over 100k)
Profit/loss from business: +$8,198 (reported on 12.4% of returns)
Here:
+$8,198
State:
+$10,417
(% of AGI for various income ranges: 10.3% for AGIs below $10k, 2.6% for AGIs $10k-25k, 2.5% for AGIs $25k-50k, 1.4% for AGIs $50k-75k, 1.4% for AGIs $75k-100k, 3.8% for AGIs over 100k)
Profit/loss from farming: +$6,760 (reported on 3.9% of returns)
Here:
+$6,760
State:
-$2,654
(% of AGI for various income ranges: 2.8% for AGIs below $10k, 0.5% for AGIs $10k-25k, 0.7% for AGIs $25k-50k, 0.3% for AGIs $50k-75k, 1.3% for AGIs $75k-100k)
IRA payment deduction: $3,013 (reported on 4.0% of returns)
53010:
$3,013
Wisconsin:
$2,900
(% of AGI for various income ranges: 0.3% for AGIs $10k-25k, 0.5% for AGIs $25k-50k, 0.3% for AGIs $50k-75k, 0.2% for AGIs $75k-100k, 0.2% for AGIs over 100k)
Self-employed pension: $7,485 (reported on 0.9% of returns)
Here:
$7,485
Wisconsin:
$11,934
Total itemized deductions: $16,345 (23% of AGI, reported on 40.6% of returns)
Here:
$16,345
State:
$18,160
Here:
23.1% of AGI
State:
21.1% of AGI
(% of AGI for various income ranges: 28.4% for AGIs below $10k, 13.2% for AGIs $10k-25k, 11.3% for AGIs $25k-50k, 16.1% for AGIs $50k-75k, 17.6% for AGIs $75k-100k, 15.2% for AGIs over 100k)
Charity contributions deductions: $1,927 (3% of AGI, reported on 34.3% of returns)
Here:
$1,927
State:
$2,711
Here:
2.6% of AGI
State:
3.0% of AGI
(% of AGI for various income ranges: 1.5% for AGIs below $10k, 1.1% for AGIs $10k-25k, 0.9% for AGIs $25k-50k, 1.3% for AGIs $50k-75k, 1.7% for AGIs $75k-100k, 2.3% for AGIs over 100k)
Total tax: $5,320 (reported on 80.9% of returns)
53010:
$5,320
State:
$7,114
(% of AGI for various income ranges: 5.2% for AGIs below $10k, 4.6% for AGIs $10k-25k, 7.5% for AGIs $25k-50k, 8.0% for AGIs $50k-75k, 9.4% for AGIs $75k-100k, 17.1% for AGIs over 100k)
Earned income credit: $1,383 (reported on 7.1% of returns)
Here:
$1,383
State:
$1,544
Percentage of individuals using paid preparers for their 2004 taxes: 65.9%
Here:
66%
State:
57%
(% for various income ranges: 56.5% for AGIs below $10k, 65.1% for AGIs $10k-25k, 65.1% for AGIs $25k-50k, 71.8% for AGIs $50k-75k, 70.1% for AGIs $75k-100k, 76.0% for AGIs over 100k)
Likely homosexual households (counted as self-reported same-sex unmarried-partner households)
Lesbian couples: 0.1% of all households
Gay men: 0.3% of all households
Household received Food Stamps/SNAP in the past 12 months: 203 Household did not receive Food Stamps/SNAP in the past 12 months: 2,876
Women who had a birth in the past 12 months: 25 (13 now married, 11 unmarried) Women who did not have a birth in the past 12 months: 1,415 (749 now married, 666 unmarried)
Housing units in zip code 53010 with a mortgage: 1,611 (195 second mortgage, 160 both second mortgage and home equity loan) Houses without a mortgage: 72
Median monthly owner costs for units with a mortgage: $1,752 Median monthly owner costs for units without a mortgage: $651
Residents with income below the poverty level in 2022:
This zip code:
5.1%
Whole state:
10.7%
Residents with income below 50% of the poverty level in 2022:
This zip code:
3.4%
Whole state:
5.7%
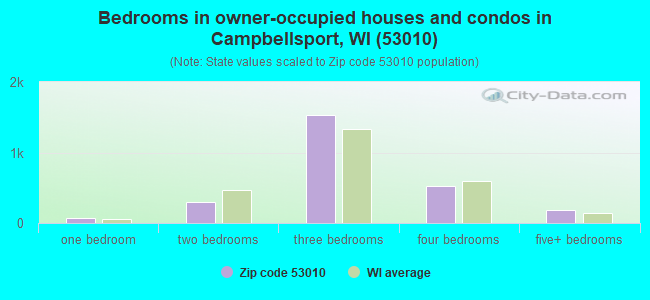
Median number of rooms in houses and condos:
Here:
6.4
State:
6.5
Median number of rooms in apartments:
Here:
4.9
State:
4.1
Notable locations in this zip code not listed on our city pages
Notable locations in zip code 53010: Campbellsport Wastewater Treatment Facility (A), Camp Vista (B), Kettle Moraine Youth Camp (C), Spruce Lake Bog National Landmark (D), Campbellsport Village Hall (E), Campbellsport Public Library (F), Campbellsport Volunteer Fire Department (G). Display/hide their locations on the map
Churches in zip code 53010 include: Campbellsport United Church of Christ (A), First Baptist Church of Campbellsport (B), Immanuel Lutheran Church (C), Saint Matthews Catholic Church (D), Salem Church (E), Saint Matthias Catholic Church (F), Saint Martins Church (G). Display/hide their locations on the map
Cemeteries: New Prospect Cemetery (1), Rauch Cemetery (2), Union Cemetery (3), Auburn Cemetery (4), Deutsche Bisch Cemetery (5), Armstrong Cemetery (6), Dundee Catholic Cemetery (7). Display/hide their locations on the map
Lakes, reservoirs, and swamps: Mud Lake (A), New Fane Millpond (B), Senn Lake (C), Auburn Lake (D), Spring Lake (E), Spruce Lake (F), Birchwood Lake (G), Buttermilk Lake (H). Display/hide their locations on the map
Parks in zip code 53010 include: Crooked Lake Wetlands State Natural Area (1), Haskell Noyes Memorial Woods State Natural Area (2), Milwaukee River and Swamp State Natural Area (3), Milwaukee River Tamarack Lowlands and Dundee Kame State Natural Area (4), Spring Lake State Natural Area (5), Spruce Lake Bog State Natural Area (6), Long Lake Recreation Area (7), Mauthe Lake Recreation Area (8), Columbus Park (9). Display/hide their locations on the map
1,016 married couples with children.
279 single-parent households (68 men, 211 women).
98.0% of residents of 53010 zip code speak English at home.
1.1% of residents speak Spanish at home (80% very well, 20% well).
0.6% of residents speak other Indo-European language at home (82% very well, 18% well).
0.3% of residents speak Asian or Pacific Island language at home (100% very well).
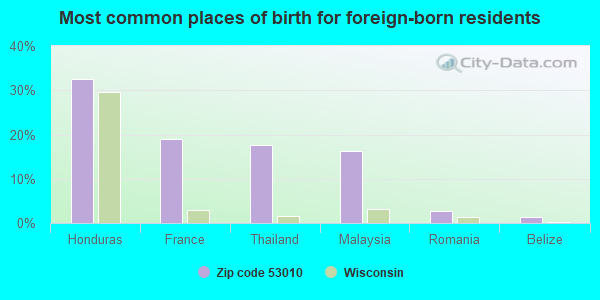
Foreign born population: 74 (1.0%) (70.7% of them are naturalized citizens)
This zip code:
1.0%
Whole state:
5.0%
32%Honduras
19%France
18%Thailand
16%Malaysia
3%Romania
1%Belize
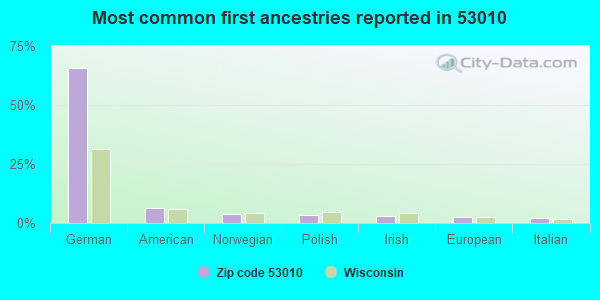
66%German
7%American
4%Norwegian
3%Polish
3%Irish
2%European
2%Italian
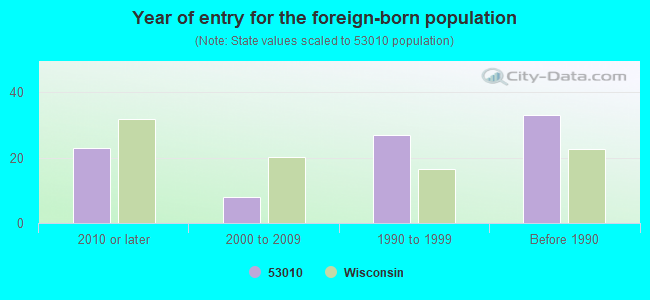
Year of entry for the foreign-born population
232010 or later
82000 to 2009
271990 to 1999
33Before 1990
Facilities with environmental interests located in this zip code:
CAMPBELLSPORT WASTEWATER TREATMENT FACILTY (164 NEW CASSEL ST. in CAMPBELLSPORT, WI)
National Pollutant Discharge Elimination System NON-MAJOR (Tracking pollutant discharge elimination systems) - permit National Pollutant Discharge Elimination System NON-MAJOR (Tracking pollutant discharge elimination systems) - permit STATE MASTER (Wisconsin database) - PCS-WI0020818, WASTEWATER FACILITY Business SIC classification: SEWERAGE SYSTEMS Organizations: CAMPBELLSPORT WASTEWATER TREATMENT FACILITY Alternative names: CAMPBELLSPORT VILLAGE, CAMPBELLSPORT WASTEWATER TRTMN
CAMPBELLSPORT PUBLIC SCHOOLS (114 W SHEBOYGAN ST in CAMPBELLSPORT, WI)
(Integrated Compliance Information System) - ICIS-05-1990-0236, FORMAL ENFORCEMENT ACTION COMPLIANCE ACTIVITY (Tracking inspections of insecticide, fungicide, and rodenticide, and toxic substances) Small Quantity Generators, between 100 kg and 1000 kg of hazardous waste/month (Resource Conservation and Recovery Act (tracking hazardous waste)) - notification Business SIC classification: ELEMENTARY AND SECONDARY SCHOOLS Organizations: DISTRICT OF CAMPBELLSPORT (CONTACT/OWNER)
Alternative names: CAMPBELLSPORT SCHOOL DISTRICT
CAMPBELLSPORT VIL GARAGE (102 RAILROAD ST in CAMPBELLSPORT, WI)
Conditionally Exempt Small Quantity Generators, less than 100 kg/month of hazardous waste (Resource Conservation and Recovery Act (tracking hazardous waste)) - notification STATE MASTER (Wisconsin database) - RCRAINFO-WID988605267, CESQG Organizations: CAMPBELLSPORT VILLAGE OF (CONTACT/OWNER)
Alternative names: VILLAGE OF CAMPBELLSPORT GARAGE
CAMPBELLSPORT EL (751 HIGHWAY W in CAMPBELLSPORT, WI)
(National Center for Education Statistics) - STATE ID-0020 Organizations: CAMPBELLSPORT SCH DIST (SCHOOL DISTRICT)
CAMPBELLSPORT HI (114 W SHEBOYGAN ST in CAMPBELLSPORT, WI)
(National Center for Education Statistics) - STATE ID-0040 Organizations: CAMPBELLSPORT SCH DIST (SCHOOL DISTRICT)
CAMPBELLSPORT JR HI (114 W SHEBOYGAN ST in CAMPBELLSPORT, WI)
(National Center for Education Statistics) - STATE ID-0300 Organizations: CAMPBELLSPORT SCH DIST (SCHOOL DISTRICT)
Housing units lacking complete plumbing facilities: 0.9% Housing units lacking complete kitchen facilities: 1.5%
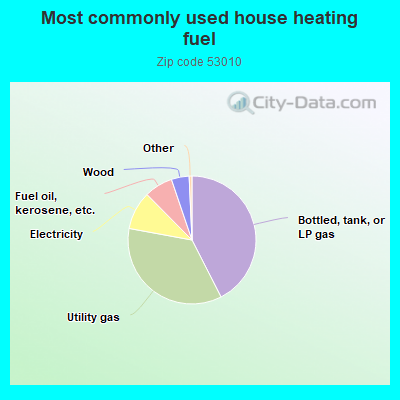
42.5%Bottled, tank, or LP gas
35.4%Utility gas
9.7%Electricity
7.2%Fuel oil, kerosene, etc.
4.5%Wood
Population in 1990: 6,057. Population change in the 1990s: +1,343 (+22.2%).
Place of birth for U.S.-born residents:
This state: 6,580
Northeast: 63
Midwest: 549
South: 121
West: 120
67% of the 53010 zip code residents lived in the same house 5 years ago. Out of people who lived in different houses, 47% lived in this county. Out of people who lived in different counties, 50% lived in Wisconsin.
93% of the 53010 zip code residents lived in the same house 1 year ago. Out of people who lived in different houses, 39% moved from this county. Out of people who lived in different houses, 57% moved from different county within same state. Out of people who lived in different houses, 4% moved from different state. Out of people who lived in different houses, 2% moved from abroad.
Private vs. public school enrollment:
Students in private schools in grades 1 to 8 (elementary and middle school): 182
Here:
29.3%
Wisconsin:
16.7%
Students in private schools in grades 9 to 12 (high school): 59
Here:
14.9%
Wisconsin:
12.5%
Students in private undergraduate colleges: 65
Here:
20.3%
Wisconsin:
17.5%
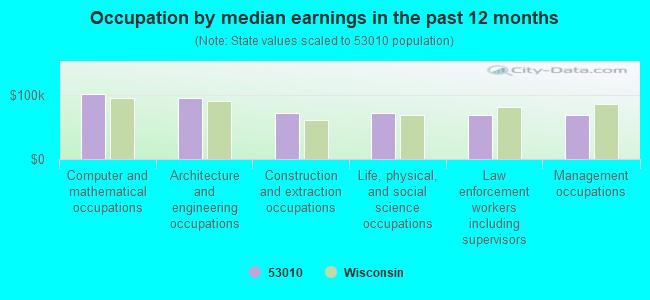
Occupation by median earnings in the past 12 months ($)
101,459Computer and mathematical occupations
95,450Architecture and engineering occupations
71,844Construction and extraction occupations
70,818Life, physical, and social science occupations
68,951Law enforcement workers including supervisors
68,446Management occupations
Top industries in this zip code by the number of employees in 2005:
Other Services (except Public Administration): Religious Organizations (100-249 employees: 1 establishment, 20-49 employees: 1 establishment, 5-9 employees: 2 establishments, 1-4 employees: 3 establishments)
Accommodation and Food Services: Full-Service Restaurants (20-49: 4, 5-9: 2)
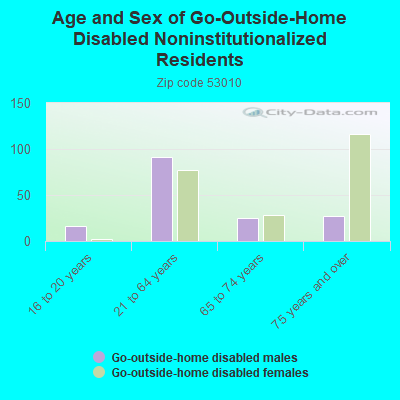
People in group quarters in 2010:
150 people in other noninstitutional facilities
People in group quarters in 2000:
117 people in religious group quarters
Fatal accident statistics in 2014:
Fatal accident count: 1
Vehicles involved in fatal accidents: 1
Fatal accidents caused by drunken drivers: 1
Fatalities: 1
Persons involved in fatal accidents: 1
Pedestrians involved in fatal accidents: 0
Fatal accident statistics in 2012:
Fatal accident count: 1
Vehicles involved in fatal accidents: 1
Fatal accidents caused by drunken drivers: 0
Fatalities: 3
Persons involved in fatal accidents: 9
Pedestrians involved in fatal accidents: 0
Home Mortgage Disclosure Act Aggregated Statistics For Year 2009 (Based on 4 partial tracts)
A) FHA, FSA/RHS & VA Home Purchase Loans
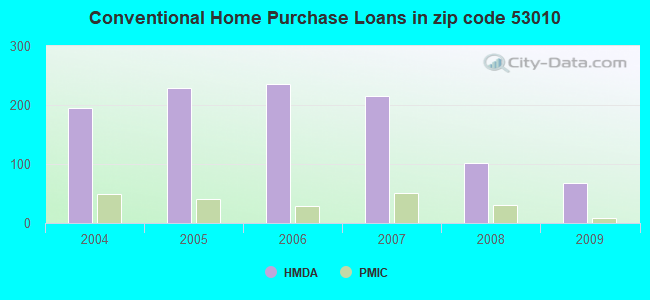
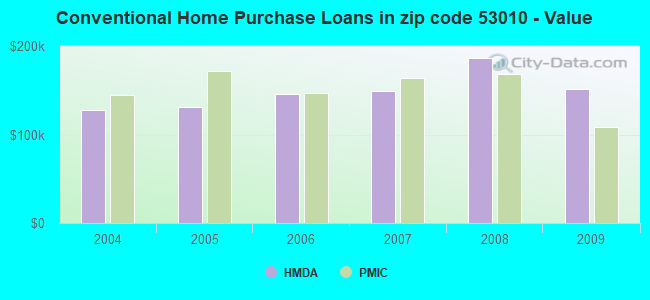
B) Conventional Home Purchase Loans
C) Refinancings
D) Home Improvement Loans
F) Non-occupant Loans on < 5 Family Dwellings (A B C & D)
G) Loans On Manufactured Home Dwelling (A B C & D)
Number
Average Value
Number
Average Value
Number
Average Value
Number
Average Value
Number
Average Value
Number
Average Value
LOANS ORIGINATED
36
$147,827
68
$151,683
645
$159,897
35
$77,766
36
$161,524
5
$51,456
APPLICATIONS APPROVED, NOT ACCEPTED
1
$118,560
3
$125,870
58
$164,312
4
$27,845
0
$0
1
$20,640
APPLICATIONS DENIED
6
$158,535
15
$75,112
132
$169,036
15
$29,475
5
$121,982
12
$65,155
APPLICATIONS WITHDRAWN
0
$0
6
$88,335
89
$164,206
8
$80,148
2
$184,615
0
$0
FILES CLOSED FOR INCOMPLETENESS
4
$167,135
0
$0
30
$162,140
0
$0
2
$63,970
0
$0
Aggregated Statistics For Year 2008 (Based on 4 partial tracts)
A) FHA, FSA/RHS & VA Home Purchase Loans
B) Conventional Home Purchase Loans
C) Refinancings
D) Home Improvement Loans
F) Non-occupant Loans on < 5 Family Dwellings (A B C & D)
G) Loans On Manufactured Home Dwelling (A B C & D)
Number
Average Value
Number
Average Value
Number
Average Value
Number
Average Value
Number
Average Value
Number
Average Value
LOANS ORIGINATED
34
$173,375
102
$186,664
378
$163,303
44
$44,563
43
$186,385
8
$76,812
APPLICATIONS APPROVED, NOT ACCEPTED
1
$164,160
7
$140,491
46
$135,932
3
$103,627
2
$108,120
0
$0
APPLICATIONS DENIED
5
$182,022
11
$137,159
144
$173,649
13
$25,865
0
$0
4
$33,032
APPLICATIONS WITHDRAWN
4
$119,340
10
$110,083
38
$185,614
4
$87,848
0
$0
0
$0
FILES CLOSED FOR INCOMPLETENESS
1
$103,680
7
$164,497
9
$133,700
2
$137,550
0
$0
0
$0
Aggregated Statistics For Year 2007 (Based on 4 partial tracts)
A) FHA, FSA/RHS & VA Home Purchase Loans
B) Conventional Home Purchase Loans
C) Refinancings
D) Home Improvement Loans
E) Loans on Dwellings For 5+ Families
F) Non-occupant Loans on < 5 Family Dwellings (A B C & D)
G) Loans On Manufactured Home Dwelling (A B C & D)
Number
Average Value
Number
Average Value
Number
Average Value
Number
Average Value
Number
Average Value
Number
Average Value
Number
Average Value
LOANS ORIGINATED
26
$141,072
216
$149,640
320
$141,857
75
$59,528
2
$355,895
33
$145,156
11
$67,817
APPLICATIONS APPROVED, NOT ACCEPTED
2
$182,000
10
$124,905
55
$182,927
12
$81,030
0
$0
0
$0
0
$0
APPLICATIONS DENIED
1
$134,880
31
$155,673
150
$182,635
34
$66,443
0
$0
11
$167,109
14
$53,182
APPLICATIONS WITHDRAWN
0
$0
16
$133,715
77
$208,385
10
$125,288
0
$0
3
$117,680
0
$0
FILES CLOSED FOR INCOMPLETENESS
0
$0
2
$120,735
21
$179,077
2
$27,030
0
$0
0
$0
0
$0
Aggregated Statistics For Year 2006 (Based on 4 partial tracts)
A) FHA, FSA/RHS & VA Home Purchase Loans
B) Conventional Home Purchase Loans
C) Refinancings
D) Home Improvement Loans
F) Non-occupant Loans on < 5 Family Dwellings (A B C & D)
G) Loans On Manufactured Home Dwelling (A B C & D)
Number
Average Value
Number
Average Value
Number
Average Value
Number
Average Value
Number
Average Value
Number
Average Value
LOANS ORIGINATED
15
$139,229
236
$146,024
367
$132,737
76
$63,892
40
$109,323
7
$55,461
APPLICATIONS APPROVED, NOT ACCEPTED
0
$0
29
$161,513
54
$128,708
5
$25,294
0
$0
3
$29,027
APPLICATIONS DENIED
2
$134,250
29
$101,511
125
$156,954
14
$75,946
3
$59,993
7
$32,229
APPLICATIONS WITHDRAWN
0
$0
21
$73,946
82
$144,395
8
$87,062
5
$79,060
0
$0
FILES CLOSED FOR INCOMPLETENESS
0
$0
5
$128,302
46
$157,104
0
$0
0
$0
0
$0
Aggregated Statistics For Year 2005 (Based on 4 partial tracts)
A) FHA, FSA/RHS & VA Home Purchase Loans
B) Conventional Home Purchase Loans
C) Refinancings
D) Home Improvement Loans
E) Loans on Dwellings For 5+ Families
F) Non-occupant Loans on < 5 Family Dwellings (A B C & D)
G) Loans On Manufactured Home Dwelling (A B C & D)
Number
Average Value
Number
Average Value
Number
Average Value
Number
Average Value
Number
Average Value
Number
Average Value
Number
Average Value
LOANS ORIGINATED
6
$140,362
228
$131,189
446
$131,759
61
$62,954
4
$156,775
39
$99,165
12
$55,163
APPLICATIONS APPROVED, NOT ACCEPTED
0
$0
22
$100,818
42
$111,814
5
$36,634
0
$0
3
$70,403
2
$24,480
APPLICATIONS DENIED
1
$99,840
24
$102,870
169
$142,085
36
$42,750
0
$0
12
$94,972
18
$55,172
APPLICATIONS WITHDRAWN
0
$0
9
$119,426
103
$162,785
7
$72,551
0
$0
4
$129,485
0
$0
FILES CLOSED FOR INCOMPLETENESS
0
$0
9
$92,109
48
$160,059
2
$24,020
0
$0
0
$0
2
$173,895
Aggregated Statistics For Year 2004 (Based on 4 partial tracts)
A) FHA, FSA/RHS & VA Home Purchase Loans
B) Conventional Home Purchase Loans
C) Refinancings
D) Home Improvement Loans
F) Non-occupant Loans on < 5 Family Dwellings (A B C & D)
G) Loans On Manufactured Home Dwelling (A B C & D)
Detailed PMIC statistics for the following Tracts:0419.00
, 0422.00
2002 - 2018 National Fire Incident Reporting System (NFIRS) incidents
According to the data from the years 2002 - 2018 the average number of fires per year is 27. The highest number of reported fires - 64 took place in 2018, and the least - 1 in 2003. The data has an increasing trend.
When looking into fire subcategories, the most reports belonged to: Structure Fires (57.2%), and Outside Fires (32.5%).
Fire incident types reported to NFIRS in Zip Code 53010


+$6,760
-$2,654
(% of AGI for various income ranges: 2.8% for AGIs below $10k, 0.5% for AGIs $10k-25k, 0.7% for AGIs $25k-50k, 0.3% for AGIs $50k-75k, 1.3% for AGIs $75k-100k) Nearest zip codes: 53019, 53040, 53002, 53090, 53057, 53011.


 According to the data from the years 2002 - 2018 the average number of fires per year is 27. The highest number of reported fires - 64 took place in 2018, and the least - 1 in 2003. The data has an increasing trend.
 When looking into fire subcategories, the most reports belonged to: Structure Fires (57.2%), and Outside Fires (32.5%).