Estimated zip code population in 2022: 18,627 Zip code population in 2010: 18,370 Zip code population in 2000: 18,835
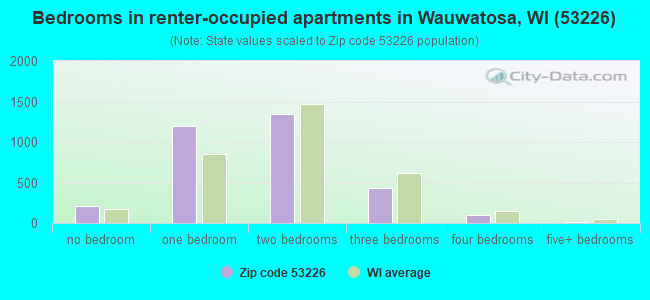
Houses and condos: 8,885 Renter-occupied apartments: 3,285
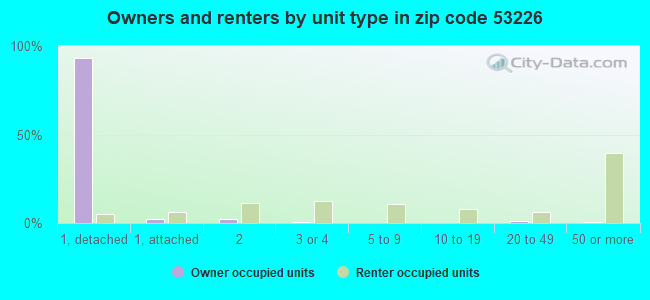
% of renters here:
39%
State:
32%
March 2022 cost of living index in zip code 53226: 98.5 (near average, U.S. average is 100)
Land area: 6.9 sq. mi. Water area: 0.0 sq. mi.
Population density: 2,706 people per square mile
(average).
OSM Map
General Map
Google Map
MSN Map
OSM Map
General Map
Google Map
MSN Map
OSM Map
General Map
Google Map
MSN Map
OSM Map
General Map
Google Map
MSN Map
Please wait while loading the map...
Real estate property taxes paid for housing units in 2022:
This zip code:
1.7% ($5,387)
Wisconsin:
1.4% ($3,497)
Median real estate property taxes paid for housing units with mortgages in 2022: $5,624 (1.7%) Median real estate property taxes paid for housing units with no mortgage in 2022: $4,837 (1.6%)
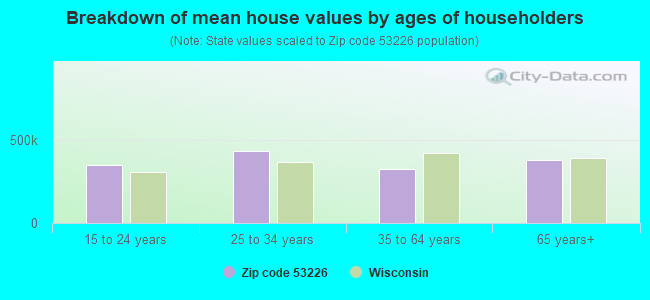
Estimated median house/condo value in 2022: $312,449
53226:
$312,449
Wisconsin:
$252,800
According to our research of Wisconsin and other state lists, there were 9 registered sex offenders living in 53226 zip code as of April 27, 2024. The ratio of all residents to sex offenders in zip code 53226 is 2,169 to 1. The ratio of registered sex offenders to all residents in this zip code is much lower than the state average.
Median resident age:
This zip code:
39.0 years
Wisconsin median age:
40.4 years
Average household size:
This zip code:
2.1 people
Wisconsin:
2.3 people
Averages for the 2020 tax year for zip code 53226, filed in 2021:
Average Adjusted Gross Income (AGI) in 2020: $89,172 (Individual Income Tax Returns)
Here:
$89,172
State:
$72,319
Salary/wage: $78,222 (reported on 80.6% of returns)
Here:
$78,222
State:
$59,242
(% of AGI for various income ranges: 1126.6% for AGIs below $25k, 3907.4% for AGIs $25k-50k, 6823.9% for AGIs $50k-75k, 9890.4% for AGIs $75k-100k, 18671.9% for AGIs $100k-200k, 63450.3% for AGIs over 200k)
Taxable interest for individuals: $1,532 (reported on 43.7% of returns)
This zip code:
$1,532
Wisconsin:
$1,431
(% of AGI for various income ranges: 34.0% for AGIs below $25k, 47.3% for AGIs $25k-50k, 60.2% for AGIs $50k-75k, 86.1% for AGIs $75k-100k, 149.4% for AGIs $100k-200k, 813.5% for AGIs over 200k)
Ordinary dividends: $6,814 (reported on 34.9% of returns)
Here:
$6,814
State:
$6,481
(% of AGI for various income ranges: 63.8% for AGIs below $25k, 95.4% for AGIs $25k-50k, 174.4% for AGIs $50k-75k, 289.2% for AGIs $75k-100k, 529.3% for AGIs $100k-200k, 3702.9% for AGIs over 200k)
Net capital gain/loss in AGI: +$19,025 (reported on 29.5% of returns)
Here:
+$19,025
State:
+$18,329
(% of AGI for various income ranges: 22.8% for AGIs below $25k, 65.9% for AGIs $25k-50k, 118.6% for AGIs $50k-75k, 252.0% for AGIs $75k-100k, 629.3% for AGIs $100k-200k, 14449.0% for AGIs over 200k)
Profit/loss from business: +$17,057 (reported on 11.8% of returns)
Here:
+$17,057
State:
+$14,562
(% of AGI for various income ranges: 57.3% for AGIs below $25k, 105.1% for AGIs $25k-50k, 179.4% for AGIs $50k-75k, 182.5% for AGIs $75k-100k, 521.4% for AGIs $100k-200k, 2752.9% for AGIs over 200k)
Taxable individual retirement arrangement distribution: $20,386 (reported on 14.3% of returns)
53226:
$20,386
Wisconsin:
$19,348
(% of AGI for various income ranges: 120.8% for AGIs below $25k, 180.8% for AGIs $25k-50k, 319.0% for AGIs $50k-75k, 553.7% for AGIs $75k-100k, 973.7% for AGIs $100k-200k, 1965.2% for AGIs over 200k)
Self-employed (Keogh) retirement plans: $21,260 (reported on 1.0% of returns)
53226:
$21,260
Wisconsin:
$21,322
(% of AGI for various income ranges: 51.5% for AGIs $100k-200k, 494.8% for AGIs over 200k)
Total itemized deductions: $31,267 (reported on 12.0% of returns)
Here:
$31,267
State:
$33,000
(% of AGI for various income ranges: 111.1% for AGIs below $25k, 206.6% for AGIs $25k-50k, 446.9% for AGIs $50k-75k, 613.1% for AGIs $75k-100k, 869.3% for AGIs $100k-200k, 4388.1% for AGIs over 200k)
Charity contributions: $12,299 (reported on 9.7% of returns)
Here:
$12,299
State:
$12,044
(% of AGI for various income ranges: 10.5% for AGIs below $25k, 28.9% for AGIs $25k-50k, 58.0% for AGIs $50k-75k, 96.9% for AGIs $75k-100k, 220.0% for AGIs $100k-200k, 2445.2% for AGIs over 200k)
Taxes paid: $8,288 (reported on 12.0% of returns)
53226:
$8,288
State:
$8,228
(% of AGI for various income ranges: 24.5% for AGIs below $25k, 47.4% for AGIs $25k-50k, 126.8% for AGIs $50k-75k, 244.5% for AGIs $75k-100k, 286.3% for AGIs $100k-200k, 793.9% for AGIs over 200k)
Earned income credit: $1,765 (reported on 6.2% of returns)
Here:
$1,765
State:
$2,155
(% of AGI for various income ranges: 45.4% for AGIs below $25k, 30.0% for AGIs $25k-50k)
Percentage of individuals using paid preparers for their 2020 taxes: 92.7%
Here:
93%
State:
94%
(% for various income ranges: 89.6% for AGIs below $25k, 93.1% for AGIs $25k-50k, 93.1% for AGIs $50k-75k, 92.9% for AGIs $75k-100k, 94.2% for AGIs $100k-200k, 95.1% for AGIs over 200k)
Averages for the 2012 tax year for zip code 53226, filed in 2013:
Average Adjusted Gross Income (AGI) in 2012: $71,491 (Individual Income Tax Returns)
Here:
$71,491
State:
$57,939
Salary/wage: $64,185 (reported on 80.7% of returns)
Here:
$64,185
State:
$48,248
(% of AGI for various income ranges: 64.5% for AGIs below $25k, 76.0% for AGIs $25k-50k, 72.2% for AGIs $50k-75k, 72.8% for AGIs $75k-100k, 77.5% for AGIs $100k-200k, 65.8% for AGIs over 200k)
Taxable interest for individuals: $1,475 (reported on 49.5% of returns)
This zip code:
$1,475
Wisconsin:
$1,224
(% of AGI for various income ranges: 2.2% for AGIs below $25k, 1.2% for AGIs $25k-50k, 1.0% for AGIs $50k-75k, 0.8% for AGIs $75k-100k, 0.6% for AGIs $100k-200k, 1.4% for AGIs over 200k)
Ordinary dividends: $5,918 (reported on 36.1% of returns)
Here:
$5,918
State:
$5,137
(% of AGI for various income ranges: 3.7% for AGIs below $25k, 2.1% for AGIs $25k-50k, 2.3% for AGIs $50k-75k, 2.2% for AGIs $75k-100k, 2.5% for AGIs $100k-200k, 4.8% for AGIs over 200k)
Net capital gain/loss in AGI: +$5,953 (reported on 27.1% of returns)
Here:
+$5,953
State:
+$11,137
(% of AGI for various income ranges: 0.2% for AGIs below $25k, 0.4% for AGIs $25k-50k, 0.8% for AGIs $50k-75k, 0.9% for AGIs $75k-100k, 1.7% for AGIs $100k-200k, 5.8% for AGIs over 200k)
Profit/loss from business: +$14,742 (reported on 11.6% of returns)
Here:
+$14,742
State:
+$11,943
(% of AGI for various income ranges: 4.5% for AGIs below $25k, 2.2% for AGIs $25k-50k, 2.5% for AGIs $50k-75k, 2.3% for AGIs $75k-100k, 2.9% for AGIs $100k-200k, 1.4% for AGIs over 200k)
Taxable individual retirement arrangement distribution: $15,420 (reported on 17.0% of returns)
53226:
$15,420
Wisconsin:
$14,087
(% of AGI for various income ranges: 7.0% for AGIs below $25k, 4.5% for AGIs $25k-50k, 3.9% for AGIs $50k-75k, 4.4% for AGIs $75k-100k, 3.4% for AGIs $100k-200k, 2.4% for AGIs over 200k)
Self-employment retirement plans: $19,600 (reported on 0.9% of returns)
53226:
$19,600
Wisconsin:
$17,048
(% of AGI for various income ranges: 0.3% for AGIs $50k-75k, 0.2% for AGIs $100k-200k, 0.6% for AGIs over 200k)
Total itemized deductions: $23,391 (21% of AGI, reported on 47.8% of returns)
Here:
$23,391
State:
$22,257
Here:
20.7% of AGI
State:
20.1% of AGI
(% of AGI for various income ranges: 18.4% for AGIs below $25k, 11.5% for AGIs $25k-50k, 15.4% for AGIs $50k-75k, 17.5% for AGIs $75k-100k, 16.5% for AGIs $100k-200k, 15.1% for AGIs over 200k)
Charity contributions: $3,979 (reported on 41.0% of returns)
Here:
$3,979
State:
$3,370
(% of AGI for various income ranges: 1.1% for AGIs below $25k, 1.1% for AGIs $25k-50k, 1.8% for AGIs $50k-75k, 2.1% for AGIs $75k-100k, 2.1% for AGIs $100k-200k, 3.8% for AGIs over 200k)
Taxes paid: $11,819 (reported on 47.6% of returns)
53226:
$11,819
State:
$10,731
(% of AGI for various income ranges: 5.2% for AGIs below $25k, 4.7% for AGIs $25k-50k, 6.9% for AGIs $50k-75k, 8.4% for AGIs $75k-100k, 9.1% for AGIs $100k-200k, 8.6% for AGIs over 200k)
Earned income credit: $1,755 (reported on 6.8% of returns)
Here:
$1,755
State:
$2,094
(% of AGI for various income ranges: 2.5% for AGIs below $25k, 0.4% for AGIs $25k-50k)
Percentage of individuals using paid preparers for their 2012 taxes: 48.2%
Here:
48%
State:
54%
(% for various income ranges: 42.4% for AGIs below $25k, 44.1% for AGIs $25k-50k, 53.2% for AGIs $50k-75k, 52.3% for AGIs $75k-100k, 49.1% for AGIs $100k-200k, 73.3% for AGIs over 200k)
Averages for the 2004 tax year for zip code 53226, filed in 2005:
Average Adjusted Gross Income (AGI) in 2004: $59,680 (Individual Income Tax Returns)
Here:
$59,680
State:
$47,735
Salary/wage: $51,818 (reported on 78.9% of returns)
Here:
$51,818
State:
$41,540
(% of AGI for various income ranges: 80.5% for AGIs below $10k, 58.3% for AGIs $10k-25k, 74.5% for AGIs $25k-50k, 72.7% for AGIs $50k-75k, 78.6% for AGIs $75k-100k, 62.3% for AGIs over 100k)
Taxable interest for individuals: $1,983 (reported on 65.7% of returns)
This zip code:
$1,983
Wisconsin:
$1,420
(% of AGI for various income ranges: 6.9% for AGIs below $10k, 5.6% for AGIs $10k-25k, 2.5% for AGIs $25k-50k, 2.1% for AGIs $50k-75k, 1.5% for AGIs $75k-100k, 1.9% for AGIs over 100k)
Taxable dividends: $4,077 (reported on 44.3% of returns)
Here:
$4,077
State:
$2,869
(% of AGI for various income ranges: 7.2% for AGIs below $10k, 4.6% for AGIs $10k-25k, 3.0% for AGIs $25k-50k, 2.4% for AGIs $50k-75k, 2.0% for AGIs $75k-100k, 3.3% for AGIs over 100k)
Net capital gain/loss: +$7,339 (reported on 34.0% of returns)
Here:
+$7,339
State:
+$9,569
(% of AGI for various income ranges: -4.4% for AGIs below $10k, 0.9% for AGIs $10k-25k, 0.6% for AGIs $25k-50k, 1.2% for AGIs $50k-75k, 1.7% for AGIs $75k-100k, 7.9% for AGIs over 100k)
Profit/loss from business: +$14,147 (reported on 11.8% of returns)
Here:
+$14,147
State:
+$10,417
(% of AGI for various income ranges: 3.2% for AGIs below $10k, 4.5% for AGIs $10k-25k, 2.3% for AGIs $25k-50k, 2.7% for AGIs $50k-75k, 2.4% for AGIs $75k-100k, 2.9% for AGIs over 100k)
IRA payment deduction: $2,962 (reported on 2.5% of returns)
53226:
$2,962
Wisconsin:
$2,900
(% of AGI for various income ranges: 0.3% for AGIs below $10k, 0.3% for AGIs $10k-25k, 0.3% for AGIs $25k-50k, 0.1% for AGIs $50k-75k, 0.1% for AGIs $75k-100k, 0.1% for AGIs over 100k)
Self-employed pension: $12,669 (reported on 1.3% of returns)
Here:
$12,669
Wisconsin:
$11,934
(% of AGI for various income ranges: 0.1% for AGIs $25k-50k, 0.2% for AGIs $50k-75k, 0.2% for AGIs $75k-100k, 0.4% for AGIs over 100k)
Total itemized deductions: $19,500 (21% of AGI, reported on 50.6% of returns)
Here:
$19,500
State:
$18,160
Here:
21.0% of AGI
State:
21.1% of AGI
(% of AGI for various income ranges: 22.7% for AGIs below $10k, 20.9% for AGIs $10k-25k, 14.4% for AGIs $25k-50k, 18.7% for AGIs $50k-75k, 19.6% for AGIs $75k-100k, 14.7% for AGIs over 100k)
Charity contributions deductions: $3,209 (3% of AGI, reported on 46.4% of returns)
Here:
$3,209
State:
$2,711
Here:
3.3% of AGI
State:
3.0% of AGI
(% of AGI for various income ranges: 1.4% for AGIs below $10k, 2.0% for AGIs $10k-25k, 1.7% for AGIs $25k-50k, 2.4% for AGIs $50k-75k, 2.4% for AGIs $75k-100k, 2.9% for AGIs over 100k)
Total tax: $9,541 (reported on 82.0% of returns)
53226:
$9,541
State:
$7,114
(% of AGI for various income ranges: 2.0% for AGIs below $10k, 4.4% for AGIs $10k-25k, 8.1% for AGIs $25k-50k, 9.6% for AGIs $50k-75k, 10.2% for AGIs $75k-100k, 18.3% for AGIs over 100k)
Earned income credit: $1,153 (reported on 4.9% of returns)
Here:
$1,153
State:
$1,544
Percentage of individuals using paid preparers for their 2004 taxes: 49.4%
Here:
49%
State:
57%
(% for various income ranges: 42.0% for AGIs below $10k, 51.1% for AGIs $10k-25k, 47.9% for AGIs $25k-50k, 52.1% for AGIs $50k-75k, 50.2% for AGIs $75k-100k, 55.0% for AGIs over 100k)
Likely homosexual households (counted as self-reported same-sex unmarried-partner households)
Lesbian couples: 0.3% of all households
Gay men: 0.2% of all households
Household received Food Stamps/SNAP in the past 12 months: 325 Household did not receive Food Stamps/SNAP in the past 12 months: 7,966
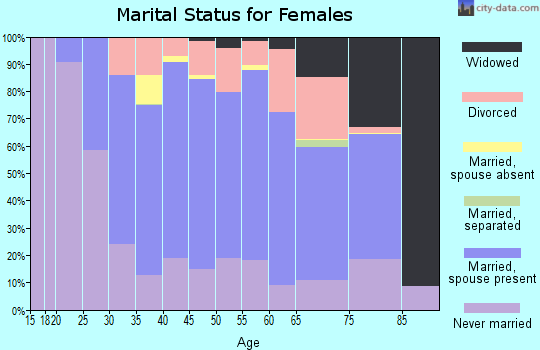
Women who had a birth in the past 12 months: 145 (146 now married, 0 unmarried) Women who did not have a birth in the past 12 months: 5,157 (2,002 now married, 3,155 unmarried)
Housing units in zip code 53226 with a mortgage: 3,179 (473 second mortgage, 478 both second mortgage and home equity loan) Houses without a mortgage: 116
Median monthly owner costs for units with a mortgage: $1,863 Median monthly owner costs for units without a mortgage: $748
Residents with income below the poverty level in 2022:
This zip code:
7.2%
Whole state:
10.7%
Residents with income below 50% of the poverty level in 2022:
This zip code:
2.7%
Whole state:
5.7%
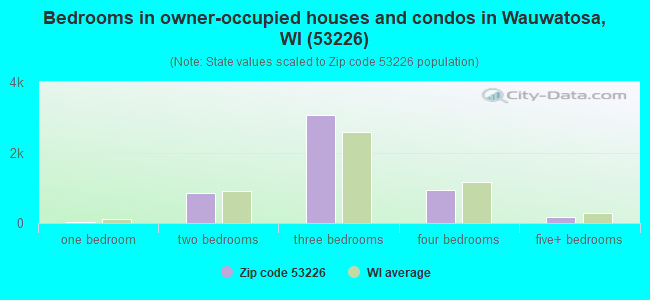
Median number of rooms in houses and condos:
Here:
6.6
State:
6.5
Median number of rooms in apartments:
Here:
3.8
State:
4.1
Notable locations in this zip code not listed on our city pages
Notable locations in zip code 53226: Blue Mound Country Club (A), Hanson Golf Course (B), Paratech Ambulance Service Milwaukee Division Ripley (C), Hawks Nursery (D), Wauwatosa Fire Department Station 3 (E). Display/hide their locations on the map
Churches in zip code 53226 include: Christ the King Roman Catholic Church (A), Our Redeemer Evangelical Lutheran Church (B), Saint Therese Roman Catholic Church (C). Display/hide their locations on the map
Parks in zip code 53226 include: Chippewa Park (1), Underwood Creek Parkway (2), Cannon Park (3), Gravel Sholes Park (4), Wisconsin Avenue Park (5). Display/hide their locations on the map
Tourist attractions (not listed on the city page) : Milwaukee County - Zoological Gardens Zoo- Main Office (Cultural Attractions- Events- & Facilities; 10001 West Bluemound Road), Medical College of Wisconsin - Public and Community Health-Senior Associate Dean- Libra (Cultural Attractions- Events- & Facilities; 8701 West Watertown Plank Road), Foundation for Wildlife Conservation Inc (Cultural Attractions- Events- & Facilities; 10005 West Bluemound Road), The Milwaukee Astronomical Society (Nature Centers; 11040 West Meinecke Avenue 4).
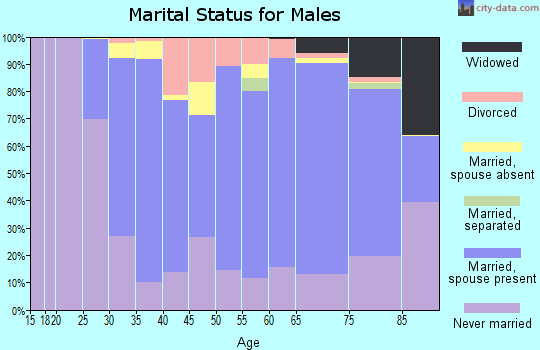
2,489 married couples with children.
741 single-parent households (349 men, 392 women).
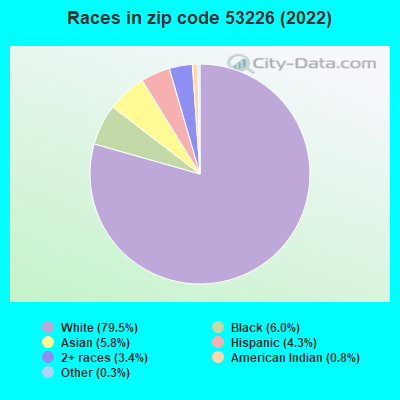
91.0% of residents of 53226 zip code speak English at home.
2.2% of residents speak Spanish at home (78% very well, 20% well, 1% not well).
3.3% of residents speak other Indo-European language at home (53% very well, 43% well, 3% not well).
3.0% of residents speak Asian or Pacific Island language at home (81% very well, 15% well, 4% not well).
0.5% of residents speak other language at home (100% very well).
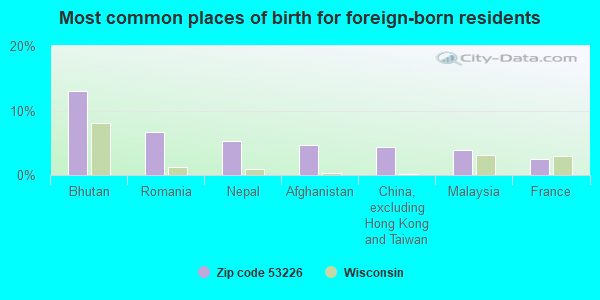
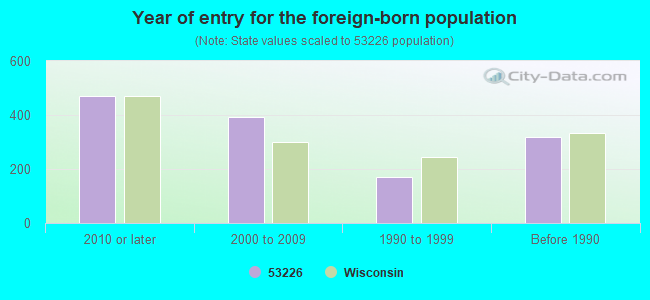
Foreign born population: 1,268 (6.8%) (51.1% of them are naturalized citizens)
Major facilities with environmental interests located in this zip code:
BEST FORD (1901 N MAYFAIR RD in MILWAUKEE, WI)
Small Quantity Generators, between 100 kg and 1000 kg of hazardous waste/month (Resource Conservation and Recovery Act (tracking hazardous waste)) - notification STATE MASTER (Wisconsin database) - RCRAINFO-WID023452600, HAZARDOUS WASTE PROGRAM, SQG Business SIC classification: MOTOR VEHICLE DEALERS (NEW AND USED); TOP, BODY, AND UPHOLSTERY REPAIR SHOPS AND PAINT SHOPS Organizations: MICHAEL R FLANNERY (CONTACT/OPERATOR)
, WALSH HARRY AND FLANNERY MIKE (CONTACT/OWNER)
, BIRDIE LLC (CONTACT/OWNER)
Alternative names: BEST FORD AND MAZDA
BLOOD CENTER OF SE WI INC WATERTWN PLANK RD (8727 WATERTOWN PLANK RD in MILWAUKEE, WI)
Conditionally Exempt Small Quantity Generators, less than 100 kg/month of hazardous waste (Resource Conservation and Recovery Act (tracking hazardous waste)) - notification STATE MASTER (Wisconsin database) - RCRAINFO-WID988617692, CESQG Business NAICS classification: BLOOD AND ORGAN BANKS. Organizations: MILWAUKEE CNTY, BLOODCENTER OF SOUTHEASTERN WISCONSIN (CONTACT/OPERATOR)
, BLOOD CTR OF SE WI INC THE (CONTACT/OWNER)
, MILWAUKEE COUNTY (CONTACT/OWNER)
Alternative names: BLOOD CENTER/SOUTHEASTERN WISCONSIN, BLOOD RESEARCH INSTITUTE THE, THE BLOODCENTER OF SOUTHEASTERN WISCONSI
BOSTIK FINDLEY INC (11320 WATERTOWN PLANK RD in WAUWATOSA, WI)
ENFORCEMENT/COMPLIANCE ACTIVITY (Integrated Compliance Information System) Small Quantity Generators, between 100 kg and 1000 kg of hazardous waste/month (Resource Conservation and Recovery Act (tracking hazardous waste)) - notification STATE MASTER (Wisconsin database) - RCRAINFO-WID981098189, SQG Business SIC classification: ADHESIVES AND SEALANTS Business NAICS classification: ADHESIVE MANUFACTURING. Organizations: TOTAL FINA ELF (CONTACT/OWNER)
Alternative names: ATO FINDLEY INC
CLARK OIL STATION #19 (725 N MAYFAIR RD in WAUWATOSA, WI)
(Resource Conservation and Recovery Act (tracking hazardous waste)) STATE MASTER (Wisconsin database) - RCRAINFO-WI0000263756, SQG Business SIC classification: GASOLINE SERVICE STATIONS Organizations: CLARK REFINING AND MARKETING (CONTACT/OWNER)
Alternative names: CLARK OIL STATION 19
96TH STREET SUBSTATION (115 SOUTH 92ND STREET in WAUWATOSA, WI)
Conditionally Exempt Small Quantity Generators, less than 100 kg/month of hazardous waste (Resource Conservation and Recovery Act (tracking hazardous waste)) STATE MASTER (Wisconsin database) - RCRAINFO-WIR000114215, CESQG Business NAICS classification: ELECTRIC POWER DISTRIBUTION. Organizations: WISCONSIN ELECTRIC POWER CO (CONTACT/OPERATOR)
COD CO INC (11216 W BLUEMOUND RD in MILWAUKEE, WI)
Conditionally Exempt Small Quantity Generators, less than 100 kg/month of hazardous waste (Resource Conservation and Recovery Act (tracking hazardous waste)) - notification STATE MASTER (Wisconsin database) - RCRAINFO-WID988640249, CESQG Organizations: PILGREEN DARYL (CONTACT/OWNER)
BEYER D G (1701 NORTH MAYFAIR ROAD in WAUWATOSA, WI)
Conditionally Exempt Small Quantity Generators, less than 100 kg/month of hazardous waste (Resource Conservation and Recovery Act (tracking hazardous waste)) STATE MASTER (Wisconsin database) - RCRAINFO-WID988601241, CESQG Business SIC classification: TERMINAL AND JOINT TERMINAL MAINTENANCE FACILITIES FOR MOTOR FREIGHT TRANSPORTATION
CHILDRENS HOSPITAL OF WI SCH (9000 W WISCONSIN AVE in WAUWATOSA, WI)
(National Center for Education Statistics) - STATE ID-0800 Organizations: WAUWATOSA SCH DIST (SCHOOL DISTRICT)
BRENNTAG GREAT LAKES, LLC (WAREHOUSE) (4420 N HARLEY DAVIDSON AVE in WAUWATOSA, WI)
Large Quantity Generators, more that 1000 kg of hazardous waste/month (Resource Conservation and Recovery Act (tracking hazardous waste)) Organizations: CENTERPOINT PROPERTIES (CONTACT/OWNER)
BLACK AND DECKER (10424 W BLUEMOUND RD in WAUWATOSA, WI)
(Resource Conservation and Recovery Act (tracking hazardous waste)) Organizations: SEEDS BRUCE (CONTACT/OWNER)
BLAU PLUMBING INC (12221 W FAIRVIEW AVE in MILWAUKEE, WI)
A C TIM CO INC (1750 N MAFAIR RD in WAUWATOSA, WI)
(Resource Conservation and Recovery Act (tracking hazardous waste))
BUILDING SVC INC (620 N 108TH PL in WAUWATOSA, WI)
(Resource Conservation and Recovery Act (tracking hazardous waste))
Housing units lacking complete plumbing facilities: 0.6% Housing units lacking complete kitchen facilities: 1.7%
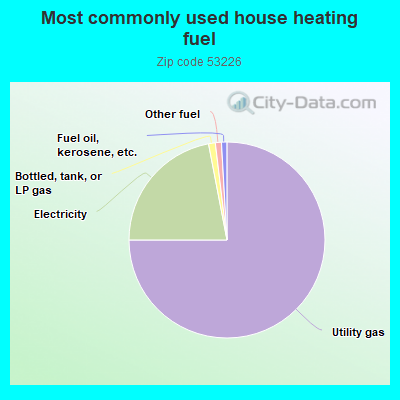
74.7%Utility gas
21.9%Electricity
1.1%Bottled, tank, or LP gas
1.0%Other fuel
0.9%Fuel oil, kerosene, etc.
Population in 1990: 19,216.
Place of birth for U.S.-born residents:
This state: 13,063
Northeast: 489
Midwest: 2,567
South: 603
West: 540
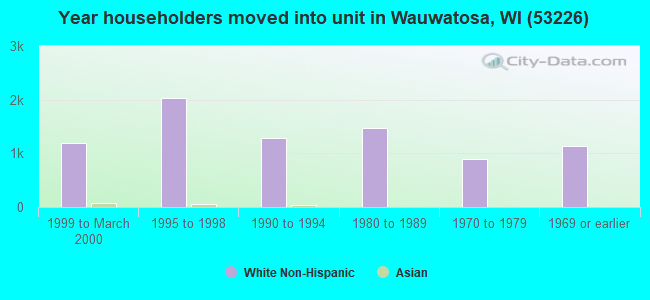
59% of the 53226 zip code residents lived in the same house 5 years ago. Out of people who lived in different houses, 62% lived in this county. Out of people who lived in different counties, 50% lived in Wisconsin.
87% of the 53226 zip code residents lived in the same house 1 year ago. Out of people who lived in different houses, 54% moved from this county. Out of people who lived in different houses, 19% moved from different county within same state. Out of people who lived in different houses, 24% moved from different state. Out of people who lived in different houses, 1% moved from abroad.
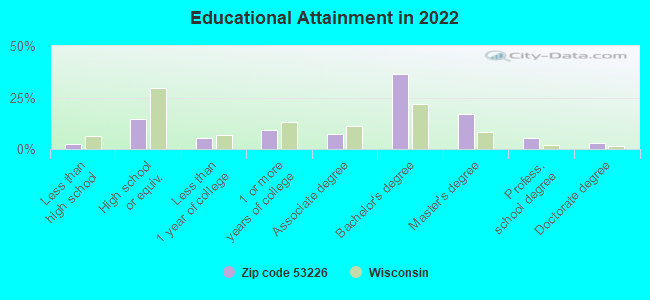
Private vs. public school enrollment:
Students in private schools in grades 1 to 8 (elementary and middle school): 387
Here:
31.1%
Wisconsin:
16.7%
Students in private schools in grades 9 to 12 (high school): 334
Here:
28.3%
Wisconsin:
12.5%
Students in private undergraduate colleges: 625
Here:
46.0%
Wisconsin:
17.5%
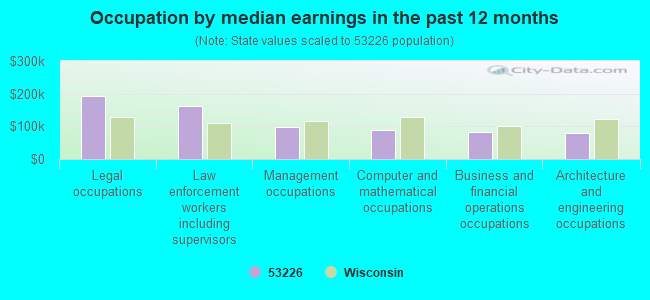
Occupation by median earnings in the past 12 months ($)
193,810Legal occupations
162,306Law enforcement workers including supervisors
98,022Management occupations
87,945Computer and mathematical occupations
83,426Business and financial operations occupations
79,001Architecture and engineering occupations
Companies with federal contracts located in this zip code (MILWAUKEE, WI):
T N & ASSOCIATES INC (1033 N MAYFAIR ROAD; small business) : $137,569,559 in 667 contractsfrom 1999 to 2006
Contracts for Maintenance, Repair or Alteration of Real Property -- Restoration of real property, Other Environmental Services, Studies, and Analytical Support, Maintenance, Repair or Alteration of Real Property -- Other Non-Building Facilities, Hazardous Substance Removal, Cleanup, and Disposal Services and Operational Support, and moreby U.S. Army Corps of Engineers - civil program financing only, Army, Navy, EPA, and others Signed by year:2000: $16,744,954; 2001: $16,039,914; 2002: $13,426,618; 2003: $23,444,018; 2004: $21,383,149; 2005: $33,918,298; 2006: $11,797,047.
Biggest contracts:
$5,000,000 with U.S. Army Corps of Engineers - civil program financing only for Maintenance, Repair or Alteration of Real Property -- Restoration of real property. Taking place in NJ. Signed on 2003-05-14. Completion date: 2003-04-30.
$4,995,306 with Army for Other Environmental Services, Studies, and Analytical Support. Taking place in OR. Signed on 2004-06-25. Completion date: 2006-12-31.
$3,947,592 with Navy for Maintenance, Repair or Alteration of Real Property -- Other Non-Building Facilities. Taking place in RI. Signed on 2005-07-29. Completion date: 2007-01-05.
$3,200,000 with U.S. Army Corps of Engineers - civil program financing only for Maintenance, Repair or Alteration of Real Property -- Restoration of real property. Taking place in NJ. Signed on 2002-09-05. Completion date: 2003-04-30.
MAROHL, HENRY R INC (10848 W WISCONSIN AVE; small business) : $129,328 in 4 contractsfrom 2003 to 2005
$76,915 with Army for Construction of Structures and Facilities -- Other Non-Building Facilities. Signed on 2003-12-02. Completion date: 2003-12-31.
$42,600 with Air Force for Demolition of Buildings. Signed on 2004-07-23. Completion date: 2004-09-28.
$5,817 with Army for Construction of Structures and Facilities -- Other Non-Building Facilities. Signed on 2004-02-11. Completion date: 2004-03-31.
$3,996 with Air Force for Demolition of Buildings. Signed on 2005-01-20. Completion date: 2004-12-23.
RADIO COMMUNICATION COMPANY IN (12323 W FAIRVIEW AVE; small business)
$18,544 with Army for Fire Fighting Equipment. Signed on 2002-07-11. Completion date: 2002-08-16.
BRASSWERKES, THE (1633 N 121ST ST; small business)
$5,300 with Army for Musical Instruments. Taking place in MD. Signed on 2005-06-15. Completion date: 2005-08-05.
TAYLOR VIDEO COMMUNICATIONS IN (818 N 109TH ST; small business)
$4,194 with Army for ADP Software. Signed on 2003-09-24. Completion date: 2003-10-24.
Top industries in this zip code by the number of employees in 2005:
Administrative and Support and Waste Management and Remediation Services: Temporary Help Services (500-999 employees: 1 establishment, 250-499 employees: 2 establishments, 100-249 employees: 4 establishments, 50-99 employees: 4 establishments, 20-49 employees: 8 establishments, 10-19 employees: 4 establishments, 5-9 employees: 2 establishments, 1-4 employees: 4 establishments)
Educational Services: Colleges, Universities, and Professional Schools (over 1000: 1, 500-999: 1, 5-9: 1, 1-4: 1)
Health Care and Social Assistance: Offices of Physicians (except Mental Health Specialists) (500-999: 1, 50-99: 4, 20-49: 6, 10-19: 8, 5-9: 19, 1-4: 44)
Health Care and Social Assistance: General Medical and Surgical Hospitals (over 1000: 1)
Health Care and Social Assistance: Psychiatric and Substance Abuse Hospitals (over 1000: 1)
Health Care and Social Assistance: Medical Laboratories (500-999: 1, 250-499: 1, 10-19: 1, 5-9: 1, 1-4: 1)
2002 - 2018 National Fire Incident Reporting System (NFIRS) incidents
According to the data from the years 2002 - 2018 the average number of fires per year is 20. The highest number of fire incidents - 44 took place in 2002, and the least - 0 in 2008. The data has a declining trend.
When looking into fire subcategories, the most reports belonged to: Structure Fires (35.5%), and Outside Fires (28.9%).
Fire incident types reported to NFIRS in Zip Code 53226


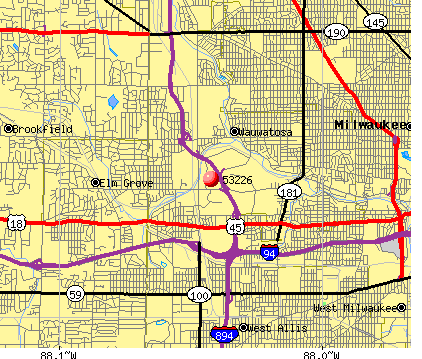 Nearest zip codes: 53222, 53213, 53214, 53122, 53227, 53005.


 According to the data from the years 2002 - 2018 the average number of fires per year is 20. The highest number of fire incidents - 44 took place in 2002, and the least - 0 in 2008. The data has a declining trend.
 When looking into fire subcategories, the most reports belonged to: Structure Fires (35.5%), and Outside Fires (28.9%).