Estimated zip code population in 2022: 27,247
Zip code population in 2010: 25,193
Zip code population in 2000: 25,721
Houses and condos: 11,551
Renter-occupied apartments: 2,479
% of renters here:
22%State:
32%
March 2022 cost of living index in zip code 53405: 94.7
(less than average, U.S. average is 100)
Land area: 6.5
sq. mi.
Water area: 0.1
sq. mi.
Population density: 4,187 people per square mile (average).
OSM Map
General Map
Google Map
MSN Map
OSM Map
General Map
Google Map
MSN Map
OSM Map
General Map
Google Map
MSN Map
OSM Map
General Map
Google Map
MSN Map
Please wait while loading the map...
Real estate property taxes paid for housing units in 2022:
This zip code:
2.0% ($3,522)Wisconsin:
1.4% ($3,497)
Median real estate property taxes paid for housing units with mortgages in 2022: $3,470 (2.0%)
Median real estate property taxes paid for housing units with no mortgage in 2022: $3,624 (2.1%)
Business Search - 14 Million verified businesses
Males: 12,521 Females: 14,722
For population 25 years and over in 53405:
High school or higher: 90.2%Bachelor's degree or higher: 28.4%Graduate or professional degree: 7.2%Unemployed: 2.9%Mean travel time to work (commute): 20.9 minutes
For population 15 years and over in 53405:
Never married: 37.5%Now married: 39.5%Separated: 1.1%Widowed: 7.2%Divorced: 14.7%
Zip code 53405 compared to state average:
Black race population percentage above state average. Hispanic race population percentage above state average. House age above state average. 17,341 63.7% White 4,889 17.9% Hispanic or Latino 3,371 12.4% Black 1,211 4.4% Two or more races 280 1.0% Asian 136 0.5% Some other race 16 0.06% American Indian
Data:
Median household income ($)
Median household income (% change since 2000)
Household income diversity
Ratio of average income to average house value (%)
Ratio of average income to average rent
Median household income ($) - White
Median household income ($) - Black or African American
Median household income ($) - Asian
Median household income ($) - Hispanic or Latino
Median household income ($) - American Indian and Alaska Native
Median household income ($) - Multirace
Median household income ($) - Other Race
Median household income for houses/condos with a mortgage ($)
Median household income for apartments without a mortgage ($)
Races - White alone (%)
Races - White alone (% change since 2000)
Races - Black alone (%)
Races - Black alone (% change since 2000)
Races - American Indian alone (%)
Races - American Indian alone (% change since 2000)
Races - Asian alone (%)
Races - Asian alone (% change since 2000)
Races - Hispanic (%)
Races - Hispanic (% change since 2000)
Races - Native Hawaiian and Other Pacific Islander alone (%)
Races - Native Hawaiian and Other Pacific Islander alone (% change since 2000)
Races - Two or more races (%)
Races - Two or more races (% change since 2000)
Races - Other race alone (%)
Races - Other race alone (% change since 2000)
Racial diversity
Unemployment (%)
Unemployment (% change since 2000)
Unemployment (%) - White
Unemployment (%) - Black or African American
Unemployment (%) - Asian
Unemployment (%) - Hispanic or Latino
Unemployment (%) - American Indian and Alaska Native
Unemployment (%) - Multirace
Unemployment (%) - Other Race
Population density (people per square mile)
Population - Males (%)
Population - Females (%)
Population - Males (%) - White
Population - Males (%) - Black or African American
Population - Males (%) - Asian
Population - Males (%) - Hispanic or Latino
Population - Males (%) - American Indian and Alaska Native
Population - Males (%) - Multirace
Population - Males (%) - Other Race
Population - Females (%) - White
Population - Females (%) - Black or African American
Population - Females (%) - Asian
Population - Females (%) - Hispanic or Latino
Population - Females (%) - American Indian and Alaska Native
Population - Females (%) - Multirace
Population - Females (%) - Other Race
Coronavirus confirmed cases (Apr 27, 2024)
Deaths caused by coronavirus (Apr 27, 2024)
Coronavirus confirmed cases (per 100k population) (Apr 27, 2024)
Deaths caused by coronavirus (per 100k population) (Apr 27, 2024)
Daily increase in number of cases (Apr 27, 2024)
Weekly increase in number of cases (Apr 27, 2024)
Cases doubled (in days) (Apr 27, 2024)
Hospitalized patients (Apr 18, 2022)
Negative test results (Apr 18, 2022)
Total test results (Apr 18, 2022)
COVID Vaccine doses distributed (per 100k population) (Sep 19, 2023)
COVID Vaccine doses administered (per 100k population) (Sep 19, 2023)
COVID Vaccine doses distributed (Sep 19, 2023)
COVID Vaccine doses administered (Sep 19, 2023)
Likely homosexual households (%)
Likely homosexual households (% change since 2000)
Likely homosexual households - Lesbian couples (%)
Likely homosexual households - Lesbian couples (% change since 2000)
Likely homosexual households - Gay men (%)
Likely homosexual households - Gay men (% change since 2000)
Cost of living index
Median gross rent ($)
Median contract rent ($)
Median monthly housing costs ($)
Median house or condo value ($)
Median house or condo value ($ change since 2000)
Mean house or condo value by units in structure - 1, detached ($)
Mean house or condo value by units in structure - 1, attached ($)
Mean house or condo value by units in structure - 2 ($)
Mean house or condo value by units in structure by units in structure - 3 or 4 ($)
Mean house or condo value by units in structure - 5 or more ($)
Mean house or condo value by units in structure - Boat, RV, van, etc. ($)
Mean house or condo value by units in structure - Mobile home ($)
Median house or condo value ($) - White
Median house or condo value ($) - Black or African American
Median house or condo value ($) - Asian
Median house or condo value ($) - Hispanic or Latino
Median house or condo value ($) - American Indian and Alaska Native
Median house or condo value ($) - Multirace
Median house or condo value ($) - Other Race
Median resident age
Resident age diversity
Median resident age - Males
Median resident age - Females
Median resident age - White
Median resident age - Black or African American
Median resident age - Asian
Median resident age - Hispanic or Latino
Median resident age - American Indian and Alaska Native
Median resident age - Multirace
Median resident age - Other Race
Median resident age - Males - White
Median resident age - Males - Black or African American
Median resident age - Males - Asian
Median resident age - Males - Hispanic or Latino
Median resident age - Males - American Indian and Alaska Native
Median resident age - Males - Multirace
Median resident age - Males - Other Race
Median resident age - Females - White
Median resident age - Females - Black or African American
Median resident age - Females - Asian
Median resident age - Females - Hispanic or Latino
Median resident age - Females - American Indian and Alaska Native
Median resident age - Females - Multirace
Median resident age - Females - Other Race
Commute - mean travel time to work (minutes)
Travel time to work - Less than 5 minutes (%)
Travel time to work - Less than 5 minutes (% change since 2000)
Travel time to work - 5 to 9 minutes (%)
Travel time to work - 5 to 9 minutes (% change since 2000)
Travel time to work - 10 to 19 minutes (%)
Travel time to work - 10 to 19 minutes (% change since 2000)
Travel time to work - 20 to 29 minutes (%)
Travel time to work - 20 to 29 minutes (% change since 2000)
Travel time to work - 30 to 39 minutes (%)
Travel time to work - 30 to 39 minutes (% change since 2000)
Travel time to work - 40 to 59 minutes (%)
Travel time to work - 40 to 59 minutes (% change since 2000)
Travel time to work - 60 to 89 minutes (%)
Travel time to work - 60 to 89 minutes (% change since 2000)
Travel time to work - 90 or more minutes (%)
Travel time to work - 90 or more minutes (% change since 2000)
Marital status - Never married (%)
Marital status - Now married (%)
Marital status - Separated (%)
Marital status - Widowed (%)
Marital status - Divorced (%)
Median family income ($)
Median family income (% change since 2000)
Median non-family income ($)
Median non-family income (% change since 2000)
Median per capita income ($)
Median per capita income (% change since 2000)
Median family income ($) - White
Median family income ($) - Black or African American
Median family income ($) - Asian
Median family income ($) - Hispanic or Latino
Median family income ($) - American Indian and Alaska Native
Median family income ($) - Multirace
Median family income ($) - Other Race
Median year house/condo built
Median year apartment built
Year house built - Built 2005 or later (%)
Year house built - Built 2000 to 2004 (%)
Year house built - Built 1990 to 1999 (%)
Year house built - Built 1980 to 1989 (%)
Year house built - Built 1970 to 1979 (%)
Year house built - Built 1960 to 1969 (%)
Year house built - Built 1950 to 1959 (%)
Year house built - Built 1940 to 1949 (%)
Year house built - Built 1939 or earlier (%)
Average household size
Household density (households per square mile)
Average household size - White
Average household size - Black or African American
Average household size - Asian
Average household size - Hispanic or Latino
Average household size - American Indian and Alaska Native
Average household size - Multirace
Average household size - Other Race
Occupied housing units (%)
Vacant housing units (%)
Owner occupied housing units (%)
Renter occupied housing units (%)
Vacancy status - For rent (%)
Vacancy status - For sale only (%)
Vacancy status - Rented or sold, not occupied (%)
Vacancy status - For seasonal, recreational, or occasional use (%)
Vacancy status - For migrant workers (%)
Vacancy status - Other vacant (%)
Residents with income below the poverty level (%)
Residents with income below 50% of the poverty level (%)
Children below poverty level (%)
Poor families by family type - Married-couple family (%)
Poor families by family type - Male, no wife present (%)
Poor families by family type - Female, no husband present (%)
Poverty status for native-born residents (%)
Poverty status for foreign-born residents (%)
Poverty among high school graduates not in families (%)
Poverty among people who did not graduate high school not in families (%)
Residents with income below the poverty level (%) - White
Residents with income below the poverty level (%) - Black or African American
Residents with income below the poverty level (%) - Asian
Residents with income below the poverty level (%) - Hispanic or Latino
Residents with income below the poverty level (%) - American Indian and Alaska Native
Residents with income below the poverty level (%) - Multirace
Residents with income below the poverty level (%) - Other Race
Air pollution - Air Quality Index (AQI)
Air pollution - CO
Air pollution - NO2
Air pollution - SO2
Air pollution - Ozone
Air pollution - PM10
Air pollution - PM25
Air pollution - Pb
Crime - Murders per 100,000 population
Crime - Rapes per 100,000 population
Crime - Robberies per 100,000 population
Crime - Assaults per 100,000 population
Crime - Burglaries per 100,000 population
Crime - Thefts per 100,000 population
Crime - Auto thefts per 100,000 population
Crime - Arson per 100,000 population
Crime - City-data.com crime index
Crime - Violent crime index
Crime - Property crime index
Crime - Murders per 100,000 population (5 year average)
Crime - Rapes per 100,000 population (5 year average)
Crime - Robberies per 100,000 population (5 year average)
Crime - Assaults per 100,000 population (5 year average)
Crime - Burglaries per 100,000 population (5 year average)
Crime - Thefts per 100,000 population (5 year average)
Crime - Auto thefts per 100,000 population (5 year average)
Crime - Arson per 100,000 population (5 year average)
Crime - City-data.com crime index (5 year average)
Crime - Violent crime index (5 year average)
Crime - Property crime index (5 year average)
1996 Presidential Elections Results (%) - Democratic Party (Clinton)
1996 Presidential Elections Results (%) - Republican Party (Dole)
1996 Presidential Elections Results (%) - Other
2000 Presidential Elections Results (%) - Democratic Party (Gore)
2000 Presidential Elections Results (%) - Republican Party (Bush)
2000 Presidential Elections Results (%) - Other
2004 Presidential Elections Results (%) - Democratic Party (Kerry)
2004 Presidential Elections Results (%) - Republican Party (Bush)
2004 Presidential Elections Results (%) - Other
2008 Presidential Elections Results (%) - Democratic Party (Obama)
2008 Presidential Elections Results (%) - Republican Party (McCain)
2008 Presidential Elections Results (%) - Other
2012 Presidential Elections Results (%) - Democratic Party (Obama)
2012 Presidential Elections Results (%) - Republican Party (Romney)
2012 Presidential Elections Results (%) - Other
2016 Presidential Elections Results (%) - Democratic Party (Clinton)
2016 Presidential Elections Results (%) - Republican Party (Trump)
2016 Presidential Elections Results (%) - Other
2020 Presidential Elections Results (%) - Democratic Party (Biden)
2020 Presidential Elections Results (%) - Republican Party (Trump)
2020 Presidential Elections Results (%) - Other
Ancestries Reported - Arab (%)
Ancestries Reported - Czech (%)
Ancestries Reported - Danish (%)
Ancestries Reported - Dutch (%)
Ancestries Reported - English (%)
Ancestries Reported - French (%)
Ancestries Reported - French Canadian (%)
Ancestries Reported - German (%)
Ancestries Reported - Greek (%)
Ancestries Reported - Hungarian (%)
Ancestries Reported - Irish (%)
Ancestries Reported - Italian (%)
Ancestries Reported - Lithuanian (%)
Ancestries Reported - Norwegian (%)
Ancestries Reported - Polish (%)
Ancestries Reported - Portuguese (%)
Ancestries Reported - Russian (%)
Ancestries Reported - Scotch-Irish (%)
Ancestries Reported - Scottish (%)
Ancestries Reported - Slovak (%)
Ancestries Reported - Subsaharan African (%)
Ancestries Reported - Swedish (%)
Ancestries Reported - Swiss (%)
Ancestries Reported - Ukrainian (%)
Ancestries Reported - United States (%)
Ancestries Reported - Welsh (%)
Ancestries Reported - West Indian (%)
Ancestries Reported - Other (%)
Educational Attainment - No schooling completed (%)
Educational Attainment - Less than high school (%)
Educational Attainment - High school or equivalent (%)
Educational Attainment - Less than 1 year of college (%)
Educational Attainment - 1 or more years of college (%)
Educational Attainment - Associate degree (%)
Educational Attainment - Bachelor's degree (%)
Educational Attainment - Master's degree (%)
Educational Attainment - Professional school degree (%)
Educational Attainment - Doctorate degree (%)
School Enrollment - Nursery, preschool (%)
School Enrollment - Kindergarten (%)
School Enrollment - Grade 1 to 4 (%)
School Enrollment - Grade 5 to 8 (%)
School Enrollment - Grade 9 to 12 (%)
School Enrollment - College undergrad (%)
School Enrollment - Graduate or professional (%)
School Enrollment - Not enrolled in school (%)
School enrollment - Public schools (%)
School enrollment - Private schools (%)
School enrollment - Not enrolled (%)
Median number of rooms in houses and condos
Median number of rooms in apartments
Housing units lacking complete plumbing facilities (%)
Housing units lacking complete kitchen facilities (%)
Density of houses
Urban houses (%)
Rural houses (%)
Households with people 60 years and over (%)
Households with people 65 years and over (%)
Households with people 75 years and over (%)
Households with one or more nonrelatives (%)
Households with no nonrelatives (%)
Population in households (%)
Family households (%)
Nonfamily households (%)
Population in families (%)
Family households with own children (%)
Median number of bedrooms in owner occupied houses
Mean number of bedrooms in owner occupied houses
Median number of bedrooms in renter occupied houses
Mean number of bedrooms in renter occupied houses
Median number of vehichles in owner occupied houses
Mean number of vehichles in owner occupied houses
Median number of vehichles in renter occupied houses
Mean number of vehichles in renter occupied houses
Mortgage status - with mortgage (%)
Mortgage status - with second mortgage (%)
Mortgage status - with home equity loan (%)
Mortgage status - with both second mortgage and home equity loan (%)
Mortgage status - without a mortgage (%)
Average family size
Average family size - White
Average family size - Black or African American
Average family size - Asian
Average family size - Hispanic or Latino
Average family size - American Indian and Alaska Native
Average family size - Multirace
Average family size - Other Race
Geographical mobility - Same house 1 year ago (%)
Geographical mobility - Moved within same county (%)
Geographical mobility - Moved from different county within same state (%)
Geographical mobility - Moved from different state (%)
Geographical mobility - Moved from abroad (%)
Place of birth - Born in state of residence (%)
Place of birth - Born in other state (%)
Place of birth - Native, outside of US (%)
Place of birth - Foreign born (%)
Housing units in structures - 1, detached (%)
Housing units in structures - 1, attached (%)
Housing units in structures - 2 (%)
Housing units in structures - 3 or 4 (%)
Housing units in structures - 5 to 9 (%)
Housing units in structures - 10 to 19 (%)
Housing units in structures - 20 to 49 (%)
Housing units in structures - 50 or more (%)
Housing units in structures - Mobile home (%)
Housing units in structures - Boat, RV, van, etc. (%)
House/condo owner moved in on average (years ago)
Renter moved in on average (years ago)
Year householder moved into unit - Moved in 1999 to March 2000 (%)
Year householder moved into unit - Moved in 1995 to 1998 (%)
Year householder moved into unit - Moved in 1990 to 1994 (%)
Year householder moved into unit - Moved in 1980 to 1989 (%)
Year householder moved into unit - Moved in 1970 to 1979 (%)
Year householder moved into unit - Moved in 1969 or earlier (%)
Means of transportation to work - Drove car alone (%)
Means of transportation to work - Carpooled (%)
Means of transportation to work - Public transportation (%)
Means of transportation to work - Bus or trolley bus (%)
Means of transportation to work - Streetcar or trolley car (%)
Means of transportation to work - Subway or elevated (%)
Means of transportation to work - Railroad (%)
Means of transportation to work - Ferryboat (%)
Means of transportation to work - Taxicab (%)
Means of transportation to work - Motorcycle (%)
Means of transportation to work - Bicycle (%)
Means of transportation to work - Walked (%)
Means of transportation to work - Other means (%)
Working at home (%)
Industry diversity
Most Common Industries - Agriculture, forestry, fishing and hunting, and mining (%)
Most Common Industries - Agriculture, forestry, fishing and hunting (%)
Most Common Industries - Mining, quarrying, and oil and gas extraction (%)
Most Common Industries - Construction (%)
Most Common Industries - Manufacturing (%)
Most Common Industries - Wholesale trade (%)
Most Common Industries - Retail trade (%)
Most Common Industries - Transportation and warehousing, and utilities (%)
Most Common Industries - Transportation and warehousing (%)
Most Common Industries - Utilities (%)
Most Common Industries - Information (%)
Most Common Industries - Finance and insurance, and real estate and rental and leasing (%)
Most Common Industries - Finance and insurance (%)
Most Common Industries - Real estate and rental and leasing (%)
Most Common Industries - Professional, scientific, and management, and administrative and waste management services (%)
Most Common Industries - Professional, scientific, and technical services (%)
Most Common Industries - Management of companies and enterprises (%)
Most Common Industries - Administrative and support and waste management services (%)
Most Common Industries - Educational services, and health care and social assistance (%)
Most Common Industries - Educational services (%)
Most Common Industries - Health care and social assistance (%)
Most Common Industries - Arts, entertainment, and recreation, and accommodation and food services (%)
Most Common Industries - Arts, entertainment, and recreation (%)
Most Common Industries - Accommodation and food services (%)
Most Common Industries - Other services, except public administration (%)
Most Common Industries - Public administration (%)
Occupation diversity
Most Common Occupations - Management, business, science, and arts occupations (%)
Most Common Occupations - Management, business, and financial occupations (%)
Most Common Occupations - Management occupations (%)
Most Common Occupations - Business and financial operations occupations (%)
Most Common Occupations - Computer, engineering, and science occupations (%)
Most Common Occupations - Computer and mathematical occupations (%)
Most Common Occupations - Architecture and engineering occupations (%)
Most Common Occupations - Life, physical, and social science occupations (%)
Most Common Occupations - Education, legal, community service, arts, and media occupations (%)
Most Common Occupations - Community and social service occupations (%)
Most Common Occupations - Legal occupations (%)
Most Common Occupations - Education, training, and library occupations (%)
Most Common Occupations - Arts, design, entertainment, sports, and media occupations (%)
Most Common Occupations - Healthcare practitioners and technical occupations (%)
Most Common Occupations - Health diagnosing and treating practitioners and other technical occupations (%)
Most Common Occupations - Health technologists and technicians (%)
Most Common Occupations - Service occupations (%)
Most Common Occupations - Healthcare support occupations (%)
Most Common Occupations - Protective service occupations (%)
Most Common Occupations - Fire fighting and prevention, and other protective service workers including supervisors (%)
Most Common Occupations - Law enforcement workers including supervisors (%)
Most Common Occupations - Food preparation and serving related occupations (%)
Most Common Occupations - Building and grounds cleaning and maintenance occupations (%)
Most Common Occupations - Personal care and service occupations (%)
Most Common Occupations - Sales and office occupations (%)
Most Common Occupations - Sales and related occupations (%)
Most Common Occupations - Office and administrative support occupations (%)
Most Common Occupations - Natural resources, construction, and maintenance occupations (%)
Most Common Occupations - Farming, fishing, and forestry occupations (%)
Most Common Occupations - Construction and extraction occupations (%)
Most Common Occupations - Installation, maintenance, and repair occupations (%)
Most Common Occupations - Production, transportation, and material moving occupations (%)
Most Common Occupations - Production occupations (%)
Most Common Occupations - Transportation occupations (%)
Most Common Occupations - Material moving occupations (%)
People in Group quarters - Institutionalized population (%)
People in Group quarters - Correctional institutions (%)
People in Group quarters - Federal prisons and detention centers (%)
People in Group quarters - Halfway houses (%)
People in Group quarters - Local jails and other confinement facilities (including police lockups) (%)
People in Group quarters - Military disciplinary barracks (%)
People in Group quarters - State prisons (%)
People in Group quarters - Other types of correctional institutions (%)
People in Group quarters - Nursing homes (%)
People in Group quarters - Hospitals/wards, hospices, and schools for the handicapped (%)
People in Group quarters - Hospitals/wards and hospices for chronically ill (%)
People in Group quarters - Hospices or homes for chronically ill (%)
People in Group quarters - Military hospitals or wards for chronically ill (%)
People in Group quarters - Other hospitals or wards for chronically ill (%)
People in Group quarters - Hospitals or wards for drug/alcohol abuse (%)
People in Group quarters - Mental (Psychiatric) hospitals or wards (%)
People in Group quarters - Schools, hospitals, or wards for the mentally retarded (%)
People in Group quarters - Schools, hospitals, or wards for the physically handicapped (%)
People in Group quarters - Institutions for the deaf (%)
People in Group quarters - Institutions for the blind (%)
People in Group quarters - Orthopedic wards and institutions for the physically handicapped (%)
People in Group quarters - Wards in general hospitals for patients who have no usual home elsewhere (%)
People in Group quarters - Wards in military hospitals for patients who have no usual home elsewhere (%)
People in Group quarters - Juvenile institutions (%)
People in Group quarters - Long-term care (%)
People in Group quarters - Homes for abused, dependent, and neglected children (%)
People in Group quarters - Residential treatment centers for emotionally disturbed children (%)
People in Group quarters - Training schools for juvenile delinquents (%)
People in Group quarters - Short-term care, detention or diagnostic centers for delinquent children (%)
People in Group quarters - Type of juvenile institution unknown (%)
People in Group quarters - Noninstitutionalized population (%)
People in Group quarters - College dormitories (includes college quarters off campus) (%)
People in Group quarters - Military quarters (%)
People in Group quarters - On base (%)
People in Group quarters - Barracks, unaccompanied personnel housing (UPH), (Enlisted/Officer), ;and similar group living quarters for military personnel (%)
People in Group quarters - Transient quarters for temporary residents (%)
People in Group quarters - Military ships (%)
People in Group quarters - Group homes (%)
People in Group quarters - Homes or halfway houses for drug/alcohol abuse (%)
People in Group quarters - Homes for the mentally ill (%)
People in Group quarters - Homes for the mentally retarded (%)
People in Group quarters - Homes for the physically handicapped (%)
People in Group quarters - Other group homes (%)
People in Group quarters - Religious group quarters (%)
People in Group quarters - Dormitories (%)
People in Group quarters - Agriculture workers' dormitories on farms (%)
People in Group quarters - Job Corps and vocational training facilities (%)
People in Group quarters - Other workers' dormitories (%)
People in Group quarters - Crews of maritime vessels (%)
People in Group quarters - Other nonhousehold living situations (%)
People in Group quarters - Other noninstitutional group quarters (%)
Residents speaking English at home (%)
Residents speaking English at home - Born in the United States (%)
Residents speaking English at home - Native, born elsewhere (%)
Residents speaking English at home - Foreign born (%)
Residents speaking Spanish at home (%)
Residents speaking Spanish at home - Born in the United States (%)
Residents speaking Spanish at home - Native, born elsewhere (%)
Residents speaking Spanish at home - Foreign born (%)
Residents speaking other language at home (%)
Residents speaking other language at home - Born in the United States (%)
Residents speaking other language at home - Native, born elsewhere (%)
Residents speaking other language at home - Foreign born (%)
Class of Workers - Employee of private company (%)
Class of Workers - Self-employed in own incorporated business (%)
Class of Workers - Private not-for-profit wage and salary workers (%)
Class of Workers - Local government workers (%)
Class of Workers - State government workers (%)
Class of Workers - Federal government workers (%)
Class of Workers - Self-employed workers in own not incorporated business and Unpaid family workers (%)
House heating fuel used in houses and condos - Utility gas (%)
House heating fuel used in houses and condos - Bottled, tank, or LP gas (%)
House heating fuel used in houses and condos - Electricity (%)
House heating fuel used in houses and condos - Fuel oil, kerosene, etc. (%)
House heating fuel used in houses and condos - Coal or coke (%)
House heating fuel used in houses and condos - Wood (%)
House heating fuel used in houses and condos - Solar energy (%)
House heating fuel used in houses and condos - Other fuel (%)
House heating fuel used in houses and condos - No fuel used (%)
House heating fuel used in apartments - Utility gas (%)
House heating fuel used in apartments - Bottled, tank, or LP gas (%)
House heating fuel used in apartments - Electricity (%)
House heating fuel used in apartments - Fuel oil, kerosene, etc. (%)
House heating fuel used in apartments - Coal or coke (%)
House heating fuel used in apartments - Wood (%)
House heating fuel used in apartments - Solar energy (%)
House heating fuel used in apartments - Other fuel (%)
House heating fuel used in apartments - No fuel used (%)
Armed forces status - In Armed Forces (%)
Armed forces status - Civilian (%)
Armed forces status - Civilian - Veteran (%)
Armed forces status - Civilian - Nonveteran (%)
Fatal accidents locations in years 2005-2021
Fatal accidents locations in 2005
Fatal accidents locations in 2006
Fatal accidents locations in 2007
Fatal accidents locations in 2008
Fatal accidents locations in 2009
Fatal accidents locations in 2010
Fatal accidents locations in 2011
Fatal accidents locations in 2012
Fatal accidents locations in 2013
Fatal accidents locations in 2014
Fatal accidents locations in 2015
Fatal accidents locations in 2016
Fatal accidents locations in 2017
Fatal accidents locations in 2018
Fatal accidents locations in 2019
Fatal accidents locations in 2020
Fatal accidents locations in 2021
Alcohol use - People drinking some alcohol every month (%)
Alcohol use - People not drinking at all (%)
Alcohol use - Average days/month drinking alcohol
Alcohol use - Average drinks/week
Alcohol use - Average days/year people drink much
Audiometry - Average condition of hearing (%)
Audiometry - People that can hear a whisper from across a quiet room (%)
Audiometry - People that can hear normal voice from across a quiet room (%)
Audiometry - Ears ringing, roaring, buzzing (%)
Audiometry - Had a job exposure to loud noise (%)
Audiometry - Had off-work exposure to loud noise (%)
Blood Pressure & Cholesterol - Has high blood pressure (%)
Blood Pressure & Cholesterol - Checking blood pressure at home (%)
Blood Pressure & Cholesterol - Frequently checking blood cholesterol (%)
Blood Pressure & Cholesterol - Has high cholesterol level (%)
Consumer Behavior - Money monthly spent on food at supermarket/grocery store
Consumer Behavior - Money monthly spent on food at other stores
Consumer Behavior - Money monthly spent on eating out
Consumer Behavior - Money monthly spent on carryout/delivered foods
Consumer Behavior - Income spent on food at supermarket/grocery store (%)
Consumer Behavior - Income spent on food at other stores (%)
Consumer Behavior - Income spent on eating out (%)
Consumer Behavior - Income spent on carryout/delivered foods (%)
Current Health Status - General health condition (%)
Current Health Status - Blood donors (%)
Current Health Status - Has blood ever tested for HIV virus (%)
Current Health Status - Left-handed people (%)
Dermatology - People using sunscreen (%)
Diabetes - Diabetics (%)
Diabetes - Had a blood test for high blood sugar (%)
Diabetes - People taking insulin (%)
Diet Behavior & Nutrition - Diet health (%)
Diet Behavior & Nutrition - Milk product consumption (# of products/month)
Diet Behavior & Nutrition - Meals not home prepared (#/week)
Diet Behavior & Nutrition - Meals from fast food or pizza place (#/week)
Diet Behavior & Nutrition - Ready-to-eat foods (#/month)
Diet Behavior & Nutrition - Frozen meals/pizza (#/month)
Drug Use - People that ever used marijuana or hashish (%)
Drug Use - Ever used hard drugs (%)
Drug Use - Ever used any form of cocaine (%)
Drug Use - Ever used heroin (%)
Drug Use - Ever used methamphetamine (%)
Health Insurance - People covered by health insurance (%)
Kidney Conditions-Urology - Avg. # of times urinating at night
Medical Conditions - People with asthma (%)
Medical Conditions - People with anemia (%)
Medical Conditions - People with psoriasis (%)
Medical Conditions - People with overweight (%)
Medical Conditions - Elderly people having difficulties in thinking or remembering (%)
Medical Conditions - People who ever received blood transfusion (%)
Medical Conditions - People having trouble seeing even with glass/contacts (%)
Medical Conditions - People with arthritis (%)
Medical Conditions - People with gout (%)
Medical Conditions - People with congestive heart failure (%)
Medical Conditions - People with coronary heart disease (%)
Medical Conditions - People with angina pectoris (%)
Medical Conditions - People who ever had heart attack (%)
Medical Conditions - People who ever had stroke (%)
Medical Conditions - People with emphysema (%)
Medical Conditions - People with thyroid problem (%)
Medical Conditions - People with chronic bronchitis (%)
Medical Conditions - People with any liver condition (%)
Medical Conditions - People who ever had cancer or malignancy (%)
Mental Health - People who have little interest in doing things (%)
Mental Health - People feeling down, depressed, or hopeless (%)
Mental Health - People who have trouble sleeping or sleeping too much (%)
Mental Health - People feeling tired or having little energy (%)
Mental Health - People with poor appetite or overeating (%)
Mental Health - People feeling bad about themself (%)
Mental Health - People who have trouble concentrating on things (%)
Mental Health - People moving or speaking slowly or too fast (%)
Mental Health - People having thoughts they would be better off dead (%)
Oral Health - Average years since last visit a dentist
Oral Health - People embarrassed because of mouth (%)
Oral Health - People with gum disease (%)
Oral Health - General health of teeth and gums (%)
Oral Health - Average days a week using dental floss/device
Oral Health - Average days a week using mouthwash for dental problem
Oral Health - Average number of teeth
Pesticide Use - Households using pesticides to control insects (%)
Pesticide Use - Households using pesticides to kill weeds (%)
Physical Activity - People doing vigorous-intensity work activities (%)
Physical Activity - People doing moderate-intensity work activities (%)
Physical Activity - People walking or bicycling (%)
Physical Activity - People doing vigorous-intensity recreational activities (%)
Physical Activity - People doing moderate-intensity recreational activities (%)
Physical Activity - Average hours a day doing sedentary activities
Physical Activity - Average hours a day watching TV or videos
Physical Activity - Average hours a day using computer
Physical Functioning - People having limitations keeping them from working (%)
Physical Functioning - People limited in amount of work they can do (%)
Physical Functioning - People that need special equipment to walk (%)
Physical Functioning - People experiencing confusion/memory problems (%)
Physical Functioning - People requiring special healthcare equipment (%)
Prescription Medications - Average number of prescription medicines taking
Preventive Aspirin Use - Adults 40+ taking low-dose aspirin (%)
Reproductive Health - Vaginal deliveries (%)
Reproductive Health - Cesarean deliveries (%)
Reproductive Health - Deliveries resulted in a live birth (%)
Reproductive Health - Pregnancies resulted in a delivery (%)
Reproductive Health - Women breastfeeding newborns (%)
Reproductive Health - Women that had a hysterectomy (%)
Reproductive Health - Women that had both ovaries removed (%)
Reproductive Health - Women that have ever taken birth control pills (%)
Reproductive Health - Women taking birth control pills (%)
Reproductive Health - Women that have ever used Depo-Provera or injectables (%)
Reproductive Health - Women that have ever used female hormones (%)
Sexual Behavior - People 18+ that ever had sex (vaginal, anal, or oral) (%)
Sexual Behavior - Males 18+ that ever had vaginal sex with a woman (%)
Sexual Behavior - Males 18+ that ever performed oral sex on a woman (%)
Sexual Behavior - Males 18+ that ever had anal sex with a woman (%)
Sexual Behavior - Males 18+ that ever had any sex with a man (%)
Sexual Behavior - Females 18+ that ever had vaginal sex with a man (%)
Sexual Behavior - Females 18+ that ever performed oral sex on a man (%)
Sexual Behavior - Females 18+ that ever had anal sex with a man (%)
Sexual Behavior - Females 18+ that ever had any kind of sex with a woman (%)
Sexual Behavior - Average age people first had sex
Sexual Behavior - Average number of female sex partners in lifetime (males 18+)
Sexual Behavior - Average number of female vaginal sex partners in lifetime (males 18+)
Sexual Behavior - Average age people first performed oral sex on a woman (18+)
Sexual Behavior - Average number of woman performed oral sex on in lifetime (18+)
Sexual Behavior - Average number of male sex partners in lifetime (males 18+)
Sexual Behavior - Average number of male anal sex partners in lifetime (males 18+)
Sexual Behavior - Average age people first performed oral sex on a man (18+)
Sexual Behavior - Average number of male oral sex partners in lifetime (18+)
Sexual Behavior - People using protection when performing oral sex (%)
Sexual Behavior - Average number of times people have vaginal or anal sex a year
Sexual Behavior - People having sex without condom (%)
Sexual Behavior - Average number of male sex partners in lifetime (females 18+)
Sexual Behavior - Average number of male vaginal sex partners in lifetime (females 18+)
Sexual Behavior - Average number of female sex partners in lifetime (females 18+)
Sexual Behavior - Circumcised males 18+ (%)
Sleep Disorders - Average hours sleeping at night
Sleep Disorders - People that has trouble sleeping (%)
Smoking-Cigarette Use - People smoking cigarettes (%)
Taste & Smell - People 40+ having problems with smell (%)
Taste & Smell - People 40+ having problems with taste (%)
Taste & Smell - People 40+ that ever had wisdom teeth removed (%)
Taste & Smell - People 40+ that ever had tonsils teeth removed (%)
Taste & Smell - People 40+ that ever had a loss of consciousness because of a head injury (%)
Taste & Smell - People 40+ that ever had a broken nose or other serious injury to face or skull (%)
Taste & Smell - People 40+ that ever had two or more sinus infections (%)
Weight - Average height (inches)
Weight - Average weight (pounds)
Weight - Average BMI
Weight - People that are obese (%)
Weight - People that ever were obese (%)
Weight - People trying to lose weight (%)
100%
urban population.
Estimated median house/condo value in 2022: $173,595
53405:
$173,595Wisconsin:
$252,800
According to our research of Wisconsin and other state lists, there were 76 registered sex offenders living in 53405 zip code as of April 26, 2024 . The ratio of all residents to sex offenders in zip code 53405 is 336 to 1.The ratio of registered sex offenders to all residents in this zip code is near the state average.
Median resident age: This zip code:
37.1 yearsWisconsin median age:
40.4 years
Average household size: This zip code:
2.4 peopleWisconsin:
2.3 people
Averages for the 2020 tax year for zip code 53405, filed in 2021:
Average Adjusted Gross Income (AGI) in 2020: $51,028 (Individual Income Tax Returns) Here:
$51,028State:
$72,319
Salary/wage: $44,630 (reported on 84.0% of returns )Here:
$44,630State:
$59,242
(% of AGI for various income ranges: 1224.9% for AGIs below $25k , 3754.3% for AGIs $25k-50k , 6553.0% for AGIs $50k-75k , 9613.8% for AGIs $75k-100k , 16052.0% for AGIs $100k-200k , 67473.3% for AGIs over 200k ) Taxable interest for individuals: $672 (reported on 31.0% of returns )This zip code:
$672Wisconsin:
$1,431
(% of AGI for various income ranges: 9.4% for AGIs below $25k , 13.0% for AGIs $25k-50k , 21.0% for AGIs $50k-75k , 47.3% for AGIs $75k-100k , 110.3% for AGIs $100k-200k , 863.3% for AGIs over 200k ) Ordinary dividends: $5,219 (reported on 13.7% of returns )(% of AGI for various income ranges: 17.1% for AGIs below $25k , 24.7% for AGIs $25k-50k , 44.7% for AGIs $50k-75k , 132.8% for AGIs $75k-100k , 375.5% for AGIs $100k-200k , 5910.0% for AGIs over 200k ) Net capital gain/loss in AGI: +$11,143 (reported on 11.7% of returns )Here:
+$11,143State:
+$18,329
(% of AGI for various income ranges: 4.3% for AGIs below $25k , 14.3% for AGIs $25k-50k , 51.2% for AGIs $50k-75k , 158.7% for AGIs $75k-100k , 653.9% for AGIs $100k-200k , 16108.3% for AGIs over 200k ) Profit/loss from business: +$9,867 (reported on 9.1% of returns )Here:
+$9,867State:
+$14,562
(% of AGI for various income ranges: 47.5% for AGIs below $25k , 58.9% for AGIs $25k-50k , 85.0% for AGIs $50k-75k , 224.7% for AGIs $75k-100k , 479.0% for AGIs $100k-200k , 2886.7% for AGIs over 200k ) Taxable individual retirement arrangement distribution: $19,280 (reported on 10.0% of returns )53405:
$19,280Wisconsin:
$19,348
(% of AGI for various income ranges: 68.6% for AGIs below $25k , 96.7% for AGIs $25k-50k , 253.8% for AGIs $50k-75k , 418.4% for AGIs $75k-100k , 1336.3% for AGIs $100k-200k , 5081.7% for AGIs over 200k ) Total itemized deductions: $24,984 (reported on 4.5% of returns )Here:
$24,984State:
$33,000
(% of AGI for various income ranges: 28.2% for AGIs below $25k , 64.1% for AGIs $25k-50k , 180.4% for AGIs $50k-75k , 301.9% for AGIs $75k-100k , 558.7% for AGIs $100k-200k , 4045.0% for AGIs over 200k ) Charity contributions: $8,624 (reported on 3.1% of returns )(% of AGI for various income ranges: 2.6% for AGIs below $25k , 8.1% for AGIs $25k-50k , 31.4% for AGIs $50k-75k , 60.6% for AGIs $75k-100k , 144.5% for AGIs $100k-200k , 2015.0% for AGIs over 200k ) Taxes paid: $7,847 (reported on 4.4% of returns )(% of AGI for various income ranges: 6.0% for AGIs below $25k , 13.6% for AGIs $25k-50k , 65.4% for AGIs $50k-75k , 116.5% for AGIs $75k-100k , 193.9% for AGIs $100k-200k , 901.7% for AGIs over 200k ) Earned income credit: $2,352 (reported on 18.4% of returns )(% of AGI for various income ranges: 105.2% for AGIs below $25k , 66.9% for AGIs $25k-50k , 1.2% for AGIs $50k-75k ) Percentage of individuals using paid preparers for their 2020 taxes: 93.9%(% for various income ranges: 93.1% for AGIs below $25k , 94.7% for AGIs $25k-50k , 94.3% for AGIs $50k-75k , 93.2% for AGIs $75k-100k , 93.6% for AGIs $100k-200k , 94.7% for AGIs over 200k )
Averages for the 2012 tax year for zip code 53405, filed in 2013:
Average Adjusted Gross Income (AGI) in 2012: $46,309 (Individual Income Tax Returns) Here:
$46,309State:
$57,939
Salary/wage: $40,492 (reported on 85.0% of returns )Here:
$40,492State:
$48,248
(% of AGI for various income ranges: 73.8% for AGIs below $25k , 81.9% for AGIs $25k-50k , 78.4% for AGIs $50k-75k , 78.2% for AGIs $75k-100k , 75.9% for AGIs $100k-200k , 46.0% for AGIs over 200k ) Taxable interest for individuals: $866 (reported on 39.4% of returns )This zip code:
$866Wisconsin:
$1,224
(% of AGI for various income ranges: 0.8% for AGIs below $25k , 0.4% for AGIs $25k-50k , 0.5% for AGIs $50k-75k , 0.5% for AGIs $75k-100k , 0.5% for AGIs $100k-200k , 2.3% for AGIs over 200k ) Ordinary dividends: $4,055 (reported on 16.6% of returns )(% of AGI for various income ranges: 1.4% for AGIs below $25k , 0.7% for AGIs $25k-50k , 0.7% for AGIs $50k-75k , 1.2% for AGIs $75k-100k , 1.8% for AGIs $100k-200k , 4.0% for AGIs over 200k ) Net capital gain/loss in AGI: +$7,526 (reported on 10.9% of returns )Here:
+$7,526State:
+$11,137
(% of AGI for various income ranges: 0.4% for AGIs $50k-75k , 0.4% for AGIs $75k-100k , 1.2% for AGIs $100k-200k , 12.2% for AGIs over 200k ) Profit/loss from business: +$11,094 (reported on 8.8% of returns )Here:
+$11,094State:
+$11,943
(% of AGI for various income ranges: 4.4% for AGIs below $25k , 1.0% for AGIs $25k-50k , 1.6% for AGIs $50k-75k , 1.6% for AGIs $75k-100k , 1.5% for AGIs $100k-200k , 4.4% for AGIs over 200k ) Taxable individual retirement arrangement distribution: $14,260 (reported on 11.1% of returns )53405:
$14,260Wisconsin:
$14,087
(% of AGI for various income ranges: 4.0% for AGIs below $25k , 2.8% for AGIs $25k-50k , 3.1% for AGIs $50k-75k , 3.9% for AGIs $75k-100k , 3.9% for AGIs $100k-200k , 3.1% for AGIs over 200k ) Self-employment retirement plans: $14,350 (reported on 0.2% of returns )53405:
$14,350Wisconsin:
$17,048
Total itemized deductions: $18,045 (21% of AGI, reported on 33.0% of returns )Here:
$18,045State:
$22,257
Here:
21.5% of AGIState:
20.1% of AGI
(% of AGI for various income ranges: 8.8% for AGIs below $25k , 10.5% for AGIs $25k-50k , 13.8% for AGIs $50k-75k , 14.2% for AGIs $75k-100k , 15.1% for AGIs $100k-200k , 13.5% for AGIs over 200k ) Charity contributions: $2,771 (reported on 26.2% of returns )(% of AGI for various income ranges: 0.8% for AGIs below $25k , 1.0% for AGIs $25k-50k , 1.6% for AGIs $50k-75k , 1.8% for AGIs $75k-100k , 2.0% for AGIs $100k-200k , 2.2% for AGIs over 200k ) Taxes paid: $8,628 (reported on 33.0% of returns )53405:
$8,628State:
$10,731
(% of AGI for various income ranges: 2.8% for AGIs below $25k , 4.4% for AGIs $25k-50k , 6.1% for AGIs $50k-75k , 6.9% for AGIs $75k-100k , 8.3% for AGIs $100k-200k , 7.7% for AGIs over 200k ) Earned income credit: $2,292 (reported on 20.2% of returns )(% of AGI for various income ranges: 7.0% for AGIs below $25k , 1.1% for AGIs $25k-50k ) Percentage of individuals using paid preparers for their 2012 taxes: 48.0%(% for various income ranges: 44.6% for AGIs below $25k , 47.6% for AGIs $25k-50k , 49.5% for AGIs $50k-75k , 52.6% for AGIs $75k-100k , 54.3% for AGIs $100k-200k , 85.7% for AGIs over 200k )
Averages for the 2004 tax year for zip code 53405, filed in 2005:
Average Adjusted Gross Income (AGI) in 2004: $42,787 (Individual Income Tax Returns) Here:
$42,787State:
$47,735
Salary/wage: $38,363 (reported on 87.9% of returns )Here:
$38,363State:
$41,540
(% of AGI for various income ranges: 103.7% for AGIs below $10k , 75.7% for AGIs $10k-25k , 84.5% for AGIs $25k-50k , 83.6% for AGIs $50k-75k , 84.6% for AGIs $75k-100k , 64.7% for AGIs over 100k ) Taxable interest for individuals: $1,038 (reported on 48.3% of returns )This zip code:
$1,038Wisconsin:
$1,420
(% of AGI for various income ranges: 4.5% for AGIs below $10k , 1.9% for AGIs $10k-25k , 0.8% for AGIs $25k-50k , 0.8% for AGIs $50k-75k , 0.7% for AGIs $75k-100k , 1.6% for AGIs over 100k ) Taxable dividends: $2,269 (reported on 22.4% of returns )(% of AGI for various income ranges: 3.3% for AGIs below $10k , 1.4% for AGIs $10k-25k , 0.7% for AGIs $25k-50k , 0.7% for AGIs $50k-75k , 0.8% for AGIs $75k-100k , 2.1% for AGIs over 100k ) Net capital gain/loss: +$7,230 (reported on 15.8% of returns )Here:
+$7,230State:
+$9,569
(% of AGI for various income ranges: -0.6% for AGIs below $10k , 0.5% for AGIs $10k-25k , 0.5% for AGIs $25k-50k , 0.7% for AGIs $50k-75k , 0.9% for AGIs $75k-100k , 8.7% for AGIs over 100k ) Profit/loss from business: +$10,057 (reported on 8.8% of returns )Here:
+$10,057State:
+$10,417
(% of AGI for various income ranges: 1.7% for AGIs below $10k , 2.4% for AGIs $10k-25k , 1.1% for AGIs $25k-50k , 1.5% for AGIs $50k-75k , 1.4% for AGIs $75k-100k , 3.8% for AGIs over 100k ) IRA payment deduction: $2,601 (reported on 1.9% of returns )53405:
$2,601Wisconsin:
$2,900
(% of AGI for various income ranges: 0.2% for AGIs $10k-25k , 0.2% for AGIs $25k-50k , 0.1% for AGIs $50k-75k , 0.1% for AGIs $75k-100k , 0.1% for AGIs over 100k ) Self-employed pension: $14,750 (reported on 0.3% of returns )Here:
$14,750Wisconsin:
$11,934
Total itemized deductions: $15,139 (21% of AGI, reported on 39.9% of returns )Here:
$15,139State:
$18,160
Here:
21.2% of AGIState:
21.1% of AGI
(% of AGI for various income ranges: 10.2% for AGIs below $10k , 9.5% for AGIs $10k-25k , 13.1% for AGIs $25k-50k , 15.6% for AGIs $50k-75k , 16.0% for AGIs $75k-100k , 14.4% for AGIs over 100k ) Charity contributions deductions: $2,351 (3% of AGI, reported on 33.9% of returns )Here:
3.1% of AGIState:
3.0% of AGI
(% of AGI for various income ranges: 0.9% for AGIs below $10k , 1.0% for AGIs $10k-25k , 1.4% for AGIs $25k-50k , 1.9% for AGIs $50k-75k , 1.9% for AGIs $75k-100k , 2.6% for AGIs over 100k ) Total tax: $5,661 (reported on 75.9% of returns )(% of AGI for various income ranges: 2.0% for AGIs below $10k , 3.9% for AGIs $10k-25k , 6.6% for AGIs $25k-50k , 8.6% for AGIs $50k-75k , 10.2% for AGIs $75k-100k , 17.4% for AGIs over 100k ) Earned income credit: $1,633 (reported on 13.8% of returns )Percentage of individuals using paid preparers for their 2004 taxes: 54.7%(% for various income ranges: 45.5% for AGIs below $10k , 55.7% for AGIs $10k-25k , 57.3% for AGIs $25k-50k , 55.5% for AGIs $50k-75k , 53.9% for AGIs $75k-100k , 63.9% for AGIs over 100k )
Estimated median household income in 2022: This zip code:
$62,495Wisconsin:
$70,996
Nearest zip codes: 53404 ,
53406 ,
53403 ,
53402 ,
53140 ,
53177 .
Racine Zip Code Map
Percentage of family households: This zip code:
46.5%Wisconsin:
43.1%
Percentage of households with unmarried partners: This zip code:
7.2%Wisconsin:
47.0%
Likely homosexual households (counted as self-reported same-sex unmarried-partner households)
Lesbian couples: 0.0% of all households Gay men: 0.3% of all households
Household received Food Stamps/SNAP in the past 12 months: 1,391Household did not receive Food Stamps/SNAP in the past 12 months: 9,821
Women who had a birth in the past 12 months: 126 (47 now married , 78 unmarried) Women who did not have a birth in the past 12 months: 6,753 (2,236 now married , 4,516 unmarried)
Housing units in zip code 53405 with a mortgage: 5,723 (536
second mortgage , 19
home equity loan , 429
both second mortgage and home equity loan )
Houses without a mortgage: 544
Median monthly owner costs for units with a mortgage: $1,276
Median monthly owner costs for units without a mortgage: $600
Residents with income below the poverty level in 2022:
This zip code:
10.5%Whole state:
10.7%
Residents with income below 50% of the poverty level in 2022:
This zip code:
4.1%Whole state:
5.7%
Median number of rooms in houses and condos: Median number of rooms in apartments: Notable locations in this zip code not listed on our city pages
Click to draw/clear zip code borders Notable locations in zip code 53405: (A) , Racine Country Club (B) , Horlick Mill (C) , Medix Ambulance Service (D) , Racine Fire Department Station 9 (E) , Racine Fire Department Station 7 (F) . Display/hide their locations on the map
Shopping Centers: (1) , Elmwood Plaza Shopping Center (2) , Badger Plaza Shopping Center (3) . Display/hide their locations on the map
Cemeteries: (1) , Calvary Cemetery (2) , Mound Cemetery (3) , Graceland Cemetery (4) . Display/hide their locations on the map
Parks in zip code 53405 include: (1) , Humble Park (2) , Reservoir Park (3) , Solbran Park (4) , Armstrong Park (5) , Elmwood Park (6) , Pierce Grove Park (7) , Washington Park (8) . Display/hide their locations on the map
Year house built (houses)
0 2020 or later205 2010 to 2019165 2000 to 2009292 1990 to 1999478 1980 to 19891,548 1970 to 19791,844 1960 to 19692,571 1950 to 19591,235 1940 to 19492,977 1939 or earlier
Zip code 53405 household income distribution in 2022 393 Less than $10,000251 $10,000 to $14,999493 $15,000 to $19,999350 $20,000 to $24,999189 $25,000 to $29,999476 $30,000 to $34,999488 $35,000 to $39,999457 $40,000 to $44,999829 $45,000 to $49,9991,372 $50,000 to $59,9991,497 $60,000 to $74,9991,621 $75,000 to $99,999846 $100,000 to $124,999927 $125,000 to $149,999626 $150,000 to $199,999386 $200,000 or moreEstimate of home value of owner-occupied houses/condos in 2022 in zip code 53405 17 Less than $10,00042 $10,000 to $14,99976 $15,000 to $19,99943 $35,000 to $39,999179 $40,000 to $49,9999 $50,000 to $59,9996 $60,000 to $69,999139 $70,000 to $79,999409 $80,000 to $89,999166 $90,000 to $99,9991,008 $100,000 to $124,9991,016 $125,000 to $149,9991,792 $150,000 to $174,999487 $175,000 to $199,999999 $200,000 to $249,999611 $250,000 to $299,999629 $300,000 to $399,999169 $400,000 to $499,999113 $500,000 to $749,999107 $750,000 to $999,99928 $2,000,000 or moreRent paid by renters in 2022 in zip code 53405 65 $200 to $24924 $250 to $29947 $300 to $3496 $350 to $399174 $400 to $44913 $450 to $49975 $500 to $54942 $550 to $599291 $600 to $649224 $650 to $699154 $700 to $749141 $750 to $799484 $800 to $899164 $900 to $999380 $1,000 to $1,24986 $1,250 to $1,49960 $1,500 to $1,99980 No cash rent
Median gross rent in 2022: $976.
Median price asked for vacant for-sale houses and condos in 2022: $111,779.
Estimated median house (or condo) value in 2022 for: White Non-Hispanic householders: $173,595Black or African American householders: $161,812American Indian or Alaska Native householders: $173,987Asian householders: $117,039Native Hawaiian and other Pacific Islander householders: $220,921Some other race householders: $153,564Hispanic or Latino householders: $162,598Estimated median house or condo value in 2022: $173,595
53405:
$173,595Wisconsin:
$252,800
Lower value quartile - upper value quartile: $129,733 - $236,382
Mean price in 2022: Detached houses: $159,313Here:
$159,313State:
$308,468
Townhouses or other attached units: $255,665Here:
$255,665State:
$265,873
In 2-unit structures: $125,679Here:
$125,679State:
$203,667
In 3-to-4-unit structures: $51,977Here:
$51,977State:
$216,833
In 5-or-more-unit structures: $53,568Here:
$53,568State:
$280,537
Mobile homes: $130,745Here:
$130,745State:
$79,042
Housing units in structures:
One, detached: 9,037One, attached: 538Two: 8143 or 4: 2805 to 9: 30510 to 19: 8520 to 49: 22150 or more: 158Mobile homes: 67Unemployment : 2.9%
Means of transportation to work in zip code 53405 74.4% 10,002 Drove a car alone12.2% 1,639 Carpooled0.6% 75 Bus or trolley bus0.0% 1 Subway or elevated0.1% 7 Motorcycle0.0% 3 Bicycle1.2% 164 Walked3.2% 436 Other means7.5% 1,013 Worked at homeTravel time to work (commute) in zip code 53405 312 Less than 5 minutes1,974 5 to 9 minutes2,658 10 to 14 minutes2,183 15 to 19 minutes1,601 20 to 24 minutes892 25 to 29 minutes1,016 30 to 34 minutes298 35 to 39 minutes296 40 to 44 minutes437 45 to 59 minutes321 60 to 89 minutes258 90 or more minutes
Percentage of zip code residents living and working in this county: 72.5%
Household type by relationship:
Households: 27,247
Male householders: 4,947 (1,556 living alone ), Female householders: 6,268 (2,159 living alone )4,062 spouses (3,959 opposite-sex spouses ), 1,466 unmarried partners , (1,448 opposite-sex unmarried partners ), 8,359 children (7,486 natural , 247 adopted , 636 stepchildren ), 359 grandchildren , 264 brothers or sisters , 182 parents , 20 foster children , 526 other relatives , 677 non-relatives In group quarters: 125 (-1 institutionalized population )
Size of family households: 2,973 2-persons , 1,730 3-persons , 1,045 4-persons , 535 5-persons , 251 6-persons , 271 7-or-more-persons
Size of nonfamily households: 3,717 1-person , 547 2-persons , 51 3-persons , 6 4-persons , 39 5-persons , 9 7-or-more-persons
2,881 married couples with children. single-parent households (685 men , 2,348 women ).
89.7% of residents of 53405 zip code speak English at home. of residents speak Spanish at home (74% very well, 14% well, 7% not well, 4% not at all ).of residents speak other Indo-European language at home (83% very well, 12% well, 5% not well ).of residents speak Asian or Pacific Island language at home (85% very well, 15% well ).of residents speak other language at home (73% very well, 27% well ).
Foreign born population: 1,254 (4.6%)
(47.0%
of them are naturalized citizens )
This zip code:
4.6%Whole state:
5.0%
59% Honduras 7% Malaysia 6% El Salvador 2% North Macedonia (Macedonia) 2% Bhutan 2% Taiwan 2% Guatemala 19% German 6% Irish 4% Polish 3% English 3% Italian 2% American 2% Danish
Year of entry for the foreign-born population
425 2010 or later 303 2000 to 2009 527 1990 to 1999 401 Before 1990
There are
315 Other Medical Specialists in Zip Code 53405.
Facilities with environmental interests located in this zip code:
ALL SAINTS MED GRP-ST MARY-KURTEN MED-NW AVE (2405 NORTHWESTERN AVE in RACINE, WI)
Small Quantity Generators, between 100 kg and 1000 kg of hazardous waste/month (Resource Conservation and Recovery Act (tracking hazardous waste)) - notification STATE MASTER (Wisconsin database) - RCRAINFO-WIR000010728, CESQG Organizations: SAINT MARYS MEDICAL CENTER (CONTACT/OWNER)
Alternative names: KURTEN MEDICAL CAMPUS
ACTUANT CORP AT FLEXFAB MOLDED PRODUCTS (1914 INDIANA ST in RACINE, WI)
Large Quantity Generators, more that 1000 kg of hazardous waste/month (Resource Conservation and Recovery Act (tracking hazardous waste)) Business NAICS classification: ALL OTHER RUBBER PRODUCT MANUFACTURING.Organizations: FM REALTY LLC (CONTACT/OWNER)
CLAUSEN MOTOR SALES INC (2042 LATHROP AVE in RACINE, WI)
(Resource Conservation and Recovery Act (tracking hazardous waste)) Organizations: CLAUSEN HOWARD J (CONTACT/OWNER)
BEERE PRECISION PROD (2711 LATHROP AVE in RACINE, WI)
(Resource Conservation and Recovery Act (tracking hazardous waste))
Housing units lacking complete plumbing facilities: 0.1%
Housing units lacking complete kitchen facilities: 0.6%
81.4% Utility gas 13.1% Electricity 2.9% Fuel oil, kerosene, etc. 1.7% Bottled, tank, or LP gas 0.7% Wood
Population in 1990: 26,652.
Place of birth for U.S.-born residents:
This state: 19,597Northeast: 359Midwest: 3,142South: 1,399West: 1,059
61% of the 53405 zip code residents lived in the same house 5 years ago.
Out of people who lived in different houses, 72% lived in this county.
Out of people who lived in different counties, 50% lived in Wisconsin.
89% of the 53405 zip code residents lived in the same house 1 year ago.
Out of people who lived in different houses, 64% moved from this county.
Out of people who lived in different houses, 26% moved from different county within same state.
Out of people who lived in different houses, 2% moved from different state.
Out of people who lived in different houses, 6% moved from abroad.
Private vs. public school enrollment:
Students in private schools in grades 1 to 8 (elementary and middle school): 717
Here:
23.5%Wisconsin:
16.7%
Students in private schools in grades 9 to 12 (high school): 145
Students in private undergraduate colleges: 75
Occupation by median earnings in the past 12 months ($)
99,327 Computer and mathematical occupations 76,018 Business and financial operations occupations 71,411 Management occupations 70,235 Law enforcement workers including supervisors 65,403 Life, physical, and social science occupations 59,544 Architecture and engineering occupations
Companies with federal contracts located in this zip code:
BROOM SERVICE INC (505 HAYES AVENUE in RACINE, WI; small business) in 9 contracts from 2000 to 2003
Contracts for Custodial Janitorial Services by ArmySigned by year: 2000: $7,050; 2001: $7,500; 2002: $8,100; 2003: $4,650; 2004: $0; 2005: $0; 2006: $0.
Biggest contracts: with Army for Custodial Janitorial Services. Signed on 2003-11-24. Completion date: 2004-09-30.
, same as above. Signed on 2002-11-21. Completion date: 2004-09-30.
, same as above. Signed on 2001-11-19. Completion date: 2004-09-30.
, same as above. Signed on 2000-12-06. Completion date: 2004-09-30.
H V A C OF WISCONSIN INC (4320 LINDERMANN AVE in RACINE, WI; small business) in 3 contracts from 2002 to 2003
$7,700 with Army for Construction of Structures and Facilities -- Maintenance Buildings. Signed on 2003-06-11. Completion date: 2003-06-12.
with Army for Maintenance, Repair or Alteration of Real Property -- Heating and Cooling Plants. Signed on 2002-07-03. Completion date: 2002-07-15.
with Army for Construction of Structures and Facilities -- Maintenance Buildings. Signed on 2003-06-11. Completion date: 2003-06-12.
MJI, INC (3701 DURAND AVENUE SUITE 4 in RACINE, WI; small business) in 2 contracts in 2003
$9,000 with Army for Custodial Janitorial Services. Signed on 2003-02-10. Completion date: 2004-02-29.
, same as above. Signed on 2003-02-10. Completion date: 2004-02-29.
Top industries in this zip code by the number of employees in 2005:
Health Care and Social Assistance: General Medical and Surgical Hospitals (over 1000 employees: 1 establishment)Health Care and Social Assistance: Offices of Physicians (except Mental Health Specialists) (500-999: 1, 20-49: 4, 10-19: 2, 5-9: 1, 1-4: 10)Accommodation and Food Services: Limited-Service Restaurants (50-99: 4, 20-49: 2, 10-19: 3, 5-9: 2, 1-4: 2)Other Services (except Public Administration): Religious Organizations (50-99: 1, 20-49: 2, 10-19: 5, 5-9: 4, 1-4: 6)Administrative and Support and Waste Management and Remediation Services: Temporary Help Services (100-249: 1, 50-99: 1)Accommodation and Food Services: Full-Service Restaurants (20-49: 5, 10-19: 3)Construction: Plumbing, Heating, and Air-Conditioning Contractors (50-99: 1, 20-49: 1, 10-19: 1, 1-4: 2)
People in group quarters in 2010:
4 people in correctional residential facilities
4 people in group homes intended for adults
People in group quarters in 2000:
26 people in other noninstitutional group quarters
8 people in homes for the mentally retarded
6 people in homes for the mentally ill
4 people in homes or halfway houses for drug/alcohol abuse
2 people in religious group quarters
Fatal accident statistics in 2014:
Fatal accident count: 1Vehicles involved in fatal accidents: 2Fatal accidents caused by drunken drivers: 0Fatalities: 1Persons involved in fatal accidents: 2Pedestrians involved in fatal accidents: 0
Fatal accident statistics in 2013:
Fatal accident count: 1Vehicles involved in fatal accidents: 1Fatal accidents caused by drunken drivers: 0Fatalities: 1Persons involved in fatal accidents: 1Pedestrians involved in fatal accidents: 1
Home Mortgage Disclosure Act Aggregated Statistics For Year 2009(Based on 3 full and 14 partial tracts) A) FHA, FSA/RHS & VA B) Conventional C) Refinancings D) Home Improvement Loans E) Loans on Dwellings For 5+ Families F) Non-occupant Loans on G) Loans On Manufactured Number Average Value Number Average Value Number Average Value Number Average Value Number Average Value Number Average Value Number Average Value
LOANS ORIGINATED 187 $105,541 198 $90,706 1,307 $115,862 58 $59,643 0 $0 132 $92,746 0 $0 APPLICATIONS APPROVED, NOT ACCEPTED 4 $82,265 5 $162,684 122 $119,982 14 $40,421 0 $0 8 $106,526 0 $0 APPLICATIONS DENIED 27 $98,699 38 $92,378 382 $119,869 64 $44,239 1 $780,470 25 $104,217 1 $154,550 APPLICATIONS WITHDRAWN 9 $139,389 13 $117,901 197 $117,769 12 $25,936 0 $0 9 $87,442 0 $0 FILES CLOSED FOR INCOMPLETENESS 1 $95,330 1 $69,100 58 $116,828 1 $8,670 0 $0 3 $65,790 0 $0
Aggregated Statistics For Year 2008(Based on 3 full and 14 partial tracts) A) FHA, FSA/RHS & VA B) Conventional C) Refinancings D) Home Improvement Loans E) Loans on Dwellings For 5+ Families F) Non-occupant Loans on G) Loans On Manufactured Number Average Value Number Average Value Number Average Value Number Average Value Number Average Value Number Average Value Number Average Value
LOANS ORIGINATED 149 $123,243 235 $114,943 799 $119,308 90 $45,795 5 $342,640 120 $137,482 0 $0 APPLICATIONS APPROVED, NOT ACCEPTED 1 $136,020 25 $112,927 111 $105,264 19 $17,769 0 $0 14 $85,533 0 $0 APPLICATIONS DENIED 21 $125,094 62 $93,203 436 $119,250 138 $30,778 0 $0 35 $104,323 4 $36,022 APPLICATIONS WITHDRAWN 9 $116,403 21 $102,314 162 $139,213 15 $53,224 0 $0 23 $179,044 0 $0 FILES CLOSED FOR INCOMPLETENESS 3 $109,480 3 $137,597 40 $117,368 6 $36,468 0 $0 0 $0 0 $0
Aggregated Statistics For Year 2007(Based on 3 full and 14 partial tracts) A) FHA, FSA/RHS & VA B) Conventional C) Refinancings D) Home Improvement Loans E) Loans on Dwellings For 5+ Families F) Non-occupant Loans on G) Loans On Manufactured Number Average Value Number Average Value Number Average Value Number Average Value Number Average Value Number Average Value Number Average Value
LOANS ORIGINATED 95 $130,506 499 $112,004 998 $107,625 114 $41,620 4 $537,050 189 $109,453 3 $24,543 APPLICATIONS APPROVED, NOT ACCEPTED 6 $141,133 43 $111,978 174 $99,895 36 $31,449 0 $0 21 $106,890 0 $0 APPLICATIONS DENIED 11 $127,072 69 $111,158 721 $117,486 105 $38,570 2 $942,470 42 $111,292 1 $51,000 APPLICATIONS WITHDRAWN 8 $112,088 31 $122,406 306 $111,335 16 $57,974 0 $0 10 $115,781 0 $0 FILES CLOSED FOR INCOMPLETENESS 0 $0 12 $130,785 103 $121,485 5 $43,470 0 $0 2 $158,980 0 $0
Aggregated Statistics For Year 2006(Based on 3 full and 14 partial tracts) A) FHA, FSA/RHS & VA B) Conventional C) Refinancings D) Home Improvement Loans E) Loans on Dwellings For 5+ Families F) Non-occupant Loans on G) Loans On Manufactured Number Average Value Number Average Value Number Average Value Number Average Value Number Average Value Number Average Value Number Average Value
LOANS ORIGINATED 126 $125,150 797 $97,906 1,103 $106,876 122 $43,810 6 $718,185 179 $110,948 0 $0 APPLICATIONS APPROVED, NOT ACCEPTED 5 $112,058 90 $96,497 182 $109,044 29 $39,668 1 $556,180 29 $108,644 0 $0 APPLICATIONS DENIED 5 $132,510 191 $95,591 784 $107,671 126 $26,738 1 $1,031,590 45 $98,661 1 $137,610 APPLICATIONS WITHDRAWN 15 $131,258 114 $100,535 472 $109,979 26 $85,305 1 $1,452,930 27 $94,104 0 $0 FILES CLOSED FOR INCOMPLETENESS 1 $131,000 19 $100,789 162 $120,165 4 $65,175 0 $0 7 $96,917 1 $131,000
Aggregated Statistics For Year 2005(Based on 3 full and 14 partial tracts) A) FHA, FSA/RHS & VA B) Conventional C) Refinancings D) Home Improvement Loans E) Loans on Dwellings For 5+ Families F) Non-occupant Loans on G) Loans On Manufactured Number Average Value Number Average Value Number Average Value Number Average Value Number Average Value Number Average Value Number Average Value
LOANS ORIGINATED 164 $122,626 918 $98,365 1,563 $98,912 148 $37,529 15 $640,530 270 $99,658 3 $38,080 APPLICATIONS APPROVED, NOT ACCEPTED 4 $108,905 82 $96,866 146 $102,637 24 $24,772 0 $0 20 $84,682 0 $0 APPLICATIONS DENIED 13 $118,079 156 $92,993 865 $102,691 148 $36,770 0 $0 53 $108,576 5 $55,244 APPLICATIONS WITHDRAWN 31 $127,537 120 $98,198 503 $107,743 54 $102,560 1 $943,730 40 $83,597 0 $0 FILES CLOSED FOR INCOMPLETENESS 7 $129,540 32 $113,131 371 $116,732 3 $40,353 0 $0 14 $93,177 0 $0
Aggregated Statistics For Year 2004(Based on 3 full and 14 partial tracts) A) FHA, FSA/RHS & VA B) Conventional C) Refinancings D) Home Improvement Loans E) Loans on Dwellings For 5+ Families F) Non-occupant Loans on G) Loans On Manufactured Number Average Value Number Average Value Number Average Value Number Average Value Number Average Value Number Average Value Number Average Value
LOANS ORIGINATED 200 $113,814 780 $101,928 1,582 $95,652 134 $46,835 7 $609,997 230 $88,667 5 $44,574 APPLICATIONS APPROVED, NOT ACCEPTED 6 $97,520 64 $93,558 198 $91,020 38 $35,278 0 $0 23 $90,404 1 $6,930 APPLICATIONS DENIED 29 $108,904 135 $89,179 765 $88,046 168 $28,852 0 $0 57 $71,239 6 $31,030 APPLICATIONS WITHDRAWN 20 $105,984 87 $96,658 369 $94,530 18 $38,712 1 $270,330 34 $80,306 0 $0 FILES CLOSED FOR INCOMPLETENESS 8 $95,709 11 $92,576 302 $99,477 9 $58,068 0 $0 12 $64,987 0 $0
Aggregated Statistics For Year 2003(Based on 3 full and 14 partial tracts) A) FHA, FSA/RHS & VA B) Conventional C) Refinancings D) Home Improvement Loans E) Loans on Dwellings For 5+ Families F) Non-occupant Loans on Number Average Value Number Average Value Number Average Value Number Average Value Number Average Value Number Average Value
LOANS ORIGINATED 211 $101,006 673 $98,283 2,802 $87,131 103 $14,266 10 $636,726 248 $86,563 APPLICATIONS APPROVED, NOT ACCEPTED 11 $95,545 39 $102,978 211 $84,249 23 $11,992 0 $0 25 $89,356 APPLICATIONS DENIED 17 $97,011 83 $90,954 866 $86,268 108 $13,745 0 $0 53 $60,384 APPLICATIONS WITHDRAWN 9 $104,693 80 $95,638 364 $92,541 13 $31,250 0 $0 25 $76,122 FILES CLOSED FOR INCOMPLETENESS 6 $83,747 26 $92,820 118 $86,408 3 $21,370 0 $0 4 $46,838
Aggregated Statistics For Year 2002(Based on 3 full and 14 partial tracts) A) FHA, FSA/RHS & VA B) Conventional C) Refinancings D) Home Improvement Loans E) Loans on Dwellings For 5+ Families F) Non-occupant Loans on Number Average Value Number Average Value Number Average Value Number Average Value Number Average Value Number Average Value
LOANS ORIGINATED 251 $92,064 583 $93,339 2,053 $89,264 131 $16,885 8 $1,464,492 191 $97,798 APPLICATIONS APPROVED, NOT ACCEPTED 2 $155,100 36 $87,811 201 $86,217 25 $11,059 0 $0 13 $79,434 APPLICATIONS DENIED 7 $69,920 58 $90,181 636 $80,486 114 $9,764 0 $0 30 $60,683 APPLICATIONS WITHDRAWN 9 $110,000 64 $107,085 266 $84,960 31 $24,625 0 $0 21 $73,053 FILES CLOSED FOR INCOMPLETENESS 11 $98,050 13 $76,182 155 $110,652 2 $13,070 0 $0 4 $61,670
Aggregated Statistics For Year 2001(Based on 3 full and 14 partial tracts) A) FHA, FSA/RHS & VA B) Conventional C) Refinancings D) Home Improvement Loans E) Loans on Dwellings For 5+ Families F) Non-occupant Loans on Number Average Value Number Average Value Number Average Value Number Average Value Number Average Value Number Average Value
LOANS ORIGINATED 295 $88,585 549 $88,229 1,841 $78,010 162 $14,420 16 $622,864 158 $67,113 APPLICATIONS APPROVED, NOT ACCEPTED 8 $92,524 23 $79,505 162 $75,812 15 $12,577 2 $456,085 4 $82,150 APPLICATIONS DENIED 15 $102,133 92 $69,983 573 $67,109 133 $13,388 2 $446,210 34 $64,420 APPLICATIONS WITHDRAWN 11 $78,670 46 $72,030 316 $78,504 28 $19,200 0 $0 16 $55,591 FILES CLOSED FOR INCOMPLETENESS 8 $88,588 10 $80,334 80 $75,171 5 $18,280 0 $0 1 $99,210
Aggregated Statistics For Year 2000(Based on 3 full and 14 partial tracts) A) FHA, FSA/RHS & VA B) Conventional C) Refinancings D) Home Improvement Loans E) Loans on Dwellings For 5+ Families F) Non-occupant Loans on Number Average Value Number Average Value Number Average Value Number Average Value Number Average Value Number Average Value
LOANS ORIGINATED 212 $80,374 484 $84,173 488 $60,851 184 $12,311 6 $416,877 84 $62,685 APPLICATIONS APPROVED, NOT ACCEPTED 9 $90,406 36 $77,496 134 $69,640 56 $19,265 0 $0 18 $78,188 APPLICATIONS DENIED 20 $83,911 95 $71,315 385 $61,391 182 $13,179 1 $891,970 39 $66,626 APPLICATIONS WITHDRAWN 7 $85,189 35 $66,989 138 $68,306 39 $23,818 0 $0 4 $64,578 FILES CLOSED FOR INCOMPLETENESS 4 $78,318 6 $97,305 64 $128,688 2 $16,825 0 $0 3 $68,853
Aggregated Statistics For Year 1999(Based on 2 full and 7 partial tracts) A) FHA, FSA/RHS & VA B) Conventional C) Refinancings D) Home Improvement Loans E) Loans on Dwellings For 5+ Families F) Non-occupant Loans on Number Average Value Number Average Value Number Average Value Number Average Value Number Average Value Number Average Value
LOANS ORIGINATED 133 $80,944 303 $82,617 493 $64,830 128 $12,457 2 $691,440 69 $57,829 APPLICATIONS APPROVED, NOT ACCEPTED 1 $39,920 17 $56,909 80 $62,547 24 $13,312 0 $0 9 $54,699 APPLICATIONS DENIED 8 $64,972 33 $67,512 219 $61,499 70 $12,356 1 $663,480 13 $47,885 APPLICATIONS WITHDRAWN 14 $70,606 29 $79,629 132 $65,497 31 $38,803 0 $0 7 $87,336 FILES CLOSED FOR INCOMPLETENESS 2 $86,110 14 $70,396 48 $83,317 2 $1,255,120 0 $0 3 $70,410
Private Mortgage Insurance Companies Aggregated Statistics For Year 2009(Based on 3 full and 14 partial tracts) A) Conventional B) Refinancings Number Average Value Number Average Value
LOANS ORIGINATED 40 $115,286 32 $148,077 APPLICATIONS APPROVED, NOT ACCEPTED 3 $110,563 7 $157,800 APPLICATIONS DENIED 3 $138,477 9 $140,576 APPLICATIONS WITHDRAWN 0 $0 1 $306,770 FILES CLOSED FOR INCOMPLETENESS 2 $69,755 1 $141,760
Aggregated Statistics For Year 2008(Based on 3 full and 14 partial tracts) A) Conventional B) Refinancings C) Non-occupant Loans on Number Average Value Number Average Value Number Average Value
LOANS ORIGINATED 108 $119,884 59 $136,039 11 $90,890 APPLICATIONS APPROVED, NOT ACCEPTED 10 $133,159 28 $128,842 0 $0 APPLICATIONS DENIED 5 $94,236 2 $131,110 0 $0 APPLICATIONS WITHDRAWN 3 $114,210 3 $140,480 0 $0 FILES CLOSED FOR INCOMPLETENESS 1 $156,000 3 $138,217 3 $137,173
Aggregated Statistics For Year 2007(Based on 3 full and 14 partial tracts) A) Conventional B) Refinancings C) Non-occupant Loans on Number Average Value Number Average Value Number Average Value
LOANS ORIGINATED 203 $130,295 109 $134,498 10 $111,719 APPLICATIONS APPROVED, NOT ACCEPTED 24 $117,049 20 $144,996 3 $132,050 APPLICATIONS DENIED 1 $102,260 0 $0 0 $0 APPLICATIONS WITHDRAWN 11 $127,652 5 $139,104 0 $0 FILES CLOSED FOR INCOMPLETENESS 1 $65,000 0 $0 0 $0
Aggregated Statistics For Year 2006(Based on 3 full and 14 partial tracts) A) Conventional B) Refinancings C) Non-occupant Loans on Number Average Value Number Average Value Number Average Value
LOANS ORIGINATED 168 $121,689 68 $138,080 17 $96,245 APPLICATIONS APPROVED, NOT ACCEPTED 19 $113,274 28 $146,540 7 $182,181 APPLICATIONS DENIED 5 $62,486 2 $167,085 0 $0 APPLICATIONS WITHDRAWN 7 $100,283 12 $157,838 5 $124,918 FILES CLOSED FOR INCOMPLETENESS 0 $0 0 $0 0 $0
Aggregated Statistics For Year 2005(Based on 3 full and 14 partial tracts) A) Conventional B) Refinancings C) Non-occupant Loans on Number Average Value Number Average Value Number Average Value
LOANS ORIGINATED 200 $125,883 91 $119,205 15 $100,365 APPLICATIONS APPROVED, NOT ACCEPTED 23 $136,806 14 $135,710 1 $131,000 APPLICATIONS DENIED 3 $108,070 1 $116,520 1 $115,350 APPLICATIONS WITHDRAWN 14 $122,933 2 $151,820 0 $0 FILES CLOSED FOR INCOMPLETENESS 2 $105,770 1 $113,520 0 $0
Aggregated Statistics For Year 2004(Based on 3 full and 14 partial tracts) A) Conventional B) Refinancings C) Non-occupant Loans on Number Average Value Number Average Value Number Average Value
LOANS ORIGINATED 238 $113,864 97 $115,411 23 $87,963 APPLICATIONS APPROVED, NOT ACCEPTED 25 $117,795 26 $129,115 0 $0 APPLICATIONS DENIED 5 $87,172 2 $153,045 0 $0 APPLICATIONS WITHDRAWN 11 $118,687 9 $95,581 3 $101,423 FILES CLOSED FOR INCOMPLETENESS 6 $115,885 0 $0 0 $0
Aggregated Statistics For Year 2003(Based on 3 full and 14 partial tracts) A) Conventional B) Refinancings C) Non-occupant Loans on Number Average Value Number Average Value Number Average Value
LOANS ORIGINATED 259 $104,040 253 $100,111 34 $86,553 APPLICATIONS APPROVED, NOT ACCEPTED 29 $104,020 31 $106,365 3 $98,583 APPLICATIONS DENIED 0 $0 2 $119,560 2 $119,560 APPLICATIONS WITHDRAWN 10 $117,046 11 $102,015 1 $153,940 FILES CLOSED FOR INCOMPLETENESS 0 $0 0 $0 0 $0
Aggregated Statistics For Year 2002(Based on 3 full and 14 partial tracts) A) Conventional B) Refinancings C) Non-occupant Loans on Number Average Value Number Average Value Number Average Value
LOANS ORIGINATED 214 $96,485 194 $102,667 28 $79,972 APPLICATIONS APPROVED, NOT ACCEPTED 21 $118,453 18 $96,560 0 $0 APPLICATIONS DENIED 2 $77,510 3 $64,733 1 $68,460 APPLICATIONS WITHDRAWN 9 $108,604 10 $89,784 4 $59,930 FILES CLOSED FOR INCOMPLETENESS 0 $0 0 $0 0 $0
Aggregated Statistics For Year 2001(Based on 3 full and 14 partial tracts) A) Conventional B) Refinancings C) Non-occupant Loans on Number Average Value Number Average Value Number Average Value
LOANS ORIGINATED 183 $90,815 174 $97,377 17 $68,836 APPLICATIONS APPROVED, NOT ACCEPTED 16 $104,498 22 $93,842 4 $104,730 APPLICATIONS DENIED 3 $87,377 6 $104,357 1 $125,520 APPLICATIONS WITHDRAWN 5 $84,326 5 $95,226 0 $0 FILES CLOSED FOR INCOMPLETENESS 0 $0 3 $89,307 0 $0
Aggregated Statistics For Year 2000(Based on 3 full and 14 partial tracts) A) Conventional B) Refinancings C) Non-occupant Loans on Number Average Value Number Average Value Number Average Value
LOANS ORIGINATED 197 $85,797 35 $88,655 13 $58,834 APPLICATIONS APPROVED, NOT ACCEPTED 12 $84,140 4 $86,272 0 $0 APPLICATIONS DENIED 3 $76,353 2 $77,000 1 $63,260 APPLICATIONS WITHDRAWN 4 $56,275 4 $77,282 1 $44,200 FILES CLOSED FOR INCOMPLETENESS 0 $0 0 $0 0 $0
Aggregated Statistics For Year 1999(Based on 2 full and 7 partial tracts) A) Conventional B) Refinancings C) Non-occupant Loans on Number Average Value Number Average Value Number Average Value
LOANS ORIGINATED 126 $80,725 44 $80,500 7 $61,293 APPLICATIONS APPROVED, NOT ACCEPTED 9 $75,624 7 $74,846 1 $98,280 APPLICATIONS DENIED 4 $83,598 1 $88,390 1 $97,280 APPLICATIONS WITHDRAWN 2 $97,820 5 $96,132 0 $0 FILES CLOSED FOR INCOMPLETENESS 0 $0 0 $0 0 $0
2002 - 2018 National Fire Incident Reporting System (NFIRS) incidents See full 2006 National Fire Incident Reporting System statistics for zip code 53405, Wisconsin
Most common first names in zip code 53405 among deceased individuals Name Count Lived (average)
John 212 76.8 years Mary 182 79.3 years William 146 75.0 years Robert 136 71.3 years Edward 112 76.1 years George 107 77.0 years James 107 73.6 years Frank 98 79.1 years Dorothy 97 76.4 years Helen 92 81.1 years
Most common last names in zip code 53405 among deceased individuals Last name Count Lived (average)
Johnson 117 79.9 years Jensen 101 81.5 years Nelson 98 79.4 years Hansen 93 79.8 years Christensen 80 77.8 years Anderson 70 73.6 years Peterson 56 74.8 years Andersen 52 76.9 years Petersen 50 79.8 years Olson 46 81.0 years
Businesses in zip code 53405
Name Count Name Count
CVS 1 McDonald's 1 Curves 1 Subway 2 Dairy Queen 1 U-Haul 1 FedEx 2 UPS 1 H&R Block 1 Walgreens 1 La-Z-Boy 1 World Gym 1 Little Caesars Pizza 1
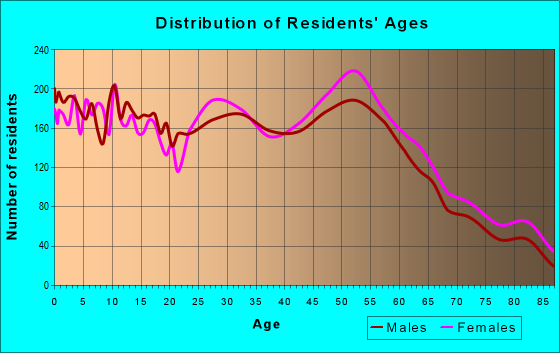
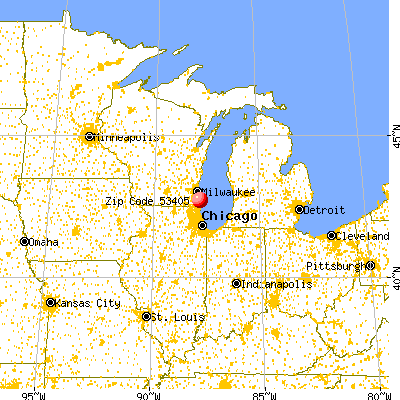

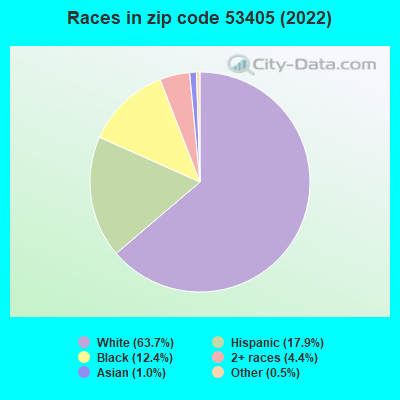


 Nearest zip codes: 53404, 53406, 53403, 53402, 53140, 53177.
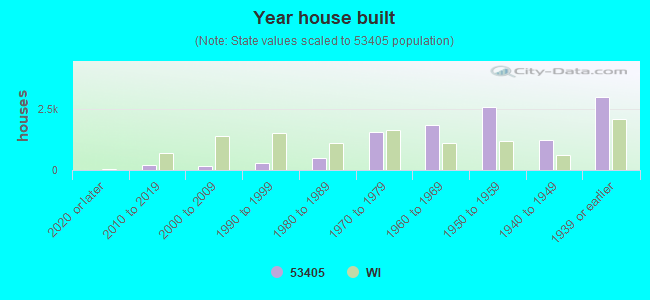
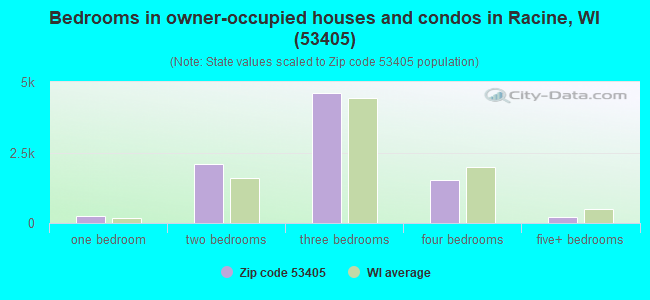
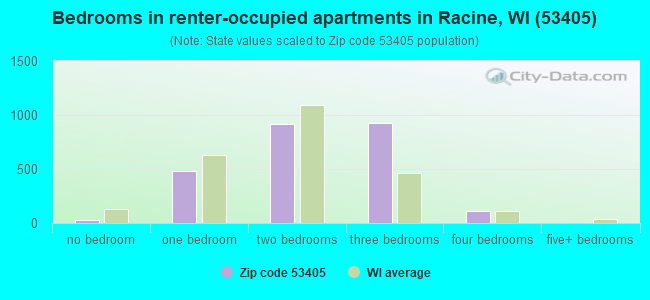
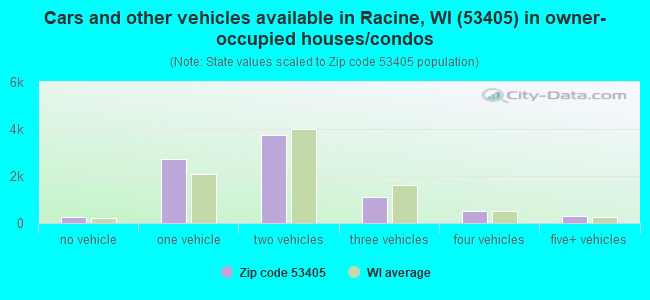
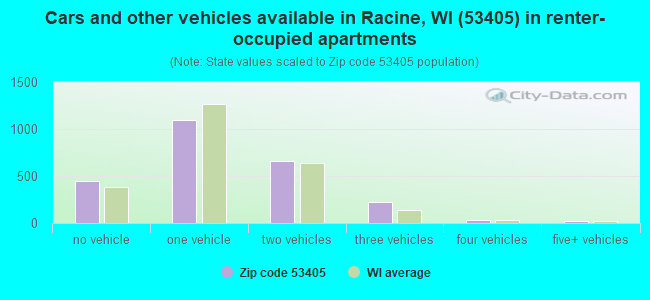


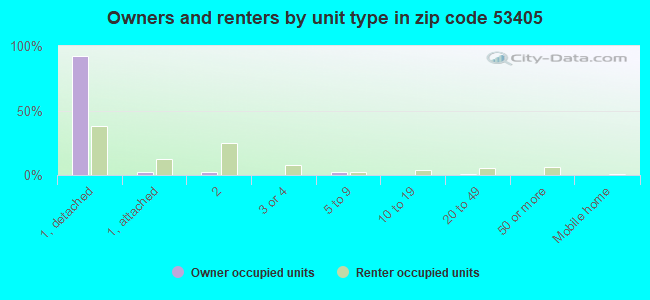
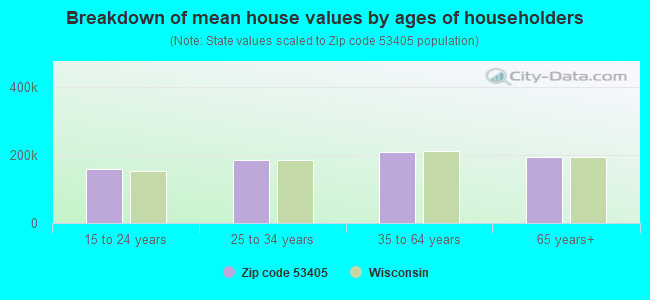


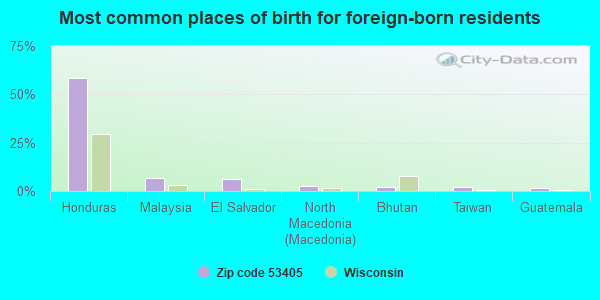
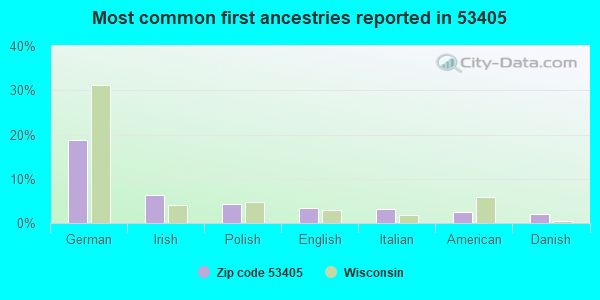
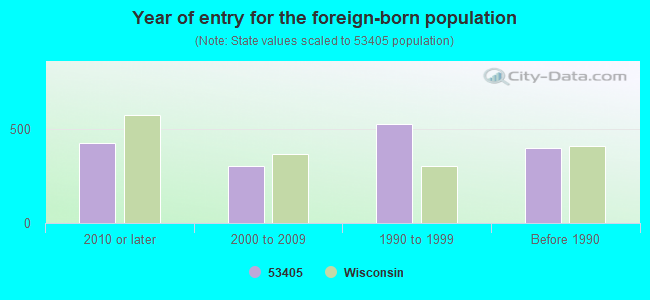

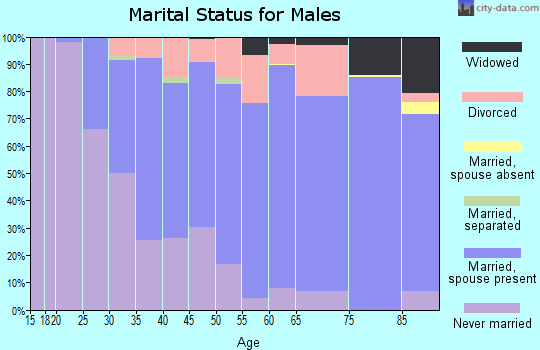
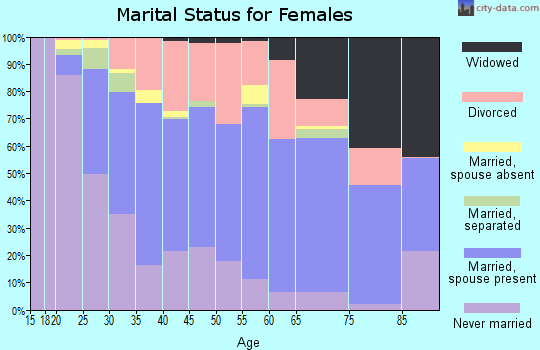
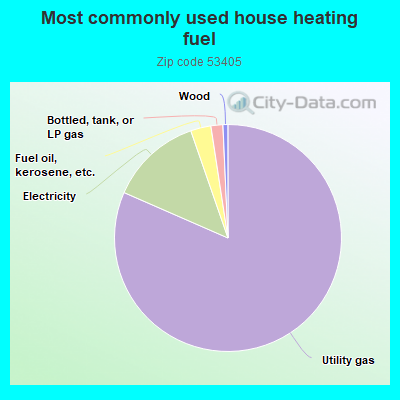
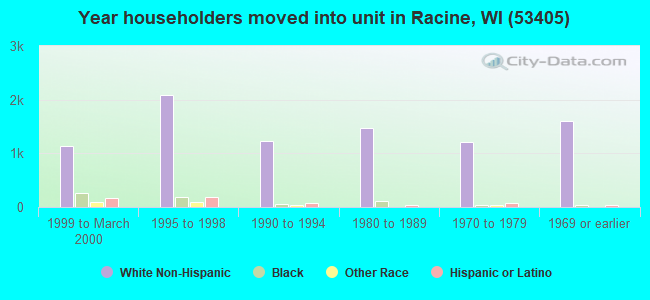
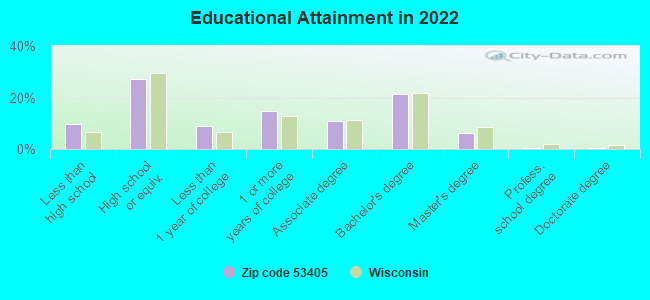
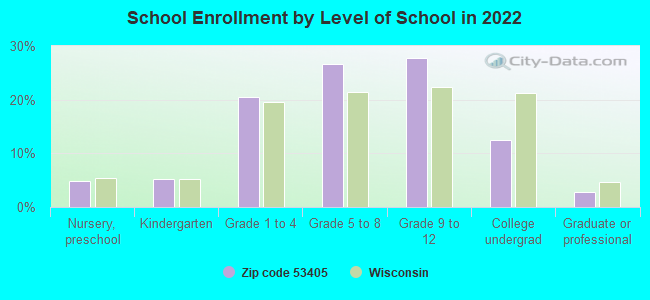
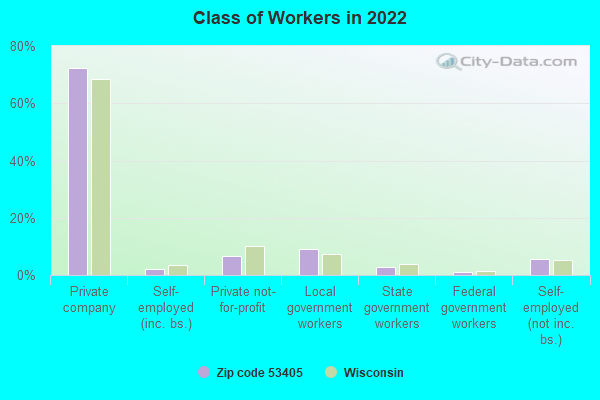
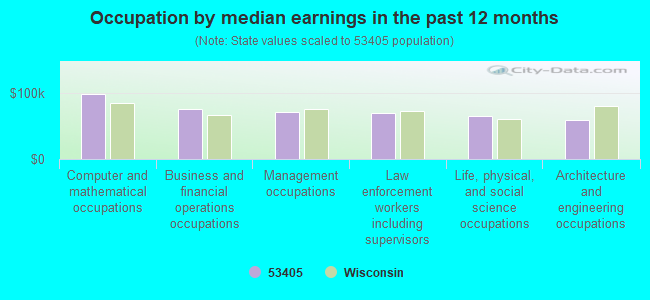
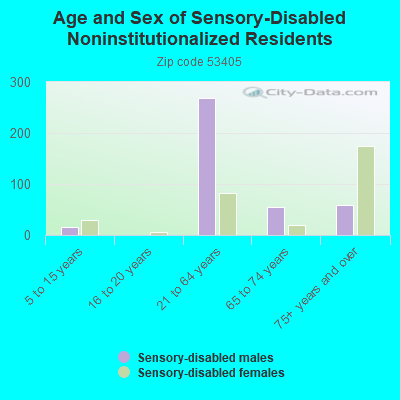
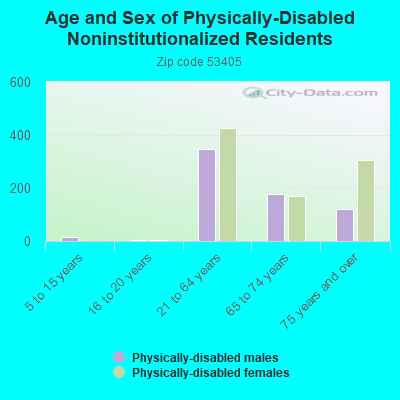
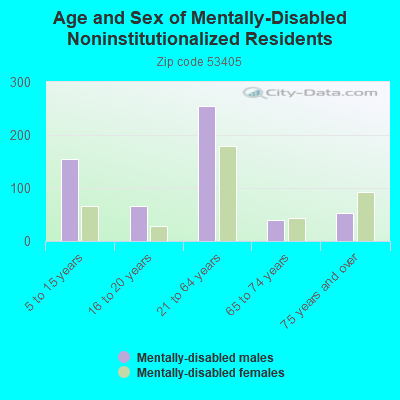
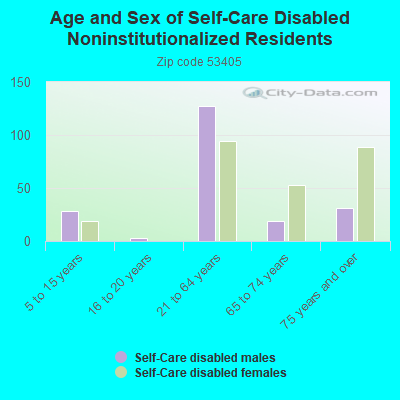
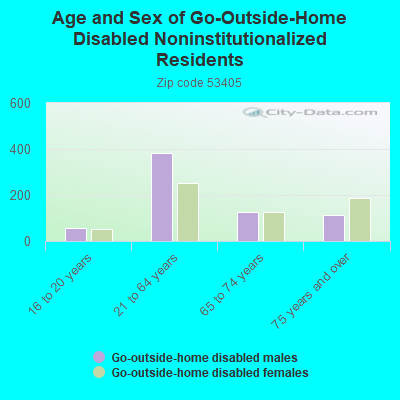
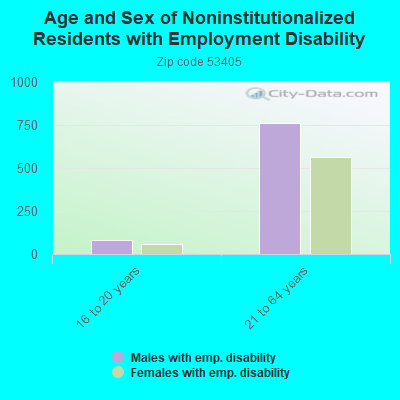
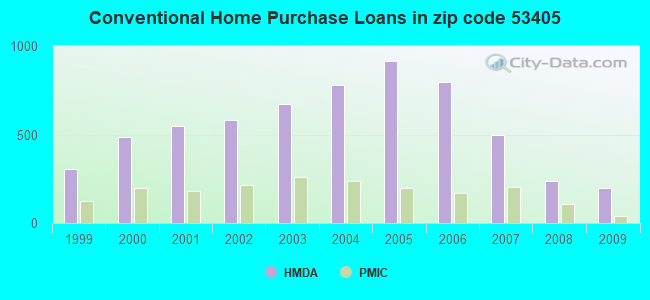
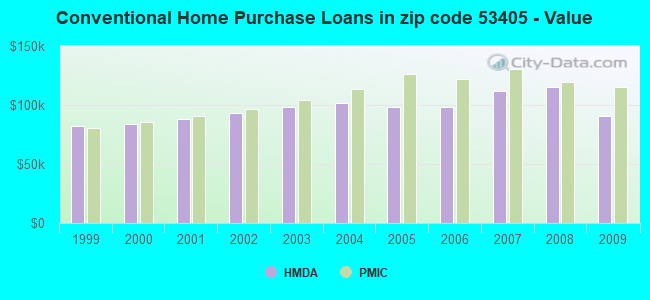
 According to the data from the years 2002 - 2018 the average number of fires per year is 31. The highest number of fire incidents - 58 took place in 2016, and the least - 0 in 2005. The data has a rising trend.
 When looking into fire subcategories, the most reports belonged to: Structure Fires (63.4%), and Outside Fires (19.3%).