Estimated zip code population in 2022: 24,980 Zip code population in 2010: 23,494 Zip code population in 2000: 30,225
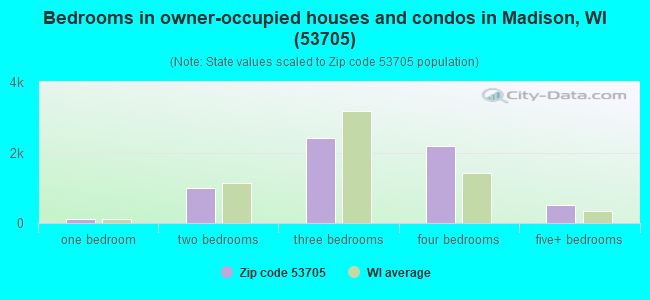
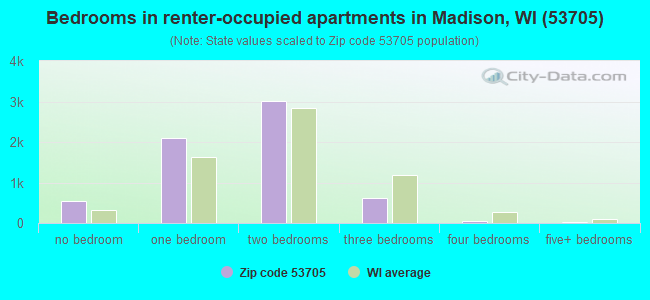
Houses and condos: 12,885 Renter-occupied apartments: 6,291
% of renters here:
50%
State:
32%
March 2022 cost of living index in zip code 53705: 98.7 (near average, U.S. average is 100)
Land area: 6.6 sq. mi. Water area: 0.0 sq. mi.
Population density: 3,795 people per square mile
(average).
OSM Map
General Map
Google Map
MSN Map
OSM Map
General Map
Google Map
MSN Map
OSM Map
General Map
Google Map
MSN Map
OSM Map
General Map
Google Map
MSN Map
Please wait while loading the map...
Real estate property taxes paid for housing units in 2022:
This zip code:
1.7% ($7,708)
Wisconsin:
1.4% ($3,497)
Median real estate property taxes paid for housing units with mortgages in 2022: $7,869 (1.6%) Median real estate property taxes paid for housing units with no mortgage in 2022: $7,573 (1.7%)
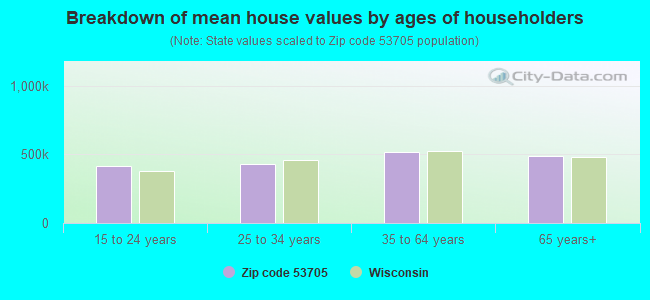
Estimated median house/condo value in 2022: $466,926
53705:
$466,926
Wisconsin:
$252,800
According to our research of Wisconsin and other state lists, there were 30 registered sex offenders living in 53705 zip code as of April 27, 2024. The ratio of all residents to sex offenders in zip code 53705 is 822 to 1. The ratio of registered sex offenders to all residents in this zip code is lower than the state average.
Median resident age:
This zip code:
35.4 years
Wisconsin median age:
40.4 years
Average household size:
This zip code:
2.0 people
Wisconsin:
2.3 people
Averages for the 2020 tax year for zip code 53705, filed in 2021:
Average Adjusted Gross Income (AGI) in 2020: $136,512 (Individual Income Tax Returns)
Here:
$136,512
State:
$72,319
Salary/wage: $84,645 (reported on 80.5% of returns)
Here:
$84,645
State:
$59,242
(% of AGI for various income ranges: 1307.1% for AGIs below $25k, 3771.7% for AGIs $25k-50k, 6638.2% for AGIs $50k-75k, 9062.2% for AGIs $75k-100k, 18577.5% for AGIs $100k-200k, 78930.4% for AGIs over 200k)
Taxable interest for individuals: $2,363 (reported on 50.3% of returns)
This zip code:
$2,363
Wisconsin:
$1,431
(% of AGI for various income ranges: 30.7% for AGIs below $25k, 28.9% for AGIs $25k-50k, 46.7% for AGIs $50k-75k, 111.4% for AGIs $75k-100k, 276.1% for AGIs $100k-200k, 1890.4% for AGIs over 200k)
Ordinary dividends: $14,043 (reported on 40.9% of returns)
Here:
$14,043
State:
$6,481
(% of AGI for various income ranges: 62.9% for AGIs below $25k, 101.0% for AGIs $25k-50k, 184.8% for AGIs $50k-75k, 431.7% for AGIs $75k-100k, 1004.3% for AGIs $100k-200k, 10780.2% for AGIs over 200k)
Net capital gain/loss in AGI: +$59,475 (reported on 37.0% of returns)
Here:
+$59,475
State:
+$18,329
(% of AGI for various income ranges: 33.4% for AGIs below $25k, 91.6% for AGIs $25k-50k, 145.8% for AGIs $50k-75k, 378.9% for AGIs $75k-100k, 1024.2% for AGIs $100k-200k, 54372.3% for AGIs over 200k)
Profit/loss from business: +$19,656 (reported on 14.4% of returns)
Here:
+$19,656
State:
+$14,562
(% of AGI for various income ranges: 77.4% for AGIs below $25k, 139.6% for AGIs $25k-50k, 128.6% for AGIs $50k-75k, 354.2% for AGIs $75k-100k, 701.9% for AGIs $100k-200k, 3906.4% for AGIs over 200k)
Taxable individual retirement arrangement distribution: $30,922 (reported on 13.2% of returns)
53705:
$30,922
Wisconsin:
$19,348
(% of AGI for various income ranges: 55.3% for AGIs below $25k, 121.4% for AGIs $25k-50k, 246.6% for AGIs $50k-75k, 578.4% for AGIs $75k-100k, 1184.0% for AGIs $100k-200k, 5405.1% for AGIs over 200k)
Self-employed (Keogh) retirement plans: $20,880 (reported on 1.6% of returns)
53705:
$20,880
Wisconsin:
$21,322
(% of AGI for various income ranges: 16.9% for AGIs $50k-75k, 59.3% for AGIs $100k-200k, 686.0% for AGIs over 200k)
Total itemized deductions: $46,863 (reported on 14.2% of returns)
Here:
$46,863
State:
$33,000
(% of AGI for various income ranges: 91.7% for AGIs below $25k, 124.2% for AGIs $25k-50k, 366.3% for AGIs $50k-75k, 681.7% for AGIs $75k-100k, 1269.8% for AGIs $100k-200k, 11413.2% for AGIs over 200k)
Charity contributions: $29,793 (reported on 11.9% of returns)
Here:
$29,793
State:
$12,044
(% of AGI for various income ranges: 4.2% for AGIs below $25k, 12.4% for AGIs $25k-50k, 66.0% for AGIs $50k-75k, 119.6% for AGIs $75k-100k, 374.1% for AGIs $100k-200k, 8019.8% for AGIs over 200k)
Taxes paid: $9,030 (reported on 14.0% of returns)
53705:
$9,030
State:
$8,228
(% of AGI for various income ranges: 24.3% for AGIs below $25k, 36.2% for AGIs $25k-50k, 134.7% for AGIs $50k-75k, 252.8% for AGIs $75k-100k, 391.1% for AGIs $100k-200k, 1324.9% for AGIs over 200k)
Earned income credit: $1,236 (reported on 6.2% of returns)
Here:
$1,236
State:
$2,155
(% of AGI for various income ranges: 32.1% for AGIs below $25k, 18.1% for AGIs $25k-50k)
Percentage of individuals using paid preparers for their 2020 taxes: 91.8%
Here:
92%
State:
94%
(% for various income ranges: 89.4% for AGIs below $25k, 91.8% for AGIs $25k-50k, 92.1% for AGIs $50k-75k, 91.1% for AGIs $75k-100k, 92.9% for AGIs $100k-200k, 94.2% for AGIs over 200k)
Averages for the 2012 tax year for zip code 53705, filed in 2013:
Average Adjusted Gross Income (AGI) in 2012: $88,325 (Individual Income Tax Returns)
Here:
$88,325
State:
$57,939
Salary/wage: $62,389 (reported on 79.9% of returns)
Here:
$62,389
State:
$48,248
(% of AGI for various income ranges: 82.2% for AGIs below $25k, 78.6% for AGIs $25k-50k, 70.7% for AGIs $50k-75k, 63.2% for AGIs $75k-100k, 61.5% for AGIs $100k-200k, 40.5% for AGIs over 200k)
Taxable interest for individuals: $2,408 (reported on 54.9% of returns)
This zip code:
$2,408
Wisconsin:
$1,224
(% of AGI for various income ranges: 1.6% for AGIs below $25k, 1.1% for AGIs $25k-50k, 0.9% for AGIs $50k-75k, 1.2% for AGIs $75k-100k, 0.9% for AGIs $100k-200k, 2.1% for AGIs over 200k)
Ordinary dividends: $11,560 (reported on 40.0% of returns)
Here:
$11,560
State:
$5,137
(% of AGI for various income ranges: 3.9% for AGIs below $25k, 2.7% for AGIs $25k-50k, 2.6% for AGIs $50k-75k, 3.5% for AGIs $75k-100k, 4.0% for AGIs $100k-200k, 7.8% for AGIs over 200k)
Net capital gain/loss in AGI: +$21,116 (reported on 32.7% of returns)
Here:
+$21,116
State:
+$11,137
(% of AGI for various income ranges: 0.6% for AGIs $25k-50k, 1.0% for AGIs $50k-75k, 1.9% for AGIs $75k-100k, 2.5% for AGIs $100k-200k, 16.8% for AGIs over 200k)
Profit/loss from business: +$17,021 (reported on 15.8% of returns)
Here:
+$17,021
State:
+$11,943
(% of AGI for various income ranges: 4.0% for AGIs below $25k, 2.5% for AGIs $25k-50k, 1.9% for AGIs $50k-75k, 3.0% for AGIs $75k-100k, 3.2% for AGIs $100k-200k, 3.3% for AGIs over 200k)
Taxable individual retirement arrangement distribution: $21,258 (reported on 15.5% of returns)
53705:
$21,258
Wisconsin:
$14,087
(% of AGI for various income ranges: 3.2% for AGIs below $25k, 2.6% for AGIs $25k-50k, 3.2% for AGIs $50k-75k, 4.1% for AGIs $75k-100k, 4.2% for AGIs $100k-200k, 3.8% for AGIs over 200k)
Self-employment retirement plans: $18,462 (reported on 1.7% of returns)
53705:
$18,462
Wisconsin:
$17,048
(% of AGI for various income ranges: 0.3% for AGIs $50k-75k, 0.4% for AGIs $100k-200k, 0.6% for AGIs over 200k)
Total itemized deductions: $31,388 (20% of AGI, reported on 45.0% of returns)
Here:
$31,388
State:
$22,257
Here:
20.2% of AGI
State:
20.1% of AGI
(% of AGI for various income ranges: 11.3% for AGIs below $25k, 11.0% for AGIs $25k-50k, 14.7% for AGIs $50k-75k, 17.4% for AGIs $75k-100k, 17.7% for AGIs $100k-200k, 16.4% for AGIs over 200k)
Charity contributions: $6,849 (reported on 39.0% of returns)
Here:
$6,849
State:
$3,370
(% of AGI for various income ranges: 0.8% for AGIs below $25k, 0.9% for AGIs $25k-50k, 1.6% for AGIs $50k-75k, 2.1% for AGIs $75k-100k, 2.8% for AGIs $100k-200k, 4.4% for AGIs over 200k)
Taxes paid: $15,970 (reported on 44.7% of returns)
53705:
$15,970
State:
$10,731
(% of AGI for various income ranges: 3.1% for AGIs below $25k, 4.1% for AGIs $25k-50k, 6.6% for AGIs $50k-75k, 8.4% for AGIs $75k-100k, 9.5% for AGIs $100k-200k, 8.9% for AGIs over 200k)
Earned income credit: $1,380 (reported on 8.0% of returns)
Here:
$1,380
State:
$2,094
(% of AGI for various income ranges: 2.2% for AGIs below $25k, 0.4% for AGIs $25k-50k)
Percentage of individuals using paid preparers for their 2012 taxes: 40.5%
Here:
41%
State:
54%
(% for various income ranges: 30.7% for AGIs below $25k, 34.1% for AGIs $25k-50k, 40.4% for AGIs $50k-75k, 43.0% for AGIs $75k-100k, 50.5% for AGIs $100k-200k, 72.5% for AGIs over 200k)
Averages for the 2004 tax year for zip code 53705, filed in 2005:
Average Adjusted Gross Income (AGI) in 2004: $69,326 (Individual Income Tax Returns)
Here:
$69,326
State:
$47,735
Salary/wage: $51,865 (reported on 78.9% of returns)
Here:
$51,865
State:
$41,540
(% of AGI for various income ranges: 126.7% for AGIs below $10k, 78.5% for AGIs $10k-25k, 77.6% for AGIs $25k-50k, 71.4% for AGIs $50k-75k, 64.0% for AGIs $75k-100k, 49.8% for AGIs over 100k)
Taxable interest for individuals: $2,897 (reported on 64.9% of returns)
This zip code:
$2,897
Wisconsin:
$1,420
(% of AGI for various income ranges: 9.4% for AGIs below $10k, 3.2% for AGIs $10k-25k, 2.3% for AGIs $25k-50k, 1.8% for AGIs $50k-75k, 1.9% for AGIs $75k-100k, 3.0% for AGIs over 100k)
Taxable dividends: $7,186 (reported on 44.1% of returns)
Here:
$7,186
State:
$2,869
(% of AGI for various income ranges: 11.8% for AGIs below $10k, 3.8% for AGIs $10k-25k, 2.6% for AGIs $25k-50k, 2.7% for AGIs $50k-75k, 3.5% for AGIs $75k-100k, 5.5% for AGIs over 100k)
Net capital gain/loss: +$18,964 (reported on 35.8% of returns)
Here:
+$18,964
State:
+$9,569
(% of AGI for various income ranges: -1.0% for AGIs below $10k, 0.9% for AGIs $10k-25k, 0.9% for AGIs $25k-50k, 1.6% for AGIs $50k-75k, 2.2% for AGIs $75k-100k, 15.3% for AGIs over 100k)
Profit/loss from business: +$15,875 (reported on 15.3% of returns)
Here:
+$15,875
State:
+$10,417
(% of AGI for various income ranges: 2.7% for AGIs below $10k, 2.9% for AGIs $10k-25k, 3.0% for AGIs $25k-50k, 2.5% for AGIs $50k-75k, 3.0% for AGIs $75k-100k, 3.9% for AGIs over 100k)
IRA payment deduction: $2,948 (reported on 2.5% of returns)
53705:
$2,948
Wisconsin:
$2,900
(% of AGI for various income ranges: 0.4% for AGIs below $10k, 0.3% for AGIs $10k-25k, 0.3% for AGIs $25k-50k, 0.1% for AGIs $50k-75k, 0.1% for AGIs $75k-100k, 0.0% for AGIs over 100k)
Self-employed pension: $14,465 (reported on 2.4% of returns)
Here:
$14,465
Wisconsin:
$11,934
(% of AGI for various income ranges: 0.2% for AGIs $25k-50k, 0.2% for AGIs $50k-75k, 0.3% for AGIs $75k-100k, 0.7% for AGIs over 100k)
Total itemized deductions: $22,351 (19% of AGI, reported on 48.8% of returns)
Here:
$22,351
State:
$18,160
Here:
19.2% of AGI
State:
21.1% of AGI
(% of AGI for various income ranges: 22.7% for AGIs below $10k, 12.1% for AGIs $10k-25k, 12.7% for AGIs $25k-50k, 18.6% for AGIs $50k-75k, 19.2% for AGIs $75k-100k, 15.3% for AGIs over 100k)
Charity contributions deductions: $4,754 (4% of AGI, reported on 40.9% of returns)
Here:
$4,754
State:
$2,711
Here:
3.6% of AGI
State:
3.0% of AGI
(% of AGI for various income ranges: 1.1% for AGIs below $10k, 1.0% for AGIs $10k-25k, 1.4% for AGIs $25k-50k, 2.2% for AGIs $50k-75k, 2.7% for AGIs $75k-100k, 3.4% for AGIs over 100k)
Total tax: $12,711 (reported on 81.3% of returns)
53705:
$12,711
State:
$7,114
(% of AGI for various income ranges: 3.2% for AGIs below $10k, 5.1% for AGIs $10k-25k, 8.2% for AGIs $25k-50k, 10.1% for AGIs $50k-75k, 10.8% for AGIs $75k-100k, 18.8% for AGIs over 100k)
Earned income credit: $1,168 (reported on 5.1% of returns)
Here:
$1,168
State:
$1,544
Percentage of individuals using paid preparers for their 2004 taxes: 41.2%
Here:
41%
State:
57%
(% for various income ranges: 31.7% for AGIs below $10k, 32.6% for AGIs $10k-25k, 38.9% for AGIs $25k-50k, 43.7% for AGIs $50k-75k, 44.7% for AGIs $75k-100k, 59.7% for AGIs over 100k)
Likely homosexual households (counted as self-reported same-sex unmarried-partner households)
Lesbian couples: 0.2% of all households
Gay men: 0.2% of all households
Household received Food Stamps/SNAP in the past 12 months: 924 Household did not receive Food Stamps/SNAP in the past 12 months: 11,517
Women who had a birth in the past 12 months: 369 (326 now married, 44 unmarried) Women who did not have a birth in the past 12 months: 6,080 (2,416 now married, 3,664 unmarried)
Housing units in zip code 53705 with a mortgage: 3,555 (716 second mortgage, 37 home equity loan, 668 both second mortgage and home equity loan) Houses without a mortgage: 84
Median monthly owner costs for units with a mortgage: $2,384 Median monthly owner costs for units without a mortgage: $993
Residents with income below the poverty level in 2022:
This zip code:
12.1%
Whole state:
10.7%
Residents with income below 50% of the poverty level in 2022:
This zip code:
4.4%
Whole state:
5.7%
Median number of rooms in houses and condos:
Here:
7.4
State:
6.5
Median number of rooms in apartments:
Here:
3.3
State:
4.1
Notable locations in this zip code not listed on our city pages
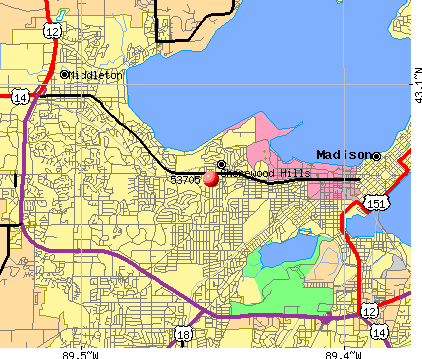
Notable locations in zip code 53705: Blackhawk Country Club (A), Oakwood Home (B), Nielsen Tennis Stadium (C), German-American Institute (D), Weston Place (E), Shorewood Hills Emergency Medical Services (F), Madison Fire Department Station 9 (G), Shorewood Hills Fire Department (H). Display/hide their locations on the map
Churches in zip code 53705 include: First Baptist Church (A), First Unitarian Church (B), Middleton Baptist Church (C), Saint Dunstans Episcopal Church (D). Display/hide their locations on the map
Parks in zip code 53705 include: Garner Park (1), Hoyt Park (2), Robin Park (3), Mineral Point Park (4), Bordner Park (5), Green Oak Hills Park (6), Indian Hills Park (7), Kettle Pond Park (8), Lucia Crest Park (9). Display/hide their locations on the map
Tourist attractions (not listed on the city page) : Chickadee Depot (Nature Centers; 3236 University Avenue), Burkhalter Tours (Tours & Charters; 6501 Mineral Point Road).
3,485 married couples with children.
809 single-parent households (239 men, 570 women).
79.8% of residents of 53705 zip code speak English at home.
3.4% of residents speak Spanish at home (73% very well, 13% well, 8% not well, 6% not at all).
6.2% of residents speak other Indo-European language at home (77% very well, 18% well, 4% not well, 1% not at all).
10.1% of residents speak Asian or Pacific Island language at home (57% very well, 28% well, 14% not well, 1% not at all).
1.1% of residents speak other language at home (98% very well, 2% well).
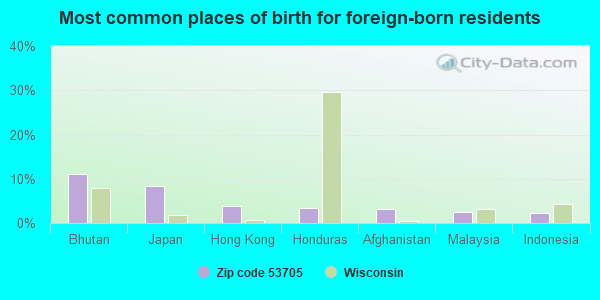
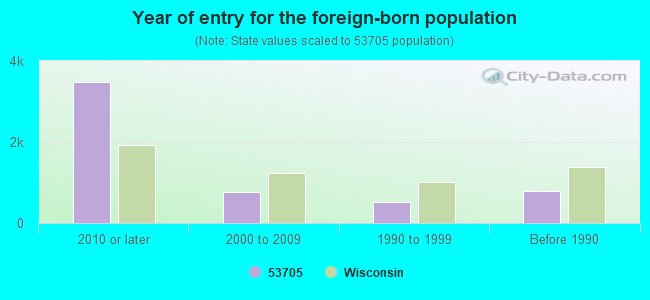
Foreign born population: 4,838 (19.4%) (34.2% of them are naturalized citizens)
Facilities with environmental interests located in this zip code:
2803-2809 UNIVERSITY AVE (2803-2809 UNIVERSITY AVE in MADISON, WI)
Large Quantity Generators, more that 1000 kg of hazardous waste/month (Resource Conservation and Recovery Act (tracking hazardous waste)) STATE MASTER (Wisconsin database) - RCRAINFO-WIR000113084, SQG Organizations: MOM PARTNERSHIP (CONTACT/OPERATOR)
, RIFKEN GROUP LTD (CONTACT/OPERATOR)
COCA COLA BOTTLING CO (3536 UNIVERSITY AVE in MADISON, WI)
(Resource Conservation and Recovery Act (tracking hazardous waste)) STATE MASTER (Wisconsin database) - RCRAINFO-WID175691088, CESQG Business SIC classification: BOTTLED AND CANNED SOFT DRINKS AND CARBONATED WATERS; GROCERIES AND RELATED PRODUCTS Organizations: JOHNSTON COCA COLA BOTTLING GROUP (CONTACT/OWNER)
AFFILIATED ENGINEERS INC (625 N SEGOE RD in MADISON, WI)
Conditionally Exempt Small Quantity Generators, less than 100 kg/month of hazardous waste (Resource Conservation and Recovery Act (tracking hazardous waste)) - notification STATE MASTER (Wisconsin database) - RCRAINFO-WID091782953, CESQG Business SIC classification: COMMERCIAL PRINTING, LITHOGRAPHIC
A1 DRAPERY CLEANERS (3700 A UNIVERSITY AVE in MADISON, WI)
Conditionally Exempt Small Quantity Generators, less than 100 kg/month of hazardous waste (Resource Conservation and Recovery Act (tracking hazardous waste)) - notification STATE MASTER (Wisconsin database) - RCRAINFO-WID988603270, CESQG Organizations: DAUBENSPECK CARROL (CONTACT/OWNER)
CAR CARE CLINIC (2733 UNIVERSITY AVE in MADISON, WI)
Conditionally Exempt Small Quantity Generators, less than 100 kg/month of hazardous waste (Resource Conservation and Recovery Act (tracking hazardous waste)) STATE MASTER (Wisconsin database) - RCRAINFO-WID981531270, CESQG Alternative names: TUNE UP CLINIC
CEREAL CROPS RESEARCH LAB (501 N WALNUT in MADISON, WI) . Federal Facility. DEPARTMENT OF AGRICULTURE
Conditionally Exempt Small Quantity Generators, less than 100 kg/month of hazardous waste (Resource Conservation and Recovery Act (tracking hazardous waste)) - notification STATE MASTER (Wisconsin database) - RCRAINFO-WID988639951, CESQG Organizations: US DEPT AGRICULTURE ARS MWA (CONTACT/OWNER)
BLESSED SACRAMENT ELEM SCHOOL (2112 HOLLISTER AVE in MADISON, WI)
COMPLIANCE ACTIVITY (Tracking inspections of insecticide, fungicide, and rodenticide, and toxic substances) Alternative names: BLESSED SACRAMENT ELEMENTARY SCH
CITGO QUICK MART (6702 MINERAL POINT RD in MADISON, WI)
Small Quantity Generators, between 100 kg and 1000 kg of hazardous waste/month (Resource Conservation and Recovery Act (tracking hazardous waste)) - notification Organizations: FRANCOIS EDWARD (CONTACT/OWNER)
Housing units lacking complete plumbing facilities: 0.1% Housing units lacking complete kitchen facilities: 0.2%
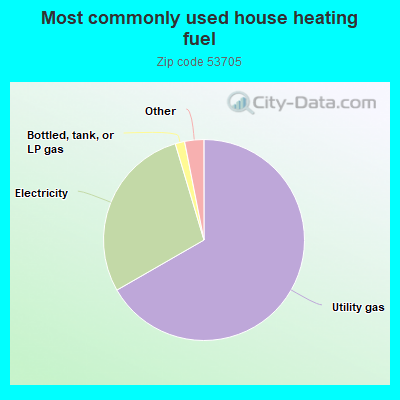
66.7%Utility gas
28.7%Electricity
1.5%Bottled, tank, or LP gas
0.8%Other fuel
0.7%Fuel oil, kerosene, etc.
0.7%No fuel used
0.6%Solar energy
Population in 1990: 29,114. Population change in the 1990s: +1,111 (+3.8%).
Place of birth for U.S.-born residents:
This state: 10,792
Northeast: 1,791
Midwest: 4,610
South: 1,717
West: 924
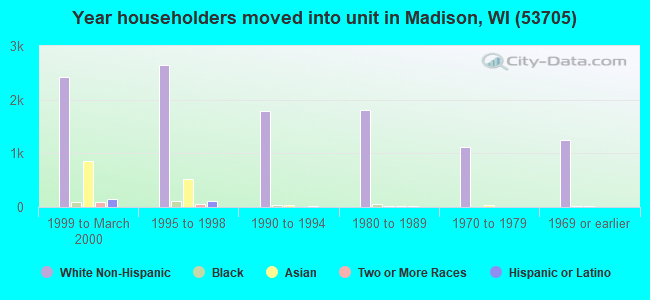
49% of the 53705 zip code residents lived in the same house 5 years ago. Out of people who lived in different houses, 45% lived in this county. Out of people who lived in different counties, 50% lived in Wisconsin.
85% of the 53705 zip code residents lived in the same house 1 year ago. Out of people who lived in different houses, 41% moved from this county. Out of people who lived in different houses, 11% moved from different county within same state. Out of people who lived in different houses, 28% moved from different state. Out of people who lived in different houses, 25% moved from abroad.
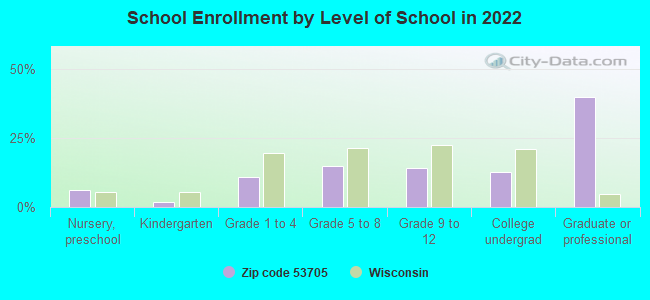
Private vs. public school enrollment:
Students in private schools in grades 1 to 8 (elementary and middle school): 227
Here:
12.7%
Wisconsin:
16.7%
Students in private schools in grades 9 to 12 (high school): 94
Here:
9.7%
Wisconsin:
12.5%
Students in private undergraduate colleges: 194
Here:
22.1%
Wisconsin:
17.5%
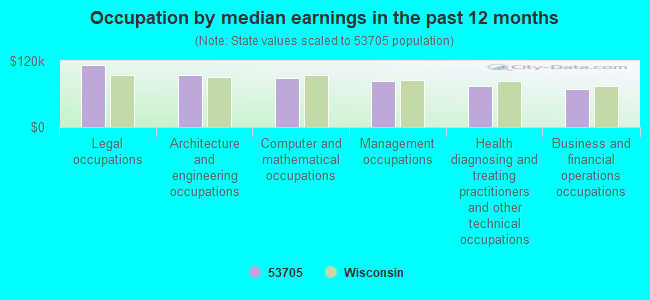
Occupation by median earnings in the past 12 months ($)
112,030Legal occupations
95,062Architecture and engineering occupations
89,756Computer and mathematical occupations
83,190Management occupations
73,784Health diagnosing and treating practitioners and other technical occupations
69,422Business and financial operations occupations
Companies with federal contracts located in this zip code:
POWER AND ENERGY INTERNATIONAL (2020 UNIVERSITY AVENUE in MADISON, WI; small business)
$70,000 with Army for Other Research and Development -- Basic Research (R&D). Signed on 2000-02-14. Completion date: 2000-07-31.
AFFILIATED CONSTRUCTION SERVIC (3330 UNIVERSITY AVE STE 20 in MADISON, WI; small business) : $65,850 in 2 contractsin 2005
$55,350 with Army for Systems Engineering Services. Signed on 2005-07-29. Completion date: 2005-10-25.
$10,500 with Army for Engineering and Technical Services. Signed on 2005-02-14. Completion date: 2005-03-18.
STANDARD NETWORKS INC (344 S YELLOWSTONE DR in MADISON, WI; small business) : $46,200 in 4 contractsfrom 2005 to 2006
$18,000 with Navy for ADP Software. Signed on 2006-01-25. Completion date: 2006-02-27.
$10,200 with Air Force for ADP Software. Signed on 2005-08-19. Completion date: 2005-09-23.
$9,000 with Army for ADP Software. Signed on 2005-12-01. Completion date: 2006-12-31.
$9,000 with Navy for ADP Software. Signed on 2005-05-24. Completion date: 2005-06-01.
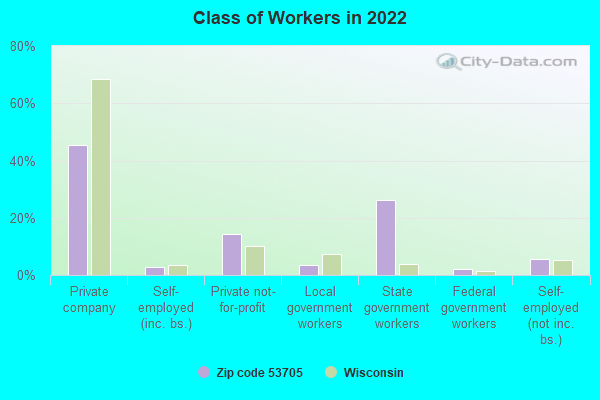
Top industries in this zip code by the number of employees in 2005:
Finance and Insurance: Direct Life Insurance Carriers (over 1000 employees: 1 establishment, 10-19 employees: 1 establishment)
2005 - 2018 National Fire Incident Reporting System (NFIRS) incidents
Based on the data from the years 2005 - 2018 the average number of fire incidents per year is 16. The highest number of fires - 27 took place in 2010, and the least - 2 in 2009. The data has a rising trend.
When looking into fire subcategories, the most reports belonged to: Structure Fires (51.1%), and Outside Fires (31.9%).
Fire incident types reported to NFIRS in Zip Code 53705

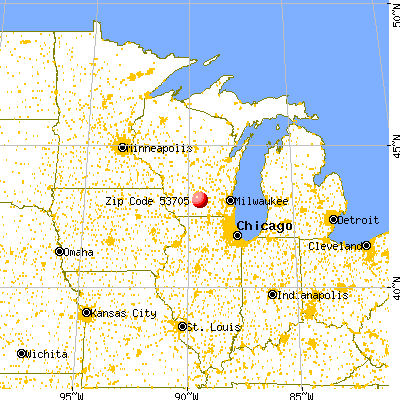


 Nearest zip codes: 53792, 53726, 53706, 53715, 53717, 53719.


 Based on the data from the years 2005 - 2018 the average number of fire incidents per year is 16. The highest number of fires - 27 took place in 2010, and the least - 2 in 2009. The data has a rising trend.
 When looking into fire subcategories, the most reports belonged to: Structure Fires (51.1%), and Outside Fires (31.9%).