Estimated zip code population in 2022: 4,140 Zip code population in 2010: 3,625 Zip code population in 2000: 3,638
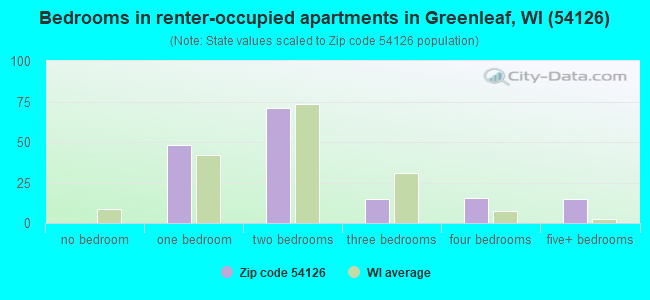
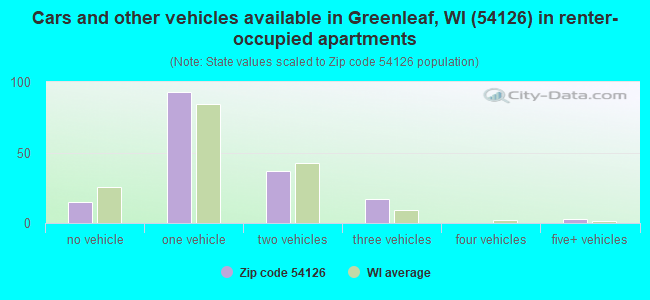
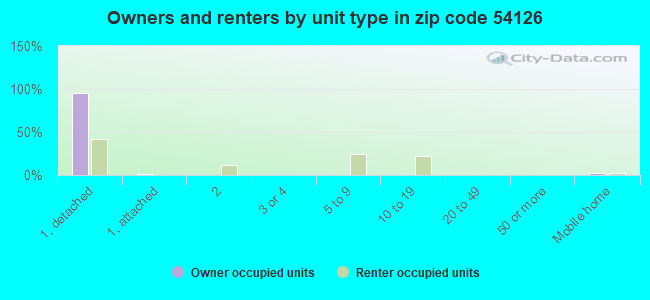
Houses and condos: 1,595 Renter-occupied apartments: 164
% of renters here:
11%
State:
32%
March 2022 cost of living index in zip code 54126: 86.5 (less than average, U.S. average is 100)
Land area: 76.0 sq. mi. Water area: 0.1 sq. mi.
Population density: 54 people per square mile
(very low).
OSM Map
General Map
Google Map
MSN Map
OSM Map
General Map
Google Map
MSN Map
OSM Map
General Map
Google Map
MSN Map
OSM Map
General Map
Google Map
MSN Map
Please wait while loading the map...
Real estate property taxes paid for housing units in 2022:
This zip code:
1.3% ($3,143)
Wisconsin:
1.4% ($3,497)
Median real estate property taxes paid for housing units with mortgages in 2022: $3,136 (1.2%) Median real estate property taxes paid for housing units with no mortgage in 2022: $3,159 (1.3%)
Business Search- 14 Million verified businesses
Males: 2,021
(48.8%)
Females: 2,118
(51.2%)
For population 25 years and over in 54126:
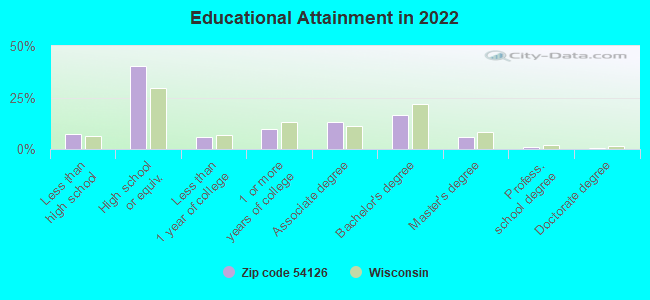
High school or higher: 92.0%
Bachelor's degree or higher: 23.4%
Graduate or professional degree: 6.8%
Unemployed: 1.3%
Mean travel time to work (commute): 26.3 minutes
For population 15 years and over in 54126:
Never married: 25.4%
Now married: 65.3%
Separated: 0.0%
Widowed: 3.7%
Divorced: 5.7%
Zip code 54126 compared to state average:
Unemployed percentage below state average.
Black race population percentage significantly below state average.
Renting percentage significantly below state average.
Length of stay since moving in significantly above state average.
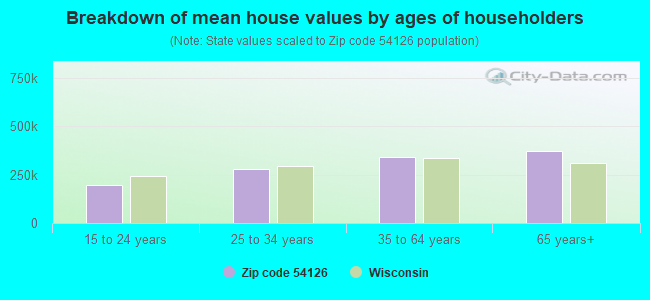
Estimated median house/condo value in 2022: $246,682
54126:
$246,682
Wisconsin:
$252,800
According to our research of Wisconsin and other state lists, there were 11 registered sex offenders living in 54126 zip code as of April 26, 2024. The ratio of all residents to sex offenders in zip code 54126 is 351 to 1. The ratio of registered sex offenders to all residents in this zip code is near the state average.
Median resident age:
This zip code:
40.7 years
Wisconsin median age:
40.4 years
Average household size:
This zip code:
2.7 people
Wisconsin:
2.3 people
Averages for the 2020 tax year for zip code 54126, filed in 2021:
Average Adjusted Gross Income (AGI) in 2020: $76,965 (Individual Income Tax Returns)
Here:
$76,965
State:
$72,319
Salary/wage: $62,199 (reported on 84.9% of returns)
Here:
$62,199
State:
$59,242
(% of AGI for various income ranges: 1443.9% for AGIs below $25k, 4072.5% for AGIs $25k-50k, 7206.0% for AGIs $50k-75k, 10616.0% for AGIs $75k-100k, 18739.5% for AGIs $100k-200k, 71875.0% for AGIs over 200k)
Taxable interest for individuals: $1,294 (reported on 53.1% of returns)
This zip code:
$1,294
Wisconsin:
$1,431
(% of AGI for various income ranges: 38.2% for AGIs below $25k, 45.0% for AGIs $25k-50k, 83.0% for AGIs $50k-75k, 68.7% for AGIs $75k-100k, 169.1% for AGIs $100k-200k, 2230.0% for AGIs over 200k)
Ordinary dividends: $3,231 (reported on 27.1% of returns)
Here:
$3,231
State:
$6,481
(% of AGI for various income ranges: 52.1% for AGIs below $25k, 68.6% for AGIs $25k-50k, 87.5% for AGIs $50k-75k, 71.3% for AGIs $75k-100k, 151.8% for AGIs $100k-200k, 3630.0% for AGIs over 200k)
Net capital gain/loss in AGI: +$17,860 (reported on 25.0% of returns)
Here:
+$17,860
State:
+$18,329
(% of AGI for various income ranges: 35.7% for AGIs below $25k, 140.0% for AGIs $25k-50k, 248.5% for AGIs $50k-75k, 214.7% for AGIs $75k-100k, 710.5% for AGIs $100k-200k, 28495.0% for AGIs over 200k)
Profit/loss from business: +$14,438 (reported on 12.5% of returns)
Here:
+$14,438
State:
+$14,562
(% of AGI for various income ranges: 86.1% for AGIs below $25k, 120.7% for AGIs $25k-50k, 277.0% for AGIs $50k-75k, 416.0% for AGIs $75k-100k, 776.4% for AGIs $100k-200k)
Taxable individual retirement arrangement distribution: $17,844 (reported on 14.1% of returns)
54126:
$17,844
Wisconsin:
$19,348
(% of AGI for various income ranges: 156.1% for AGIs below $25k, 276.1% for AGIs $25k-50k, 360.5% for AGIs $50k-75k, 584.7% for AGIs $75k-100k, 913.6% for AGIs $100k-200k)
Total itemized deductions: $30,560 (reported on 5.2% of returns)
Here:
$30,560
State:
$33,000
(% of AGI for various income ranges: 133.2% for AGIs below $25k, 244.5% for AGIs $50k-75k, 373.6% for AGIs $100k-200k, 6860.0% for AGIs over 200k)
Charity contributions: $13,112 (reported on 4.2% of returns)
Here:
$13,112
State:
$12,044
(% of AGI for various income ranges: 23.6% for AGIs $25k-50k, 89.1% for AGIs $100k-200k, 3935.0% for AGIs over 200k)
Taxes paid: $7,760 (reported on 5.2% of returns)
54126:
$7,760
State:
$8,228
(% of AGI for various income ranges: 108.0% for AGIs $50k-75k, 140.9% for AGIs $100k-200k, 1250.0% for AGIs over 200k)
Earned income credit: $2,075 (reported on 6.2% of returns)
Here:
$2,075
State:
$2,155
(% of AGI for various income ranges: 48.2% for AGIs below $25k, 40.7% for AGIs $25k-50k)
Percentage of individuals using paid preparers for their 2020 taxes: 94.8%
Here:
95%
State:
94%
(% for various income ranges: 91.7% for AGIs below $25k, 92.7% for AGIs $25k-50k, 96.8% for AGIs $50k-75k, 95.8% for AGIs $75k-100k, 97.4% for AGIs $100k-200k, 100.0% for AGIs over 200k)
Averages for the 2012 tax year for zip code 54126, filed in 2013:
Average Adjusted Gross Income (AGI) in 2012: $59,380 (Individual Income Tax Returns)
Here:
$59,380
State:
$57,939
Salary/wage: $49,446 (reported on 89.1% of returns)
Here:
$49,446
State:
$48,248
(% of AGI for various income ranges: 75.0% for AGIs below $25k, 81.0% for AGIs $25k-50k, 81.5% for AGIs $50k-75k, 81.1% for AGIs $75k-100k, 76.5% for AGIs $100k-200k, 46.0% for AGIs over 200k)
Taxable interest for individuals: $889 (reported on 49.7% of returns)
This zip code:
$889
Wisconsin:
$1,224
(% of AGI for various income ranges: 2.1% for AGIs below $25k, 0.8% for AGIs $25k-50k, 0.7% for AGIs $50k-75k, 0.4% for AGIs $75k-100k, 0.6% for AGIs $100k-200k, 0.9% for AGIs over 200k)
Ordinary dividends: $2,534 (reported on 27.3% of returns)
Here:
$2,534
State:
$5,137
(% of AGI for various income ranges: 1.9% for AGIs below $25k, 1.0% for AGIs $25k-50k, 0.5% for AGIs $50k-75k, 1.1% for AGIs $75k-100k, 0.7% for AGIs $100k-200k, 2.7% for AGIs over 200k)
Net capital gain/loss in AGI: +$13,489 (reported on 24.0% of returns)
Here:
+$13,489
State:
+$11,137
(% of AGI for various income ranges: 0.5% for AGIs below $25k, 1.9% for AGIs $25k-50k, 4.6% for AGIs $50k-75k, 3.6% for AGIs $75k-100k, 8.2% for AGIs $100k-200k, 9.6% for AGIs over 200k)
Profit/loss from business: +$10,914 (reported on 12.0% of returns)
Here:
+$10,914
State:
+$11,943
(% of AGI for various income ranges: 3.4% for AGIs below $25k, 2.9% for AGIs $25k-50k, 1.0% for AGIs $50k-75k, 2.4% for AGIs $75k-100k, 3.5% for AGIs $100k-200k)
Taxable individual retirement arrangement distribution: $10,619 (reported on 11.5% of returns)
54126:
$10,619
Wisconsin:
$14,087
(% of AGI for various income ranges: 5.5% for AGIs below $25k, 3.2% for AGIs $25k-50k, 2.2% for AGIs $50k-75k, 2.3% for AGIs $75k-100k, 1.6% for AGIs $100k-200k)
Self-employment retirement plans: $11,500 (reported on 1.1% of returns)
54126:
$11,500
Wisconsin:
$17,048
Total itemized deductions: $19,566 (20% of AGI, reported on 38.8% of returns)
Here:
$19,566
State:
$22,257
Here:
19.9% of AGI
State:
20.1% of AGI
(% of AGI for various income ranges: 8.9% for AGIs below $25k, 9.5% for AGIs $25k-50k, 11.4% for AGIs $50k-75k, 15.0% for AGIs $75k-100k, 15.1% for AGIs $100k-200k, 12.7% for AGIs over 200k)
Charity contributions: $3,023 (reported on 30.6% of returns)
Here:
$3,023
State:
$3,370
(% of AGI for various income ranges: 0.6% for AGIs below $25k, 1.0% for AGIs $25k-50k, 1.1% for AGIs $50k-75k, 1.5% for AGIs $75k-100k, 1.9% for AGIs $100k-200k, 2.6% for AGIs over 200k)
Taxes paid: $9,377 (reported on 38.8% of returns)
54126:
$9,377
State:
$10,731
(% of AGI for various income ranges: 2.8% for AGIs below $25k, 3.4% for AGIs $25k-50k, 4.8% for AGIs $50k-75k, 6.9% for AGIs $75k-100k, 7.8% for AGIs $100k-200k, 7.9% for AGIs over 200k)
Earned income credit: $1,700 (reported on 8.2% of returns)
Here:
$1,700
State:
$2,094
(% of AGI for various income ranges: 2.4% for AGIs below $25k, 0.6% for AGIs $25k-50k)
Percentage of individuals using paid preparers for their 2012 taxes: 68.3%
Here:
68%
State:
54%
(% for various income ranges: 63.6% for AGIs below $25k, 66.7% for AGIs $25k-50k, 75.8% for AGIs $50k-75k, 66.7% for AGIs $75k-100k, 68.2% for AGIs $100k-200k, 100.0% for AGIs over 200k)
Averages for the 2004 tax year for zip code 54126, filed in 2005:
Average Adjusted Gross Income (AGI) in 2004: $45,968 (Individual Income Tax Returns)
Here:
$45,968
State:
$47,735
Salary/wage: $40,929 (reported on 89.8% of returns)
Here:
$40,929
State:
$41,540
(% of AGI for various income ranges: 248.0% for AGIs below $10k, 75.9% for AGIs $10k-25k, 84.0% for AGIs $25k-50k, 83.5% for AGIs $50k-75k, 86.3% for AGIs $75k-100k, 64.2% for AGIs over 100k)
Taxable interest for individuals: $1,167 (reported on 59.8% of returns)
This zip code:
$1,167
Wisconsin:
$1,420
(% of AGI for various income ranges: 11.7% for AGIs below $10k, 3.1% for AGIs $10k-25k, 1.5% for AGIs $25k-50k, 1.4% for AGIs $50k-75k, 0.6% for AGIs $75k-100k, 1.6% for AGIs over 100k)
Taxable dividends: $1,219 (reported on 30.5% of returns)
Here:
$1,219
State:
$2,869
(% of AGI for various income ranges: 4.7% for AGIs below $10k, 1.0% for AGIs $10k-25k, 0.7% for AGIs $25k-50k, 0.5% for AGIs $50k-75k, 0.4% for AGIs $75k-100k, 1.3% for AGIs over 100k)
Net capital gain/loss: +$7,077 (reported on 27.4% of returns)
Here:
+$7,077
State:
+$9,569
(% of AGI for various income ranges: 33.5% for AGIs below $10k, 3.4% for AGIs $10k-25k, 2.7% for AGIs $25k-50k, 2.3% for AGIs $50k-75k, 2.8% for AGIs $75k-100k, 8.0% for AGIs over 100k)
Profit/loss from business: +$5,863 (reported on 12.9% of returns)
Here:
+$5,863
State:
+$10,417
(% of AGI for various income ranges: 7.7% for AGIs below $10k, 3.8% for AGIs $10k-25k, 1.5% for AGIs $25k-50k, 1.7% for AGIs $50k-75k, 1.5% for AGIs $75k-100k, 1.1% for AGIs over 100k)
Profit/loss from farming: +$1,871 (reported on 9.7% of returns)
Here:
+$1,871
State:
-$2,654
(% of AGI for various income ranges: -21.9% for AGIs below $10k, -2.4% for AGIs $10k-25k, 1.1% for AGIs $25k-50k, 0.9% for AGIs $50k-75k, 1.8% for AGIs $75k-100k, -0.4% for AGIs over 100k)
IRA payment deduction: $3,037 (reported on 3.1% of returns)
54126:
$3,037
Wisconsin:
$2,900
Self-employed pension: $6,100 (reported on 1.1% of returns)
Here:
$6,100
Wisconsin:
$11,934
Total itemized deductions: $16,035 (22% of AGI, reported on 41.1% of returns)
Here:
$16,035
State:
$18,160
Here:
21.5% of AGI
State:
21.1% of AGI
(% of AGI for various income ranges: 30.6% for AGIs below $10k, 9.6% for AGIs $10k-25k, 13.8% for AGIs $25k-50k, 15.5% for AGIs $50k-75k, 16.0% for AGIs $75k-100k, 13.2% for AGIs over 100k)
Charity contributions deductions: $2,192 (3% of AGI, reported on 37.0% of returns)
Here:
$2,192
State:
$2,711
Here:
2.9% of AGI
State:
3.0% of AGI
(% of AGI for various income ranges: 2.1% for AGIs below $10k, 1.5% for AGIs $10k-25k, 1.5% for AGIs $25k-50k, 1.4% for AGIs $50k-75k, 1.7% for AGIs $75k-100k, 2.5% for AGIs over 100k)
Total tax: $5,905 (reported on 80.7% of returns)
54126:
$5,905
State:
$7,114
(% of AGI for various income ranges: 8.4% for AGIs below $10k, 5.9% for AGIs $10k-25k, 7.1% for AGIs $25k-50k, 7.5% for AGIs $50k-75k, 9.1% for AGIs $75k-100k, 18.6% for AGIs over 100k)
Earned income credit: $1,383 (reported on 6.6% of returns)
Here:
$1,383
State:
$1,544
Percentage of individuals using paid preparers for their 2004 taxes: 66.2%
Here:
66%
State:
57%
(% for various income ranges: 59.1% for AGIs below $10k, 60.5% for AGIs $10k-25k, 69.4% for AGIs $25k-50k, 71.1% for AGIs $50k-75k, 67.4% for AGIs $75k-100k, 72.0% for AGIs over 100k)
Household received Food Stamps/SNAP in the past 12 months: 58 Household did not receive Food Stamps/SNAP in the past 12 months: 1,483
Women who had a birth in the past 12 months: 44 (32 now married, 11 unmarried) Women who did not have a birth in the past 12 months: 924 (499 now married, 424 unmarried)
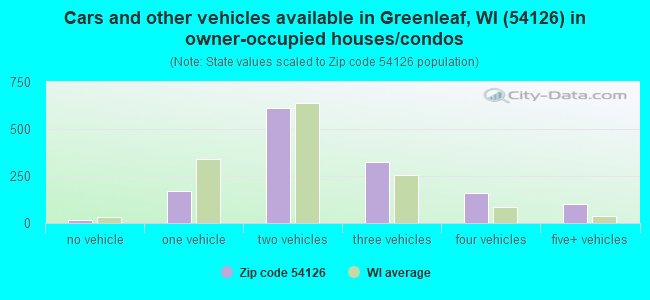
Housing units in zip code 54126 with a mortgage: 930 (94 second mortgage, 76 both second mortgage and home equity loan) Median monthly owner costs for units with a mortgage: $1,426 Median monthly owner costs for units without a mortgage: $577
Residents with income below the poverty level in 2022:
This zip code:
4.4%
Whole state:
10.7%
Residents with income below 50% of the poverty level in 2022:
This zip code:
1.6%
Whole state:
5.7%
Median number of rooms in houses and condos:
Here:
6.9
State:
6.5
Median number of rooms in apartments:
Here:
3.8
State:
4.1
Notable locations in this zip code not listed on our city pages
Notable locations in zip code 54126: County Line Dairy Farm (A), Hilly Haven Golf Course (B), Country Aire Farms (C), East Creek Farm (D), Wobeck Farm (E), Heatherbrook Farm (F), Wayside Dairy Farm (G), Brightside Dairy (H), Wayside Volunteer Fire Department (I), Greenleaf Volunteer Fire Department (J), Morrison Volunteer Fire Department (K). Display/hide their locations on the map
Parks in zip code 54126 include: Holland Red Maple Swamp State Natural Area (1), Holland State Wildlife Area (2), Skeater Park (3), Way-Morr County Park (4). Display/hide their locations on the map
In group quarters: 4 (-1 institutionalized population)
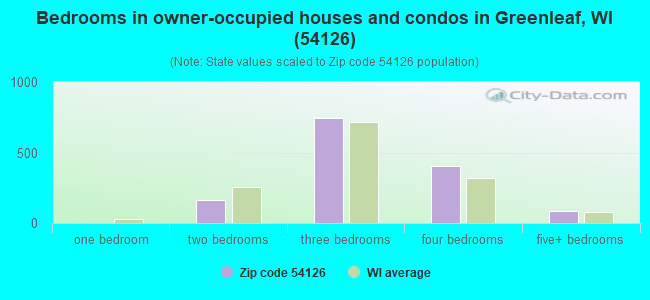
Size of family households: 598 2-persons, 181 3-persons, 247 4-persons, 106 5-persons, 23 6-persons, 13 7-or-more-persons
Size of nonfamily households: 309 1-person, 67 2-persons
752 married couples with children.
97 single-parent households (20 men, 77 women).
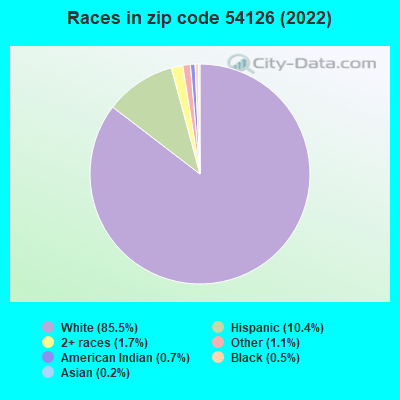
93.3% of residents of 54126 zip code speak English at home.
5.9% of residents speak Spanish at home (15% very well, 49% not well, 35% not at all).
1.1% of residents speak other Indo-European language at home (100% very well).
0.3% of residents speak Asian or Pacific Island language at home (55% very well, 45% well).
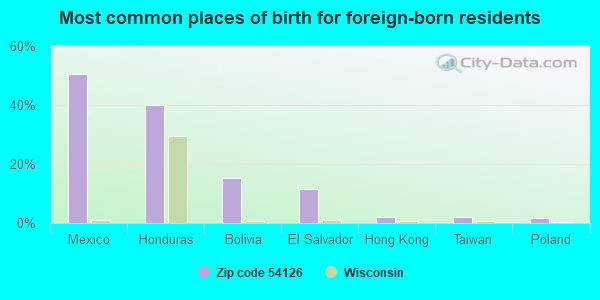
Foreign born population: 237 (5.7%) (16.8% of them are naturalized citizens)
This zip code:
5.7%
Whole state:
5.0%
51%Mexico
40%Honduras
15%Bolivia
11%El Salvador
2%Hong Kong
2%Taiwan
2%Poland
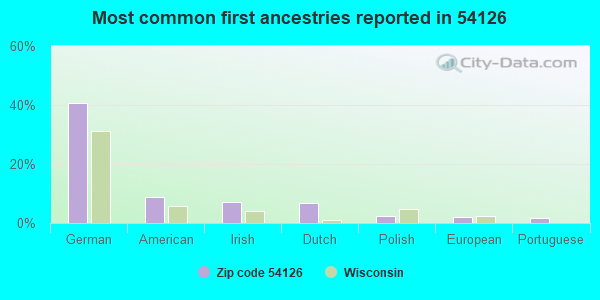
41%German
9%American
7%Irish
7%Dutch
2%Polish
2%European
2%Portuguese
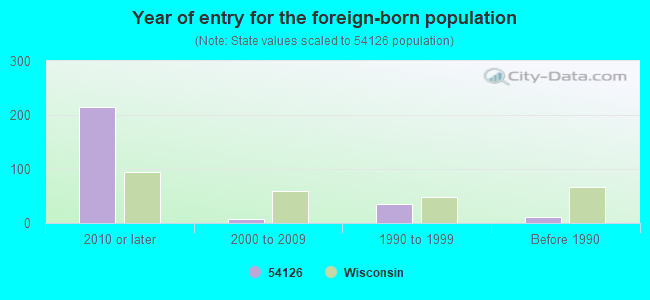
Year of entry for the foreign-born population
2152010 or later
82000 to 2009
361990 to 1999
12Before 1990
Facilities with environmental interests located in this zip code:
BROWN CNTY SOLID WASTE STOCK FARM (1297 HILL RD in GREENLEAF, WI)
Conditionally Exempt Small Quantity Generators, less than 100 kg/month of hazardous waste (Resource Conservation and Recovery Act (tracking hazardous waste)) - notification STATE MASTER (Wisconsin database) - RCRAINFO-WIR000020958, CESQG Organizations: BROWN CNTY SOLID WASTE DEPT (CONTACT/OWNER)
BROWN COUNTY GREENLEAF HIGHWAY GARAGE (STATE HIGHWAY 57 in GREENLEAF, WI)
(Resource Conservation and Recovery Act (tracking hazardous waste)) Alternative names: BROWN COUNTY GREENLEAF HWY GARAGE
Housing units lacking complete plumbing facilities: 1.9% Housing units lacking complete kitchen facilities: 2.0%
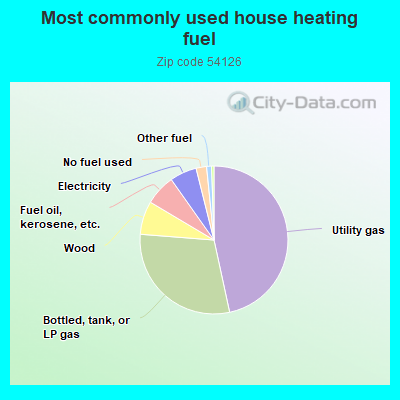
46.7%Utility gas
29.7%Bottled, tank, or LP gas
7.3%Wood
6.7%Fuel oil, kerosene, etc.
5.9%Electricity
2.3%No fuel used
1.1%Other fuel
Population in 1990: 3,443. Population change in the 1990s: +195 (+5.7%).
Place of birth for U.S.-born residents:
This state: 3,582
Northeast: 43
Midwest: 128
South: 39
West: 78
68% of the 54126 zip code residents lived in the same house 5 years ago. Out of people who lived in different houses, 69% lived in this county. Out of people who lived in different counties, 50% lived in Wisconsin.
96% of the 54126 zip code residents lived in the same house 1 year ago. Out of people who lived in different houses, 58% moved from this county. Out of people who lived in different houses, 19% moved from different county within same state. Out of people who lived in different houses, 26% moved from different state.
Private vs. public school enrollment:
Students in private schools in grades 1 to 8 (elementary and middle school): 106
Here:
30.5%
Wisconsin:
16.7%
Students in private schools in grades 9 to 12 (high school): 26
Here:
11.3%
Wisconsin:
12.5%
Students in private undergraduate colleges: 4
Here:
4.9%
Wisconsin:
17.5%
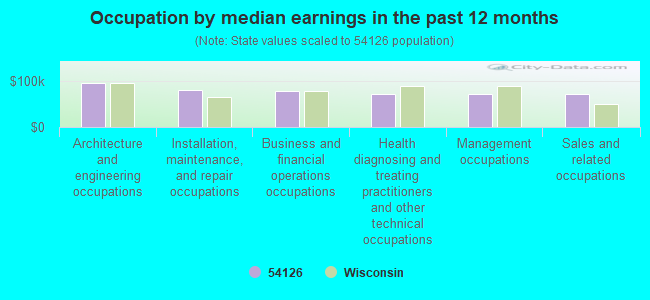
Occupation by median earnings in the past 12 months ($)
94,386Architecture and engineering occupations
80,760Installation, maintenance, and repair occupations
77,383Business and financial operations occupations
71,453Health diagnosing and treating practitioners and other technical occupations
70,574Management occupations
70,281Sales and related occupations
Top industries in this zip code by the number of employees in 2005:
Other Services (except Public Administration): Religious Organizations (20-49 employees: 1 establishment, 10-19 employees: 1 establishment, 5-9 employees: 1 establishment, 1-4 employees: 2 establishments)
Finance and Insurance: Commercial Banking (20-49: 1)
Accommodation and Food Services: Full-Service Restaurants (10-19: 2, 1-4: 1)
Construction: New Single-Family Housing Construction (except Operative Builders) (5-9: 1, 1-4: 3)
Fatal accident statistics in 2013:
Fatal accident count: 1
Vehicles involved in fatal accidents: 1
Fatal accidents caused by drunken drivers: 1
Fatalities: 1
Persons involved in fatal accidents: 3
Pedestrians involved in fatal accidents: 0
Fatal accident statistics in 2010:
Fatal accident count: 3
Vehicles involved in fatal accidents: 3
Fatal accidents caused by drunken drivers: 1
Fatalities: 3
Persons involved in fatal accidents: 4
Pedestrians involved in fatal accidents: 1
Home Mortgage Disclosure Act Aggregated Statistics For Year 2009 (Based on 4 partial tracts)
A) FHA, FSA/RHS & VA Home Purchase Loans
B) Conventional Home Purchase Loans
C) Refinancings
D) Home Improvement Loans
E) Loans on Dwellings For 5+ Families
F) Non-occupant Loans on < 5 Family Dwellings (A B C & D)
G) Loans On Manufactured Home Dwelling (A B C & D)
Number
Average Value
Number
Average Value
Number
Average Value
Number
Average Value
Number
Average Value
Number
Average Value
Number
Average Value
LOANS ORIGINATED
25
$157,505
71
$151,064
510
$151,620
31
$75,389
2
$1,834,075
13
$116,583
4
$46,995
APPLICATIONS APPROVED, NOT ACCEPTED
0
$0
4
$103,360
36
$175,038
2
$102,585
0
$0
2
$86,660
3
$85,380
APPLICATIONS DENIED
4
$104,900
6
$117,472
89
$196,421
4
$21,260
0
$0
6
$235,172
4
$148,605
APPLICATIONS WITHDRAWN
1
$110,420
10
$162,809
69
$186,230
0
$0
0
$0
1
$45,590
1
$69,100
FILES CLOSED FOR INCOMPLETENESS
0
$0
0
$0
21
$168,637
1
$101,160
0
$0
1
$94,750
2
$105,830
Aggregated Statistics For Year 2008 (Based on 4 partial tracts)
A) FHA, FSA/RHS & VA Home Purchase Loans
B) Conventional Home Purchase Loans
C) Refinancings
D) Home Improvement Loans
E) Loans on Dwellings For 5+ Families
F) Non-occupant Loans on < 5 Family Dwellings (A B C & D)
G) Loans On Manufactured Home Dwelling (A B C & D)
Number
Average Value
Number
Average Value
Number
Average Value
Number
Average Value
Number
Average Value
Number
Average Value
Number
Average Value
LOANS ORIGINATED
14
$134,647
84
$143,561
317
$147,825
50
$54,308
1
$1,752,500
20
$140,488
4
$73,475
APPLICATIONS APPROVED, NOT ACCEPTED
0
$0
6
$124,120
32
$157,584
4
$24,095
0
$0
2
$41,415
1
$23,510
APPLICATIONS DENIED
1
$107,570
9
$121,910
94
$166,198
10
$91,596
0
$0
5
$126,542
1
$38,470
APPLICATIONS WITHDRAWN
1
$109,000
4
$167,770
44
$165,741
1
$8,550
0
$0
0
$0
0
$0
FILES CLOSED FOR INCOMPLETENESS
0
$0
1
$140,340
8
$194,552
0
$0
0
$0
0
$0
0
$0
Aggregated Statistics For Year 2007 (Based on 4 partial tracts)
A) FHA, FSA/RHS & VA Home Purchase Loans
B) Conventional Home Purchase Loans
C) Refinancings
D) Home Improvement Loans
E) Loans on Dwellings For 5+ Families
F) Non-occupant Loans on < 5 Family Dwellings (A B C & D)
G) Loans On Manufactured Home Dwelling (A B C & D)
Number
Average Value
Number
Average Value
Number
Average Value
Number
Average Value
Number
Average Value
Number
Average Value
Number
Average Value
LOANS ORIGINATED
3
$121,633
128
$153,148
307
$128,531
61
$49,167
1
$920,420
13
$199,938
7
$40,407
APPLICATIONS APPROVED, NOT ACCEPTED
0
$0
12
$159,482
46
$173,243
4
$27,602
1
$96,170
2
$128,345
1
$39,180
APPLICATIONS DENIED
0
$0
12
$148,016
99
$165,071
12
$56,671
0
$0
5
$368,346
1
$69,100
APPLICATIONS WITHDRAWN
0
$0
10
$163,027
37
$165,824
5
$130,654
0
$0
0
$0
0
$0
FILES CLOSED FOR INCOMPLETENESS
0
$0
1
$185,220
13
$237,894
0
$0
0
$0
1
$92,610
0
$0
Aggregated Statistics For Year 2006 (Based on 4 partial tracts)
A) FHA, FSA/RHS & VA Home Purchase Loans
B) Conventional Home Purchase Loans
C) Refinancings
D) Home Improvement Loans
E) Loans on Dwellings For 5+ Families
F) Non-occupant Loans on < 5 Family Dwellings (A B C & D)
G) Loans On Manufactured Home Dwelling (A B C & D)
Number
Average Value
Number
Average Value
Number
Average Value
Number
Average Value
Number
Average Value
Number
Average Value
Number
Average Value
LOANS ORIGINATED
6
$136,140
183
$141,226
263
$126,754
77
$48,684
1
$19,230
21
$128,105
4
$71,862
APPLICATIONS APPROVED, NOT ACCEPTED
0
$0
13
$174,502
27
$163,527
0
$0
0
$0
1
$149,600
0
$0
APPLICATIONS DENIED
0
$0
10
$123,778
88
$137,987
8
$70,531
0
$0
5
$160,310
4
$130,363
APPLICATIONS WITHDRAWN
0
$0
16
$145,958
36
$142,943
2
$91,185
1
$895,490
2
$193,415
0
$0
FILES CLOSED FOR INCOMPLETENESS
0
$0
4
$107,215
22
$141,246
0
$0
0
$0
2
$197,885
0
$0
Aggregated Statistics For Year 2005 (Based on 4 partial tracts)
A) FHA, FSA/RHS & VA Home Purchase Loans
B) Conventional Home Purchase Loans
C) Refinancings
D) Home Improvement Loans
E) Loans on Dwellings For 5+ Families
F) Non-occupant Loans on < 5 Family Dwellings (A B C & D)
G) Loans On Manufactured Home Dwelling (A B C & D)
Number
Average Value
Number
Average Value
Number
Average Value
Number
Average Value
Number
Average Value
Number
Average Value
Number
Average Value
LOANS ORIGINATED
8
$155,458
166
$150,064
299
$139,043
75
$39,308
1
$1,638,520
20
$213,055
10
$36,040
APPLICATIONS APPROVED, NOT ACCEPTED
0
$0
13
$131,475
23
$140,705
4
$37,972
0
$0
3
$97,080
2
$5,370
APPLICATIONS DENIED
1
$244,350
15
$95,340
64
$115,683
14
$35,799
0
$0
3
$100,210
4
$31,448
APPLICATIONS WITHDRAWN
1
$64,120
17
$164,603
59
$144,148
3
$32,770
0
$0
2
$95,460
0
$0
FILES CLOSED FOR INCOMPLETENESS
0
$0
7
$122,497
25
$158,102
0
$0
0
$0
2
$148,010
0
$0
Aggregated Statistics For Year 2004 (Based on 4 partial tracts)
A) FHA, FSA/RHS & VA Home Purchase Loans
B) Conventional Home Purchase Loans
C) Refinancings
D) Home Improvement Loans
F) Non-occupant Loans on < 5 Family Dwellings (A B C & D)
G) Loans On Manufactured Home Dwelling (A B C & D)
Number
Average Value
Number
Average Value
Number
Average Value
Number
Average Value
Number
Average Value
Number
Average Value
LOANS ORIGINATED
5
$161,992
155
$140,588
401
$131,703
79
$49,803
21
$124,638
8
$88,251
APPLICATIONS APPROVED, NOT ACCEPTED
0
$0
9
$105,584
25
$128,616
0
$0
1
$308,470
0
$0
APPLICATIONS DENIED
1
$116,120
10
$155,927
94
$119,754
8
$80,212
2
$149,250
4
$105,302
APPLICATIONS WITHDRAWN
0
$0
7
$108,507
38
$118,475
4
$57,348
0
$0
0
$0
FILES CLOSED FOR INCOMPLETENESS
0
$0
3
$177,627
27
$120,712
1
$17,810
0
$0
0
$0
Aggregated Statistics For Year 2003 (Based on 4 partial tracts)
A) FHA, FSA/RHS & VA Home Purchase Loans
B) Conventional Home Purchase Loans
C) Refinancings
D) Home Improvement Loans
F) Non-occupant Loans on < 5 Family Dwellings (A B C & D)
Number
Average Value
Number
Average Value
Number
Average Value
Number
Average Value
Number
Average Value
LOANS ORIGINATED
10
$106,365
160
$128,557
843
$134,008
33
$35,388
30
$145,427
APPLICATIONS APPROVED, NOT ACCEPTED
0
$0
5
$112,276
37
$123,264
3
$23,650
6
$194,025
APPLICATIONS DENIED
1
$101,870
15
$121,846
88
$124,514
5
$34,622
7
$149,630
APPLICATIONS WITHDRAWN
0
$0
11
$129,013
65
$109,292
3
$34,767
1
$188,790
FILES CLOSED FOR INCOMPLETENESS
0
$0
1
$194,490
15
$161,119
1
$17,810
1
$71,240
Aggregated Statistics For Year 2002 (Based on 4 partial tracts)
A) FHA, FSA/RHS & VA Home Purchase Loans
B) Conventional Home Purchase Loans
C) Refinancings
D) Home Improvement Loans
E) Loans on Dwellings For 5+ Families
F) Non-occupant Loans on < 5 Family Dwellings (A B C & D)
Number
Average Value
Number
Average Value
Number
Average Value
Number
Average Value
Number
Average Value
Number
Average Value
LOANS ORIGINATED
9
$126,402
136
$142,627
662
$127,463
59
$31,033
0
$0
24
$165,827
APPLICATIONS APPROVED, NOT ACCEPTED
2
$92,795
8
$126,515
39
$138,202
3
$16,617
1
$427,440
6
$148,653
APPLICATIONS DENIED
0
$0
10
$54,523
91
$116,483
4
$8,192
0
$0
5
$127,922
APPLICATIONS WITHDRAWN
0
$0
10
$121,760
51
$145,952
2
$63,760
0
$0
2
$117,900
FILES CLOSED FOR INCOMPLETENESS
0
$0
2
$110,065
12
$116,107
1
$12,820
0
$0
3
$170,740
Aggregated Statistics For Year 2001 (Based on 4 partial tracts)
A) FHA, FSA/RHS & VA Home Purchase Loans
B) Conventional Home Purchase Loans
C) Refinancings
D) Home Improvement Loans
E) Loans on Dwellings For 5+ Families
F) Non-occupant Loans on < 5 Family Dwellings (A B C & D)
Number
Average Value
Number
Average Value
Number
Average Value
Number
Average Value
Number
Average Value
Number
Average Value
LOANS ORIGINATED
12
$100,697
105
$137,405
471
$119,383
44
$30,518
1
$908,310
14
$114,162
APPLICATIONS APPROVED, NOT ACCEPTED
1
$200,900
7
$136,747
35
$133,839
2
$12,220
0
$0
2
$164,090
APPLICATIONS DENIED
2
$109,665
13
$118,155
66
$98,228
14
$35,219
0
$0
2
$234,670
APPLICATIONS WITHDRAWN
2
$58,285
8
$129,224
39
$122,546
2
$53,975
2
$421,795
0
$0
FILES CLOSED FOR INCOMPLETENESS
0
$0
2
$124,650
5
$102,914
2
$21,475
0
$0
0
$0
Aggregated Statistics For Year 2000 (Based on 4 partial tracts)
A) FHA, FSA/RHS & VA Home Purchase Loans
B) Conventional Home Purchase Loans
C) Refinancings
D) Home Improvement Loans
E) Loans on Dwellings For 5+ Families
F) Non-occupant Loans on < 5 Family Dwellings (A B C & D)
Number
Average Value
Number
Average Value
Number
Average Value
Number
Average Value
Number
Average Value
Number
Average Value
LOANS ORIGINATED
5
$111,252
108
$117,069
110
$87,932
82
$29,089
1
$450,240
9
$115,963
APPLICATIONS APPROVED, NOT ACCEPTED
0
$0
4
$81,772
14
$70,534
2
$29,090
0
$0
2
$23,005
APPLICATIONS DENIED
3
$82,827
21
$75,407
47
$101,096
7
$20,679
0
$0
4
$63,048
APPLICATIONS WITHDRAWN
0
$0
4
$104,042
21
$76,711
4
$10,750
0
$0
1
$25,650
FILES CLOSED FOR INCOMPLETENESS
0
$0
0
$0
3
$235,330
0
$0
0
$0
0
$0
Aggregated Statistics For Year 1999 (Based on 2 partial tracts)
A) FHA, FSA/RHS & VA Home Purchase Loans
B) Conventional Home Purchase Loans
C) Refinancings
D) Home Improvement Loans
E) Loans on Dwellings For 5+ Families
F) Non-occupant Loans on < 5 Family Dwellings (A B C & D)
Detailed PMIC statistics for the following Tracts:0214.00
, 0215.00
2004 - 2018 National Fire Incident Reporting System (NFIRS) incidents
According to the data from the years 2004 - 2018 the average number of fires per year is 33. The highest number of reported fire incidents - 94 took place in 2018, and the least - 13 in 2004. The data has a growing trend.
When looking into fire subcategories, the most incidents belonged to: Structure Fires (59.1%), and Outside Fires (24.5%).
Fire incident types reported to NFIRS in Zip Code 54126


+$1,871
-$2,654
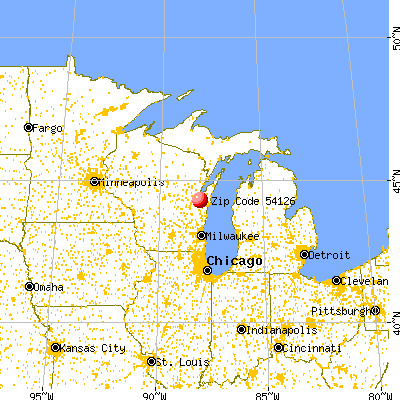
(% of AGI for various income ranges: -21.9% for AGIs below $10k, -2.4% for AGIs $10k-25k, 1.1% for AGIs $25k-50k, 0.9% for AGIs $50k-75k, 1.8% for AGIs $75k-100k, -0.4% for AGIs over 100k) Nearest zip codes: 54110, 54115, 54123, 54180, 54160, 54307.
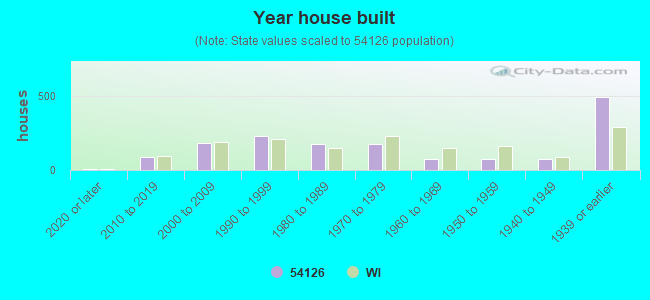


 According to the data from the years 2004 - 2018 the average number of fires per year is 33. The highest number of reported fire incidents - 94 took place in 2018, and the least - 13 in 2004. The data has a growing trend.
 When looking into fire subcategories, the most incidents belonged to: Structure Fires (59.1%), and Outside Fires (24.5%).