Estimated zip code population in 2022: 1,206 Zip code population in 2010: 1,216 Zip code population in 2000: 1,179
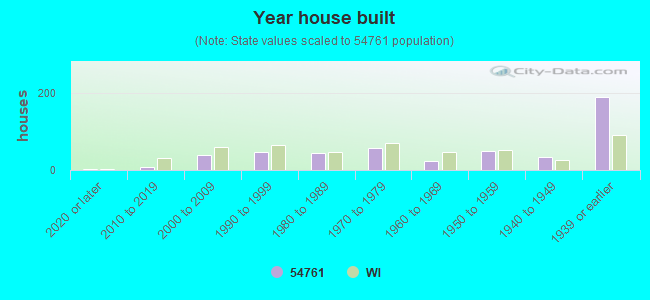
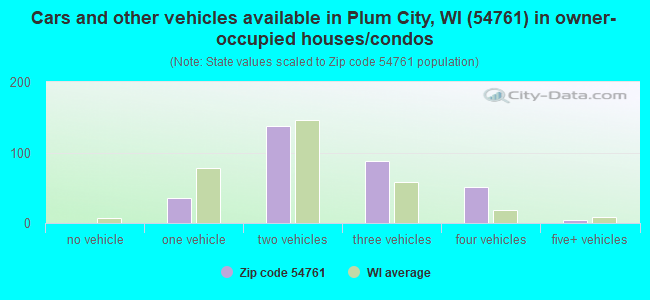
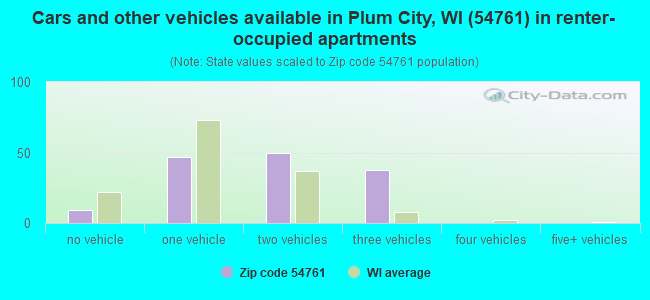
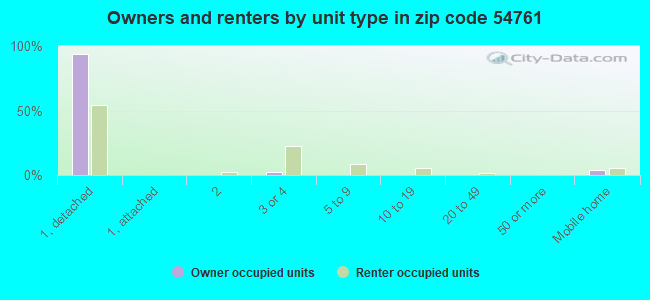
Houses and condos: 502 Renter-occupied apartments: 143
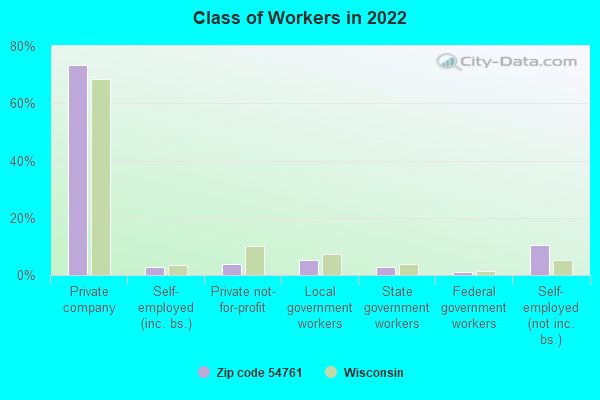
% of renters here:
31%
State:
32%
March 2022 cost of living index in zip code 54761: 95.5 (near average, U.S. average is 100)
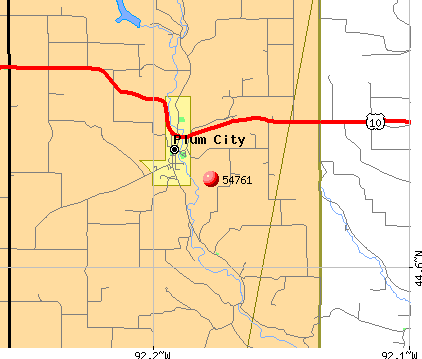
Land area: 40.9 sq. mi. Water area: 0.3 sq. mi.
Population density: 29 people per square mile
(very low).
OSM Map
General Map
Google Map
MSN Map
OSM Map
General Map
Google Map
MSN Map
OSM Map
General Map
Google Map
MSN Map
OSM Map
General Map
Google Map
MSN Map
Please wait while loading the map...
Real estate property taxes paid for housing units in 2022:
This zip code:
1.4% ($2,753)
Wisconsin:
1.4% ($3,497)
Median real estate property taxes paid for housing units with mortgages in 2022: $2,657 (1.3%) Median real estate property taxes paid for housing units with no mortgage in 2022: $2,928 (1.6%)
Business Search- 14 Million verified businesses
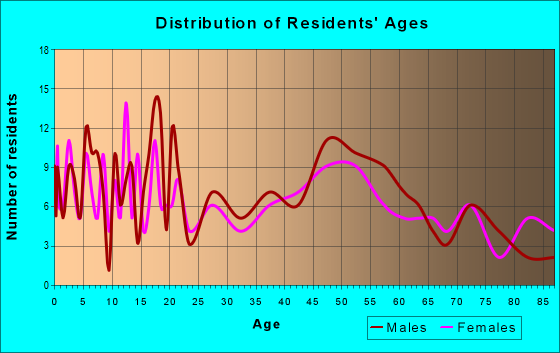
Males: 615
(51.0%)
Females: 591
(49.0%)
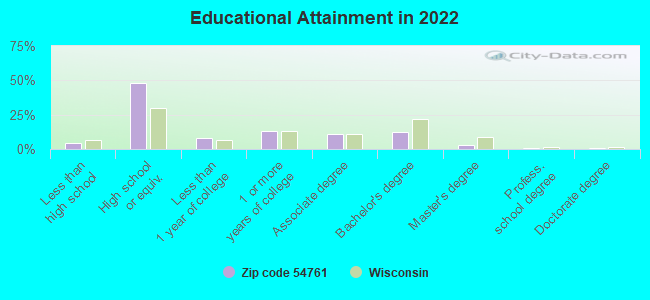
For population 25 years and over in 54761:
High school or higher: 94.8%
Bachelor's degree or higher: 16.2%
Graduate or professional degree: 4.3%
Unemployed: 3.4%
Mean travel time to work (commute): 41.4 minutes
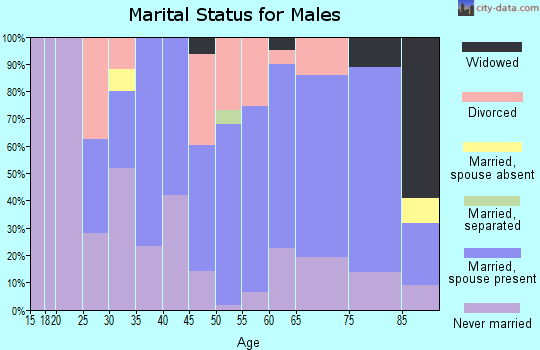
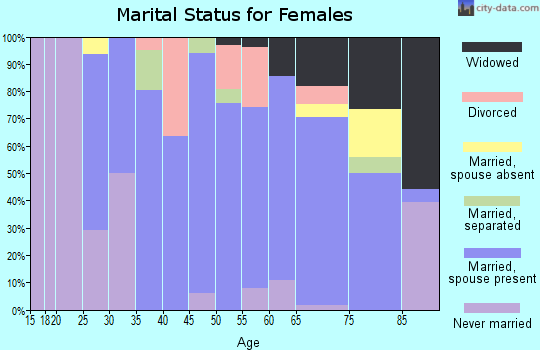
For population 15 years and over in 54761:
Never married: 26.8%
Now married: 55.2%
Separated: 1.4%
Widowed: 7.7%
Divorced: 8.8%
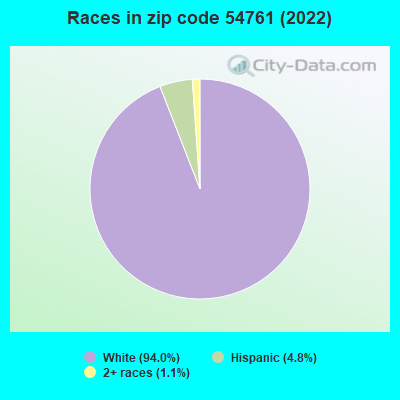
Zip code 54761 compared to state average:
Black race population percentage significantly below state average.
Length of stay since moving in significantly above state average.
Number of college students significantly below state average.
Percentage of population with a bachelor's degree or higher below state average.
Estimated median house/condo value in 2022: $193,260
54761:
$193,260
Wisconsin:
$252,800
According to our research of Wisconsin and other state lists, there were 2 registered sex offenders living in 54761 zip code as of April 27, 2024. The ratio of all residents to sex offenders in zip code 54761 is 598 to 1. The ratio of registered sex offenders to all residents in this zip code is lower than the state average.
Median resident age:
This zip code:
36.8 years
Wisconsin median age:
40.4 years
Average household size:
This zip code:
2.5 people
Wisconsin:
2.3 people
Averages for the 2020 tax year for zip code 54761, filed in 2021:
Average Adjusted Gross Income (AGI) in 2020: $56,524 (Individual Income Tax Returns)
Here:
$56,524
State:
$72,319
Salary/wage: $50,247 (reported on 83.3% of returns)
Here:
$50,247
State:
$59,242
(% of AGI for various income ranges: 1448.9% for AGIs below $25k, 4378.9% for AGIs $25k-50k, 7078.7% for AGIs $50k-75k, 10022.5% for AGIs $75k-100k, 25646.7% for AGIs $100k-200k)
Taxable interest for individuals: $817 (reported on 44.4% of returns)
This zip code:
$817
Wisconsin:
$1,431
(% of AGI for various income ranges: 35.6% for AGIs below $25k, 36.7% for AGIs $25k-50k, 32.5% for AGIs $50k-75k, 125.0% for AGIs $75k-100k, 183.3% for AGIs $100k-200k)
Ordinary dividends: $1,711 (reported on 16.7% of returns)
Here:
$1,711
State:
$6,481
(% of AGI for various income ranges: 31.1% for AGIs below $25k, 57.8% for AGIs $25k-50k, 33.8% for AGIs $50k-75k, 156.7% for AGIs $100k-200k)
Net capital gain/loss in AGI: +$12,527 (reported on 20.4% of returns)
Here:
+$12,527
State:
+$18,329
(% of AGI for various income ranges: 31.1% for AGIs below $25k, 82.2% for AGIs $25k-50k, 356.2% for AGIs $50k-75k, 3303.3% for AGIs $100k-200k)
Profit/loss from business: +$5,771 (reported on 13.0% of returns)
Here:
+$5,771
State:
+$14,562
(% of AGI for various income ranges: 147.8% for AGIs below $25k, 338.8% for AGIs $50k-75k)
Taxable individual retirement arrangement distribution: $10,450 (reported on 7.4% of returns)
54761:
$10,450
Wisconsin:
$19,348
(% of AGI for various income ranges: 186.7% for AGIs below $25k, 312.5% for AGIs $50k-75k)
Earned income credit: $1,667 (reported on 11.1% of returns)
Here:
$1,667
State:
$2,155
(% of AGI for various income ranges: 70.0% for AGIs below $25k, 41.1% for AGIs $25k-50k)
Percentage of individuals using paid preparers for their 2020 taxes: 96.3%
Here:
96%
State:
94%
(% for various income ranges: 93.3% for AGIs below $25k, 100.0% for AGIs $25k-50k, 91.7% for AGIs $50k-75k, 100.0% for AGIs $75k-100k, 100.0% for AGIs $100k-200k)
Averages for the 2012 tax year for zip code 54761, filed in 2013:
Average Adjusted Gross Income (AGI) in 2012: $44,804 (Individual Income Tax Returns)
Here:
$44,804
State:
$57,939
Salary/wage: $39,953 (reported on 81.8% of returns)
Here:
$39,953
State:
$48,248
(% of AGI for various income ranges: 76.9% for AGIs below $25k, 78.9% for AGIs $25k-50k, 75.9% for AGIs $50k-75k, 78.4% for AGIs $75k-100k, 60.1% for AGIs $100k-200k)
Taxable interest for individuals: $984 (reported on 45.5% of returns)
This zip code:
$984
Wisconsin:
$1,224
(% of AGI for various income ranges: 3.4% for AGIs below $25k, 0.9% for AGIs $25k-50k, 1.2% for AGIs $50k-75k, 0.8% for AGIs $75k-100k, 0.2% for AGIs $100k-200k)
Ordinary dividends: $3,009 (reported on 20.0% of returns)
Here:
$3,009
State:
$5,137
(% of AGI for various income ranges: 1.8% for AGIs below $25k, 1.1% for AGIs $25k-50k, 4.3% for AGIs $75k-100k)
Net capital gain/loss in AGI: +$7,645 (reported on 20.0% of returns)
Here:
+$7,645
State:
+$11,137
(% of AGI for various income ranges: 3.6% for AGIs below $25k, 4.1% for AGIs $25k-50k, 10.1% for AGIs $75k-100k)
Profit/loss from business: +$8,771 (reported on 12.7% of returns)
Here:
+$8,771
State:
+$11,943
Taxable individual retirement arrangement distribution: $4,260 (reported on 9.1% of returns)
54761:
$4,260
Wisconsin:
$14,087
(% of AGI for various income ranges: 3.0% for AGIs below $25k, 2.6% for AGIs $25k-50k)
Total itemized deductions: $16,369 (23% of AGI, reported on 29.1% of returns)
Here:
$16,369
State:
$22,257
Here:
22.9% of AGI
State:
20.1% of AGI
(% of AGI for various income ranges: 12.8% for AGIs $25k-50k, 8.3% for AGIs $50k-75k, 12.1% for AGIs $75k-100k, 13.6% for AGIs $100k-200k)
Charity contributions: $1,918 (reported on 20.0% of returns)
Here:
$1,918
State:
$3,370
(% of AGI for various income ranges: 1.1% for AGIs $25k-50k, 0.9% for AGIs $75k-100k, 1.7% for AGIs $100k-200k)
Taxes paid: $7,156 (reported on 29.1% of returns)
54761:
$7,156
State:
$10,731
(% of AGI for various income ranges: 3.0% for AGIs below $25k, 2.7% for AGIs $25k-50k, 3.4% for AGIs $50k-75k, 5.3% for AGIs $75k-100k, 7.3% for AGIs $100k-200k)
Earned income credit: $2,229 (reported on 12.7% of returns)
Here:
$2,229
State:
$2,094
(% of AGI for various income ranges: 6.2% for AGIs below $25k)
Percentage of individuals using paid preparers for their 2012 taxes: 74.5%
Here:
75%
State:
54%
(% for various income ranges: 68.2% for AGIs below $25k, 78.6% for AGIs $25k-50k, 75.0% for AGIs $50k-75k, 83.3% for AGIs $75k-100k, 80.0% for AGIs $100k-200k)
Averages for the 2004 tax year for zip code 54761, filed in 2005:
Average Adjusted Gross Income (AGI) in 2004: $38,189 (Individual Income Tax Returns)
Here:
$38,189
State:
$47,735
Salary/wage: $34,189 (reported on 81.8% of returns)
Here:
$34,189
State:
$41,540
(% of AGI for various income ranges: 117.0% for AGIs below $10k, 75.5% for AGIs $10k-25k, 77.5% for AGIs $25k-50k, 76.0% for AGIs $50k-75k, 76.3% for AGIs $75k-100k, 55.2% for AGIs over 100k)
Taxable interest for individuals: $1,615 (reported on 57.9% of returns)
This zip code:
$1,615
Wisconsin:
$1,420
(% of AGI for various income ranges: 16.0% for AGIs below $10k, 5.1% for AGIs $10k-25k, 2.3% for AGIs $25k-50k, 1.8% for AGIs $50k-75k, 2.5% for AGIs $75k-100k, 0.4% for AGIs over 100k)
Taxable dividends: $1,242 (reported on 23.7% of returns)
Here:
$1,242
State:
$2,869
(% of AGI for various income ranges: 2.8% for AGIs below $10k, 0.4% for AGIs $10k-25k, 1.0% for AGIs $25k-50k, 0.8% for AGIs $50k-75k, 1.3% for AGIs $75k-100k)
Net capital gain/loss: +$9,142 (reported on 24.1% of returns)
Here:
+$9,142
State:
+$9,569
(% of AGI for various income ranges: 3.6% for AGIs below $10k, 3.0% for AGIs $10k-25k, 6.4% for AGIs $25k-50k, 6.2% for AGIs $50k-75k, 13.2% for AGIs $75k-100k)
Profit/loss from business: +$4,099 (reported on 14.6% of returns)
Here:
+$4,099
State:
+$10,417
(% of AGI for various income ranges: 5.8% for AGIs below $10k, 0.3% for AGIs $10k-25k, 3.2% for AGIs $25k-50k, 2.2% for AGIs $50k-75k)
IRA payment deduction: $2,294 (reported on 3.1% of returns)
54761:
$2,294
Wisconsin:
$2,900
Total itemized deductions: $16,356 (24% of AGI, reported on 29.3% of returns)
Here:
$16,356
State:
$18,160
Here:
24.0% of AGI
State:
21.1% of AGI
(% of AGI for various income ranges: 18.3% for AGIs $10k-25k, 10.0% for AGIs $25k-50k, 13.5% for AGIs $50k-75k, 16.9% for AGIs $75k-100k, 9.2% for AGIs over 100k)
Charity contributions deductions: $1,657 (2% of AGI, reported on 25.2% of returns)
Here:
$1,657
State:
$2,711
Here:
2.3% of AGI
State:
3.0% of AGI
(% of AGI for various income ranges: 1.1% for AGIs $10k-25k, 0.9% for AGIs $25k-50k, 0.8% for AGIs $50k-75k, 2.1% for AGIs $75k-100k, 1.0% for AGIs over 100k)
Total tax: $4,198 (reported on 75.4% of returns)
54761:
$4,198
State:
$7,114
(% of AGI for various income ranges: 4.3% for AGIs below $10k, 4.4% for AGIs $10k-25k, 6.6% for AGIs $25k-50k, 8.9% for AGIs $50k-75k, 9.2% for AGIs $75k-100k, 12.0% for AGIs over 100k)
Earned income credit: $1,479 (reported on 12.8% of returns)
Here:
$1,479
State:
$1,544
Percentage of individuals using paid preparers for their 2004 taxes: 71.0%
Here:
71%
State:
57%
(% for various income ranges: 61.7% for AGIs below $10k, 68.3% for AGIs $10k-25k, 71.7% for AGIs $25k-50k, 77.5% for AGIs $50k-75k, 87.2% for AGIs $75k-100k, 82.4% for AGIs over 100k)
Likely homosexual households (counted as self-reported same-sex unmarried-partner households)
Lesbian couples: 1.9% of all households
Gay men: 0.0% of all households
Household received Food Stamps/SNAP in the past 12 months: 49 Household did not receive Food Stamps/SNAP in the past 12 months: 414
Women who had a birth in the past 12 months: 34 (34 now married, 0 unmarried) Women who did not have a birth in the past 12 months: 179 (107 now married, 71 unmarried)
Housing units in zip code 54761 with a mortgage: 165 (14 second mortgage, 8 both second mortgage and home equity loan) Houses without a mortgage: 20
Median monthly owner costs for units with a mortgage: $1,319 Median monthly owner costs for units without a mortgage: $563
Residents with income below the poverty level in 2022:
This zip code:
7.7%
Whole state:
10.7%
Residents with income below 50% of the poverty level in 2022:
This zip code:
4.6%
Whole state:
5.7%
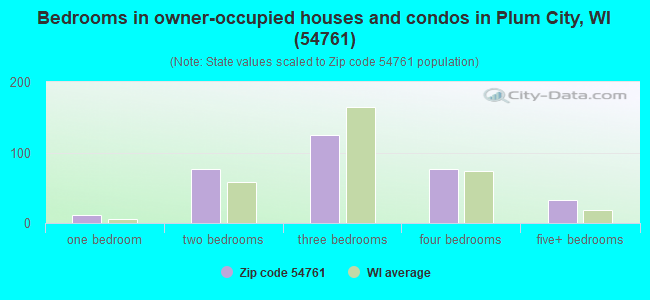
Median number of rooms in houses and condos:
Here:
6.7
State:
6.5
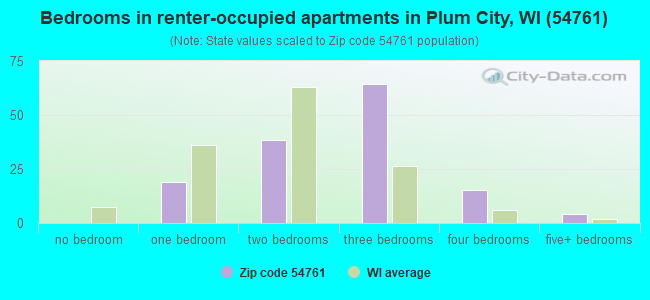
Median number of rooms in apartments:
Here:
5.5
State:
4.1
Notable locations in this zip code not listed on our city pages
Notable locations in zip code 54761: Maiden Rock - Plum City - Stockholm Emergency Medical Services (A), Plum City - Township of Union Fire Department (B). Display/hide their locations on the map
In group quarters: 43 (-1 institutionalized population)
Size of family households: 127 2-persons, 79 3-persons, 51 4-persons, 24 5-persons, 9 6-persons, 2 7-or-more-persons
Size of nonfamily households: 140 1-person, 25 2-persons, 2 3-persons
242 married couples with children.
55 single-parent households (37 men, 18 women).
94.5% of residents of 54761 zip code speak English at home.
4.2% of residents speak Spanish at home (30% very well, 17% well, 15% not well, 37% not at all).
1.5% of residents speak other Indo-European language at home (100% very well).
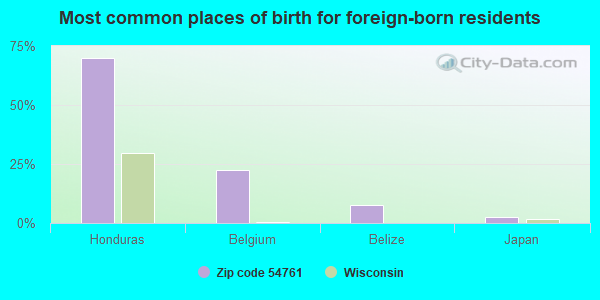
Foreign born population: 40 (3.4%) (22.0% of them are naturalized citizens)
This zip code:
3.4%
Whole state:
5.0%
70%Honduras
22%Belgium
8%Belize
2%Japan
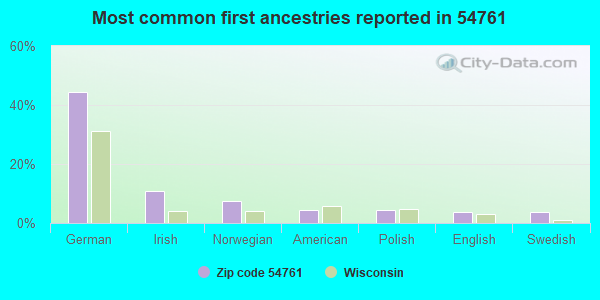
45%German
11%Irish
7%Norwegian
4%American
4%Polish
4%English
4%Swedish
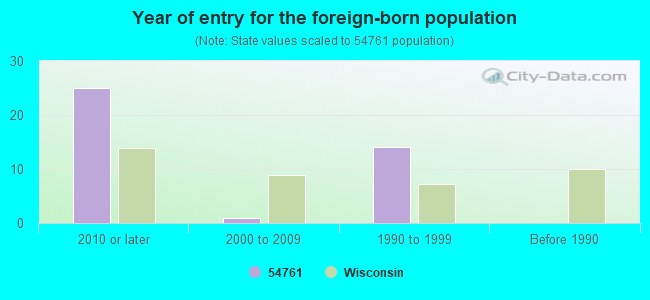
Year of entry for the foreign-born population
252010 or later
12000 to 2009
141990 to 1999
0Before 1990
Facilities with environmental interests located in this zip code:
CORNER GARAGE (301 1ST ST EAST in PLUM CITY, WI)
Small Quantity Generators, between 100 kg and 1000 kg of hazardous waste/month (Resource Conservation and Recovery Act (tracking hazardous waste)) - notification Organizations: ROLAND ECCLES PLUM CITY FEED (CONTACT/OWNER)
Housing units lacking complete plumbing facilities: 0.3% Housing units lacking complete kitchen facilities: 1.4%
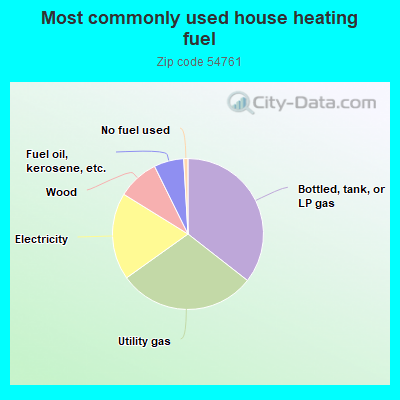
35.6%Bottled, tank, or LP gas
29.6%Utility gas
18.7%Electricity
8.9%Wood
6.4%Fuel oil, kerosene, etc.
0.9%No fuel used
Population in 1990: 1,050. Population change in the 1990s: +129 (+12.3%).
Place of birth for U.S.-born residents:
This state: 615
Northeast: 51
Midwest: 449
South: 5
West: 49
72% of the 54761 zip code residents lived in the same house 5 years ago. Out of people who lived in different houses, 49% lived in this county. Out of people who lived in different counties, 50% lived in Wisconsin.
93% of the 54761 zip code residents lived in the same house 1 year ago. Out of people who lived in different houses, 36% moved from this county. Out of people who lived in different houses, 20% moved from different county within same state. Out of people who lived in different houses, 38% moved from different state. Out of people who lived in different houses, 11% moved from abroad.
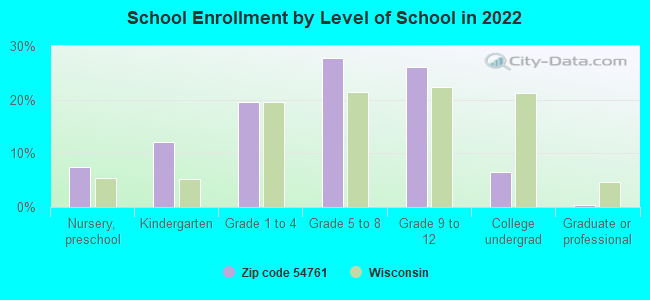
Private vs. public school enrollment:
Students in private schools in grades 1 to 8 (elementary and middle school): 17
Here:
15.9%
Wisconsin:
16.7%
Students in private schools in grades 9 to 12 (high school): 3
Here:
6.0%
Wisconsin:
12.5%
Students in private undergraduate colleges: 1
Here:
12.0%
Wisconsin:
17.5%
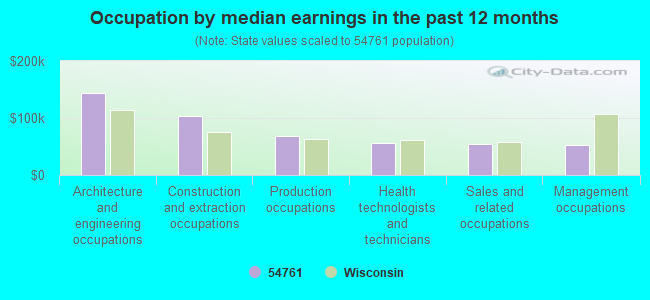
Occupation by median earnings in the past 12 months ($)
143,264Architecture and engineering occupations
103,175Construction and extraction occupations
67,577Production occupations
56,865Health technologists and technicians
54,448Sales and related occupations
53,318Management occupations
Companies with federal contracts located in this zip code:
EMILY JEAN GILLES (132 BIRCH AVENUE in PLUM CITY, WI; small business) : $72 in 3 contractsin 2002
$1,353 with U.S. Army Corps of Engineers - civil program financing only for Technical Assistance. Signed on 2002-02-25. Completion date: 2002-05-31.
$0, same as above.Signed on 2002-06-14. Completion date: 2002-05-31.
-$1,281, same as above.Signed on 2002-06-14. Completion date: 2002-05-31.
Top industries in this zip code by the number of employees in 2005:
Health Care and Social Assistance: Nursing Care Facilities (50-99 employees: 1 establishment)
Accommodation and Food Services: Full-Service Restaurants (10-19: 2)
Other Services (except Public Administration): Religious Organizations (10-19: 1, 1-4: 1)
Health Care and Social Assistance: Homes for the Elderly (10-19: 1)
People in group quarters in 2010:
42 people in nursing facilities/skilled-nursing facilities
People in group quarters in 2000:
39 people in nursing homes
8 people in other noninstitutional group quarters
Fatal accident statistics in 2014:
Fatal accident count: 1
Vehicles involved in fatal accidents: 2
Fatal accidents caused by drunken drivers: 0
Fatalities: 1
Persons involved in fatal accidents: 2
Pedestrians involved in fatal accidents: 0
Home Mortgage Disclosure Act Aggregated Statistics For Year 2009 (Based on 2 partial tracts)
A) FHA, FSA/RHS & VA Home Purchase Loans
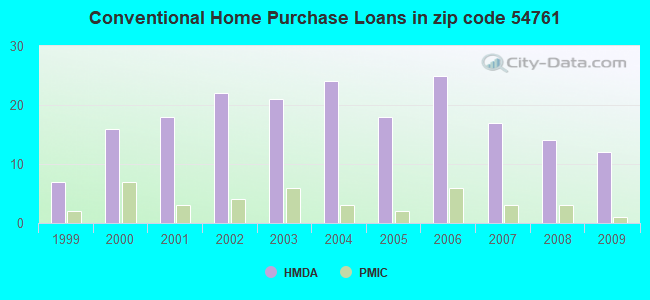
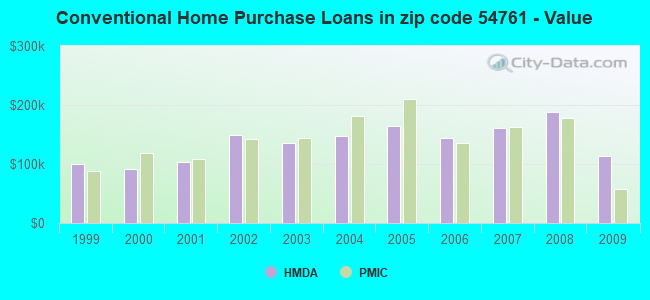
B) Conventional Home Purchase Loans
C) Refinancings
D) Home Improvement Loans
F) Non-occupant Loans on < 5 Family Dwellings (A B C & D)
G) Loans On Manufactured Home Dwelling (A B C & D)
Number
Average Value
Number
Average Value
Number
Average Value
Number
Average Value
Number
Average Value
Number
Average Value
LOANS ORIGINATED
2
$164,805
12
$112,953
55
$152,769
4
$43,892
2
$147,485
2
$76,550
APPLICATIONS APPROVED, NOT ACCEPTED
0
$0
0
$0
4
$134,372
1
$74,910
0
$0
0
$0
APPLICATIONS DENIED
0
$0
2
$126,180
17
$160,235
1
$23,880
1
$154,040
1
$148,420
APPLICATIONS WITHDRAWN
1
$192,430
2
$189,385
10
$181,802
0
$0
0
$0
0
$0
FILES CLOSED FOR INCOMPLETENESS
0
$0
0
$0
1
$236,910
0
$0
0
$0
0
$0
Aggregated Statistics For Year 2008 (Based on 2 partial tracts)
A) FHA, FSA/RHS & VA Home Purchase Loans
B) Conventional Home Purchase Loans
C) Refinancings
D) Home Improvement Loans
F) Non-occupant Loans on < 5 Family Dwellings (A B C & D)
G) Loans On Manufactured Home Dwelling (A B C & D)
Number
Average Value
Number
Average Value
Number
Average Value
Number
Average Value
Number
Average Value
Number
Average Value
LOANS ORIGINATED
1
$252,830
14
$188,718
33
$144,220
6
$39,642
6
$310,338
2
$122,435
APPLICATIONS APPROVED, NOT ACCEPTED
0
$0
0
$0
5
$177,542
1
$64,610
0
$0
1
$137,650
APPLICATIONS DENIED
0
$0
2
$183,770
21
$175,040
1
$132,970
0
$0
1
$177,920
APPLICATIONS WITHDRAWN
0
$0
3
$132,657
12
$233,008
0
$0
1
$746,310
0
$0
FILES CLOSED FOR INCOMPLETENESS
0
$0
1
$174,170
3
$212,093
0
$0
0
$0
1
$192,900
Aggregated Statistics For Year 2007 (Based on 2 partial tracts)
A) FHA, FSA/RHS & VA Home Purchase Loans
B) Conventional Home Purchase Loans
C) Refinancings
D) Home Improvement Loans
F) Non-occupant Loans on < 5 Family Dwellings (A B C & D)
Number
Average Value
Number
Average Value
Number
Average Value
Number
Average Value
Number
Average Value
LOANS ORIGINATED
1
$173,700
17
$161,612
42
$170,146
7
$56,719
8
$184,646
APPLICATIONS APPROVED, NOT ACCEPTED
0
$0
3
$188,997
7
$208,951
0
$0
0
$0
APPLICATIONS DENIED
0
$0
3
$144,673
22
$194,175
8
$106,340
1
$117,050
APPLICATIONS WITHDRAWN
0
$0
2
$279,515
13
$160,845
1
$352,090
0
$0
FILES CLOSED FOR INCOMPLETENESS
0
$0
0
$0
2
$137,650
0
$0
0
$0
Aggregated Statistics For Year 2006 (Based on 2 partial tracts)
A) FHA, FSA/RHS & VA Home Purchase Loans
B) Conventional Home Purchase Loans
C) Refinancings
D) Home Improvement Loans
F) Non-occupant Loans on < 5 Family Dwellings (A B C & D)
G) Loans On Manufactured Home Dwelling (A B C & D)
Number
Average Value
Number
Average Value
Number
Average Value
Number
Average Value
Number
Average Value
Number
Average Value
LOANS ORIGINATED
2
$175,575
25
$143,288
39
$129,475
14
$57,221
4
$120,678
5
$76,036
APPLICATIONS APPROVED, NOT ACCEPTED
0
$0
1
$201,790
7
$120,194
0
$0
0
$0
0
$0
APPLICATIONS DENIED
0
$0
7
$109,960
29
$149,727
2
$111,900
0
$0
1
$26,220
APPLICATIONS WITHDRAWN
0
$0
7
$117,317
12
$136,519
1
$179,790
1
$29,960
0
$0
FILES CLOSED FOR INCOMPLETENESS
0
$0
0
$0
7
$210,490
0
$0
0
$0
1
$150,290
Aggregated Statistics For Year 2005 (Based on 2 partial tracts)
A) FHA, FSA/RHS & VA Home Purchase Loans
B) Conventional Home Purchase Loans
C) Refinancings
D) Home Improvement Loans
F) Non-occupant Loans on < 5 Family Dwellings (A B C & D)
G) Loans On Manufactured Home Dwelling (A B C & D)
Number
Average Value
Number
Average Value
Number
Average Value
Number
Average Value
Number
Average Value
Number
Average Value
LOANS ORIGINATED
1
$119,860
18
$164,130
74
$134,595
11
$63,250
7
$139,590
7
$111,499
APPLICATIONS APPROVED, NOT ACCEPTED
0
$0
1
$118,450
3
$137,650
1
$34,180
0
$0
0
$0
APPLICATIONS DENIED
0
$0
6
$117,675
19
$146,547
3
$82,090
1
$68,360
2
$36,050
APPLICATIONS WITHDRAWN
0
$0
2
$162,935
13
$156,631
2
$414,825
1
$94,110
0
$0
FILES CLOSED FOR INCOMPLETENESS
0
$0
1
$46,820
8
$199,746
0
$0
0
$0
0
$0
Aggregated Statistics For Year 2004 (Based on 2 partial tracts)
A) FHA, FSA/RHS & VA Home Purchase Loans
B) Conventional Home Purchase Loans
C) Refinancings
D) Home Improvement Loans
F) Non-occupant Loans on < 5 Family Dwellings (A B C & D)
G) Loans On Manufactured Home Dwelling (A B C & D)
Number
Average Value
Number
Average Value
Number
Average Value
Number
Average Value
Number
Average Value
Number
Average Value
LOANS ORIGINATED
1
$237,380
24
$147,815
62
$136,231
14
$68,759
6
$153,648
5
$51,128
APPLICATIONS APPROVED, NOT ACCEPTED
0
$0
3
$193,833
10
$142,707
0
$0
1
$209,290
0
$0
APPLICATIONS DENIED
0
$0
6
$101,600
29
$134,745
5
$81,466
2
$176,980
4
$114,592
APPLICATIONS WITHDRAWN
0
$0
1
$191,490
19
$127,523
4
$78,658
0
$0
1
$143,270
FILES CLOSED FOR INCOMPLETENESS
0
$0
0
$0
9
$190,818
0
$0
0
$0
0
$0
Aggregated Statistics For Year 2003 (Based on 2 partial tracts)
B) Conventional Home Purchase Loans
C) Refinancings
D) Home Improvement Loans
F) Non-occupant Loans on < 5 Family Dwellings (A B C & D)
Number
Average Value
Number
Average Value
Number
Average Value
Number
Average Value
LOANS ORIGINATED
21
$135,154
100
$128,221
8
$26,395
3
$204,917
APPLICATIONS APPROVED, NOT ACCEPTED
1
$60,870
7
$124,876
1
$98,320
0
$0
APPLICATIONS DENIED
7
$62,471
23
$136,714
3
$24,970
2
$155,910
APPLICATIONS WITHDRAWN
2
$149,825
12
$122,747
0
$0
0
$0
FILES CLOSED FOR INCOMPLETENESS
1
$56,180
3
$166,523
0
$0
0
$0
Aggregated Statistics For Year 2002 (Based on 2 partial tracts)
A) FHA, FSA/RHS & VA Home Purchase Loans
B) Conventional Home Purchase Loans
C) Refinancings
D) Home Improvement Loans
F) Non-occupant Loans on < 5 Family Dwellings (A B C & D)
Number
Average Value
Number
Average Value
Number
Average Value
Number
Average Value
Number
Average Value
LOANS ORIGINATED
2
$118,220
22
$149,270
78
$108,328
3
$49,003
4
$115,645
APPLICATIONS APPROVED, NOT ACCEPTED
0
$0
2
$102,770
5
$118,454
0
$0
0
$0
APPLICATIONS DENIED
0
$0
3
$60,710
18
$88,672
1
$27,160
0
$0
APPLICATIONS WITHDRAWN
0
$0
2
$153,335
10
$99,633
0
$0
0
$0
FILES CLOSED FOR INCOMPLETENESS
0
$0
0
$0
5
$130,534
0
$0
0
$0
Aggregated Statistics For Year 2001 (Based on 2 partial tracts)
A) FHA, FSA/RHS & VA Home Purchase Loans
B) Conventional Home Purchase Loans
C) Refinancings
D) Home Improvement Loans
Number
Average Value
Number
Average Value
Number
Average Value
Number
Average Value
LOANS ORIGINATED
1
$139,520
18
$102,848
63
$97,549
2
$12,405
APPLICATIONS APPROVED, NOT ACCEPTED
1
$98,790
1
$103,000
4
$93,990
1
$44,010
APPLICATIONS DENIED
1
$78,660
5
$66,672
22
$79,424
2
$18,960
APPLICATIONS WITHDRAWN
0
$0
1
$65,550
8
$81,642
0
$0
FILES CLOSED FOR INCOMPLETENESS
0
$0
0
$0
3
$75,537
0
$0
Aggregated Statistics For Year 2000 (Based on 2 partial tracts)
A) FHA, FSA/RHS & VA Home Purchase Loans
B) Conventional Home Purchase Loans
C) Refinancings
D) Home Improvement Loans
F) Non-occupant Loans on < 5 Family Dwellings (A B C & D)
Number
Average Value
Number
Average Value
Number
Average Value
Number
Average Value
Number
Average Value
LOANS ORIGINATED
1
$101,130
16
$92,352
23
$74,322
5
$53,562
2
$64,845
APPLICATIONS APPROVED, NOT ACCEPTED
0
$0
2
$60,865
1
$130,630
0
$0
0
$0
APPLICATIONS DENIED
0
$0
10
$67,983
16
$55,014
3
$16,543
1
$98,790
APPLICATIONS WITHDRAWN
0
$0
2
$81,935
7
$70,497
0
$0
0
$0
FILES CLOSED FOR INCOMPLETENESS
0
$0
1
$47,290
2
$99,260
0
$0
0
$0
Aggregated Statistics For Year 1999 (Based on 1 partial tract)
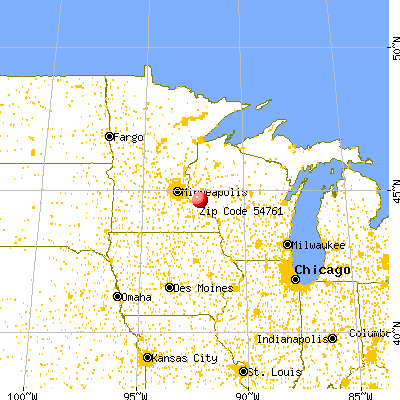


 Nearest zip codes: 54721, 54769, 54750, 54740, 54759, 55026.