Estimated zip code population in 2022: 903 Zip code population in 2010: 990 Zip code population in 2000: 891
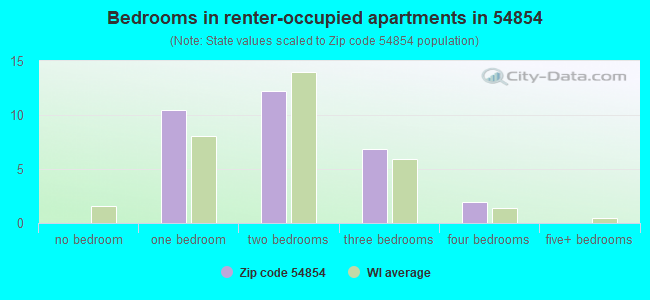
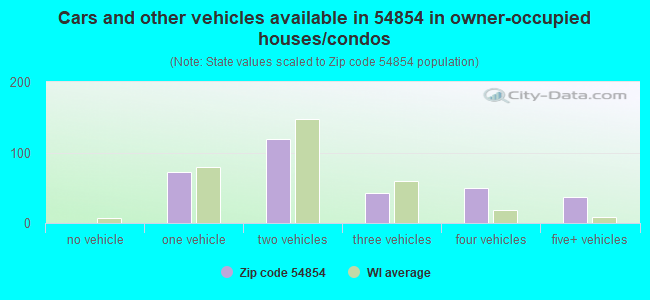
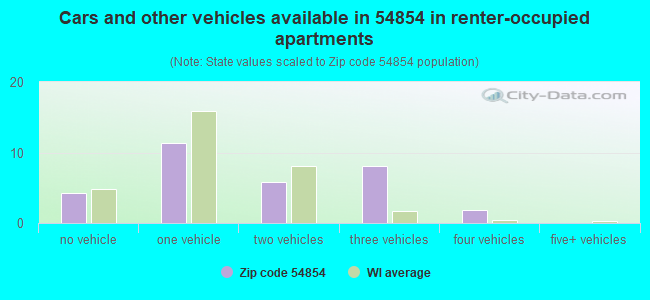
Houses and condos: 433 Renter-occupied apartments: 31
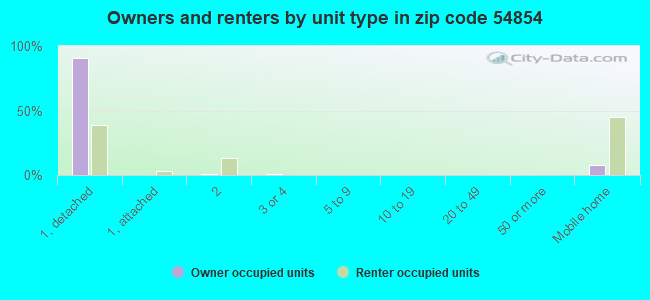
% of renters here:
9%
State:
32%
March 2022 cost of living index in zip code 54854: 85.8 (less than average, U.S. average is 100)
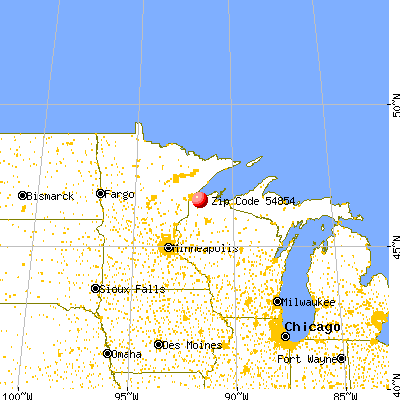
Land area: 79.8 sq. mi. Water area: 4.7 sq. mi.
Population density: 11 people per square mile
(very low).
OSM Map
General Map
Google Map
MSN Map
OSM Map
General Map
Google Map
MSN Map
OSM Map
General Map
Google Map
MSN Map
OSM Map
General Map
Google Map
MSN Map
Please wait while loading the map...
Real estate property taxes paid for housing units in 2022:
This zip code:
1.1% ($2,150)
Wisconsin:
1.4% ($3,497)
Median real estate property taxes paid for housing units with mortgages in 2022: $2,383 (1.0%) Median real estate property taxes paid for housing units with no mortgage in 2022: $1,842 (1.1%)
Business Search- 14 Million verified businesses
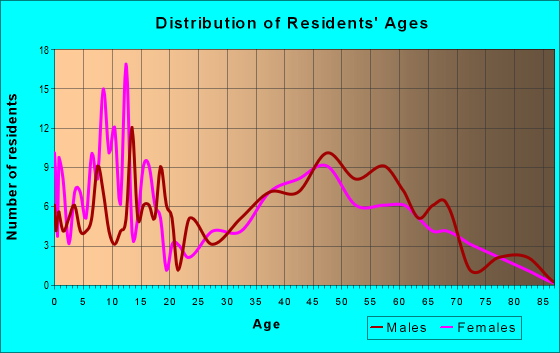
Males: 491
(54.4%)
Females: 412
(45.6%)
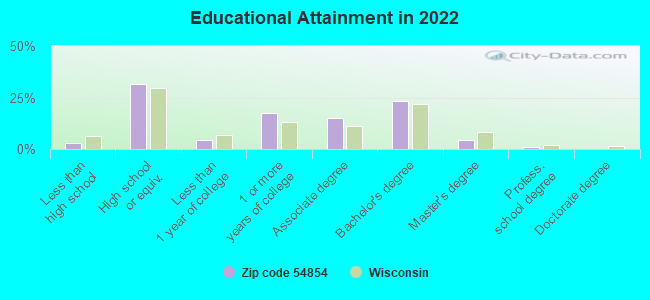
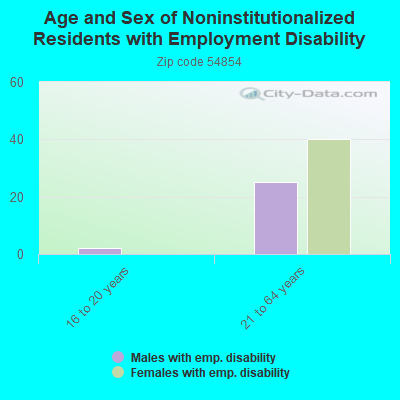
For population 25 years and over in 54854:
High school or higher: 96.4%
Bachelor's degree or higher: 28.2%
Graduate or professional degree: 5.2%
Unemployed: 2.8%
Mean travel time to work (commute): 33.2 minutes
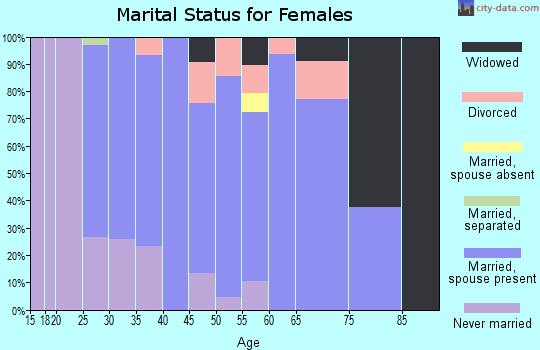
For population 15 years and over in 54854:
Never married: 28.4%
Now married: 58.9%
Separated: 0.0%
Widowed: 2.7%
Divorced: 10.1%
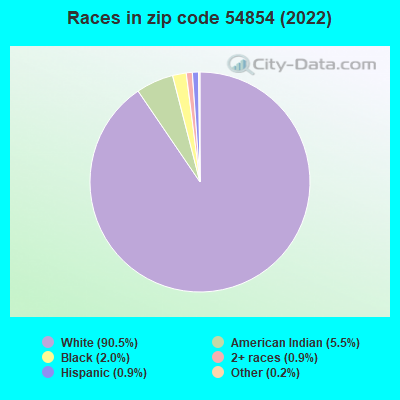
Zip code 54854 compared to state average:
Black race population percentage significantly below state average.
Hispanic race population percentage significantly below state average.
Foreign-born population percentage significantly below state average.
Renting percentage significantly below state average.
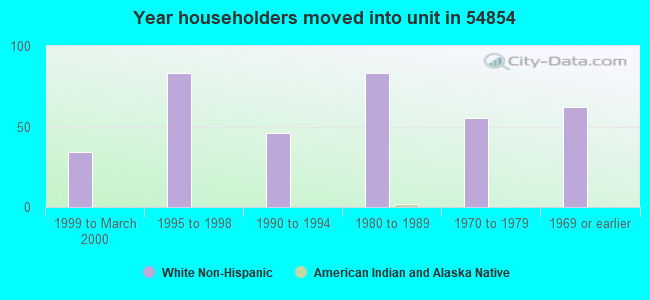
Length of stay since moving in significantly above state average.
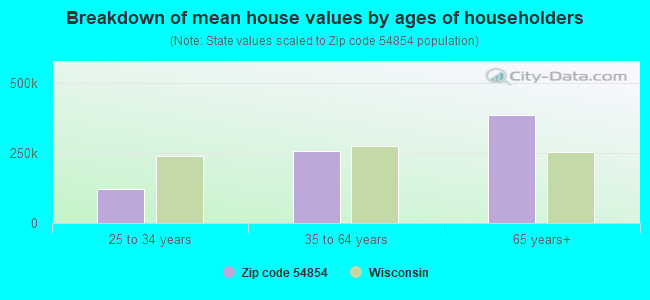
Estimated median house/condo value in 2022: $195,773
54854:
$195,773
Wisconsin:
$252,800
According to our research of Wisconsin and other state lists, there were 2 registered sex offenders living in 54854 zip code as of April 27, 2024. The ratio of all residents to sex offenders in zip code 54854 is 473 to 1. The ratio of registered sex offenders to all residents in this zip code is lower than the state average.
Median resident age:
This zip code:
42.6 years
Wisconsin median age:
40.4 years
Average household size:
This zip code:
2.6 people
Wisconsin:
2.3 people
Averages for the 2020 tax year for zip code 54854, filed in 2021:
Average Adjusted Gross Income (AGI) in 2020: $62,198 (Individual Income Tax Returns)
Here:
$62,198
State:
$72,319
Salary/wage: $54,811 (reported on 83.3% of returns)
Here:
$54,811
State:
$59,242
(% of AGI for various income ranges: 1173.8% for AGIs below $25k, 3625.0% for AGIs $25k-50k, 6215.7% for AGIs $50k-75k, 8493.3% for AGIs $75k-100k, 16892.0% for AGIs $100k-200k)
Taxable interest for individuals: $346 (reported on 31.0% of returns)
This zip code:
$346
Wisconsin:
$1,431
(% of AGI for various income ranges: 8.8% for AGIs below $25k, 14.3% for AGIs $50k-75k, 56.0% for AGIs $100k-200k)
Ordinary dividends: $1,986 (reported on 16.7% of returns)
Here:
$1,986
State:
$6,481
(% of AGI for various income ranges: 71.4% for AGIs $50k-75k, 178.0% for AGIs $100k-200k)
Net capital gain/loss in AGI: +$6,800 (reported on 14.3% of returns)
Here:
+$6,800
State:
+$18,329
(% of AGI for various income ranges: 41.2% for AGIs $25k-50k, 750.0% for AGIs $100k-200k)
Profit/loss from business: +$2,917 (reported on 14.3% of returns)
Here:
+$2,917
State:
+$14,562
(% of AGI for various income ranges: 138.8% for AGIs below $25k, 91.4% for AGIs $50k-75k)
Taxable individual retirement arrangement distribution: $13,820 (reported on 11.9% of returns)
54854:
$13,820
Wisconsin:
$19,348
(% of AGI for various income ranges: 155.0% for AGIs below $25k, 1134.0% for AGIs $100k-200k)
Earned income credit: $1,967 (reported on 14.3% of returns)
Here:
$1,967
State:
$2,155
(% of AGI for various income ranges: 80.0% for AGIs below $25k, 67.5% for AGIs $25k-50k)
Percentage of individuals using paid preparers for their 2020 taxes: 97.6%
Here:
98%
State:
94%
(% for various income ranges: 100.0% for AGIs below $25k, 100.0% for AGIs $25k-50k, 88.9% for AGIs $50k-75k, 100.0% for AGIs $75k-100k, 100.0% for AGIs $100k-200k)
Averages for the 2012 tax year for zip code 54854, filed in 2013:
Average Adjusted Gross Income (AGI) in 2012: $48,202 (Individual Income Tax Returns)
Here:
$48,202
State:
$57,939
Salary/wage: $44,029 (reported on 82.9% of returns)
Here:
$44,029
State:
$48,248
(% of AGI for various income ranges: 78.6% for AGIs below $25k, 77.4% for AGIs $25k-50k, 79.6% for AGIs $50k-75k, 88.4% for AGIs $75k-100k, 65.5% for AGIs $100k-200k)
Taxable interest for individuals: $244 (reported on 39.0% of returns)
This zip code:
$244
Wisconsin:
$1,224
(% of AGI for various income ranges: 0.2% for AGIs below $25k, 0.5% for AGIs $25k-50k, 0.2% for AGIs $50k-75k, 0.2% for AGIs $100k-200k)
Ordinary dividends: $743 (reported on 17.1% of returns)
Here:
$743
State:
$5,137
Net capital gain/loss in AGI: +$2,700 (reported on 9.8% of returns)
Here:
+$2,700
State:
+$11,137
Profit/loss from business: +$7,483 (reported on 14.6% of returns)
Here:
+$7,483
State:
+$11,943
Taxable individual retirement arrangement distribution: $6,550 (reported on 4.9% of returns)
54854:
$6,550
Wisconsin:
$14,087
Total itemized deductions: $19,067 (21% of AGI, reported on 29.3% of returns)
Here:
$19,067
State:
$22,257
Here:
21.0% of AGI
State:
20.1% of AGI
(% of AGI for various income ranges: 10.9% for AGIs $25k-50k, 10.4% for AGIs $50k-75k, 13.5% for AGIs $75k-100k, 14.7% for AGIs $100k-200k)
Charity contributions: $2,056 (reported on 22.0% of returns)
Here:
$2,056
State:
$3,370
(% of AGI for various income ranges: 1.6% for AGIs $50k-75k, 1.6% for AGIs $100k-200k)
Taxes paid: $8,183 (reported on 29.3% of returns)
54854:
$8,183
State:
$10,731
(% of AGI for various income ranges: 3.5% for AGIs $25k-50k, 4.1% for AGIs $50k-75k, 5.5% for AGIs $75k-100k, 7.3% for AGIs $100k-200k)
Earned income credit: $2,486 (reported on 17.1% of returns)
Here:
$2,486
State:
$2,094
(% of AGI for various income ranges: 10.2% for AGIs below $25k)
Percentage of individuals using paid preparers for their 2012 taxes: 48.8%
Here:
49%
State:
54%
(% for various income ranges: 40.0% for AGIs below $25k, 55.6% for AGIs $25k-50k, 50.0% for AGIs $50k-75k, 50.0% for AGIs $75k-100k, 60.0% for AGIs $100k-200k)
Averages for the 2004 tax year for zip code 54854, filed in 2005:
Average Adjusted Gross Income (AGI) in 2004: $36,850 (Individual Income Tax Returns)
Here:
$36,850
State:
$47,735
Salary/wage: $34,263 (reported on 85.5% of returns)
Here:
$34,263
State:
$41,540
(% of AGI for various income ranges: 87.4% for AGIs below $10k, 68.3% for AGIs $10k-25k, 83.0% for AGIs $25k-50k, 80.0% for AGIs $50k-75k, 80.5% for AGIs $75k-100k, 77.6% for AGIs over 100k)
Taxable interest for individuals: $464 (reported on 52.5% of returns)
This zip code:
$464
Wisconsin:
$1,420
(% of AGI for various income ranges: 1.0% for AGIs below $10k, 2.3% for AGIs $10k-25k, 0.6% for AGIs $25k-50k, 0.3% for AGIs $50k-75k, 0.4% for AGIs $75k-100k, 0.3% for AGIs over 100k)
Taxable dividends: $884 (reported on 16.2% of returns)
Here:
$884
State:
$2,869
(% of AGI for various income ranges: 0.9% for AGIs $10k-25k, 0.1% for AGIs $25k-50k, 0.3% for AGIs $50k-75k, 0.9% for AGIs $75k-100k)
Net capital gain/loss: +$340 (reported on 12.4% of returns)
Here:
+$340
State:
+$9,569
(% of AGI for various income ranges: 0.5% for AGIs below $10k, 0.3% for AGIs $25k-50k, 0.1% for AGIs $50k-75k, 0.1% for AGIs $75k-100k)
Profit/loss from business: +$4,873 (reported on 12.9% of returns)
Here:
+$4,873
State:
+$10,417
IRA payment deduction: $1,438 (reported on 3.7% of returns)
54854:
$1,438
Wisconsin:
$2,900
Total itemized deductions: $14,380 (22% of AGI, reported on 28.3% of returns)
Here:
$14,380
State:
$18,160
Here:
22.0% of AGI
State:
21.1% of AGI
(% of AGI for various income ranges: 8.4% for AGIs $10k-25k, 8.6% for AGIs $25k-50k, 12.3% for AGIs $50k-75k, 13.2% for AGIs $75k-100k, 15.4% for AGIs over 100k)
Charity contributions deductions: $1,684 (2% of AGI, reported on 22.2% of returns)
Here:
$1,684
State:
$2,711
Here:
2.4% of AGI
State:
3.0% of AGI
(% of AGI for various income ranges: 0.8% for AGIs $25k-50k, 1.5% for AGIs $50k-75k, 0.9% for AGIs $75k-100k, 1.7% for AGIs over 100k)
Total tax: $3,927 (reported on 76.8% of returns)
54854:
$3,927
State:
$7,114
(% of AGI for various income ranges: 3.1% for AGIs below $10k, 4.8% for AGIs $10k-25k, 6.1% for AGIs $25k-50k, 8.4% for AGIs $50k-75k, 9.5% for AGIs $75k-100k, 14.2% for AGIs over 100k)
Earned income credit: $1,375 (reported on 15.0% of returns)
Here:
$1,375
State:
$1,544
Percentage of individuals using paid preparers for their 2004 taxes: 51.5%
Here:
52%
State:
57%
(% for various income ranges: 46.3% for AGIs below $10k, 48.5% for AGIs $10k-25k, 48.4% for AGIs $25k-50k, 61.3% for AGIs $50k-75k, 59.5% for AGIs $75k-100k, 64.7% for AGIs over 100k)
Household received Food Stamps/SNAP in the past 12 months: 26 Household did not receive Food Stamps/SNAP in the past 12 months: 323
Women who had a birth in the past 12 months: 10 (5 now married, 4 unmarried) Women who did not have a birth in the past 12 months: 154 (74 now married, 79 unmarried)
Housing units in zip code 54854 with a mortgage: 191 (9 second mortgage, 8 both second mortgage and home equity loan) Median monthly owner costs for units with a mortgage: $1,467 Median monthly owner costs for units without a mortgage: $538
Residents with income below the poverty level in 2022:
This zip code:
5.6%
Whole state:
10.7%
Residents with income below 50% of the poverty level in 2022:
This zip code:
3.1%
Whole state:
5.7%
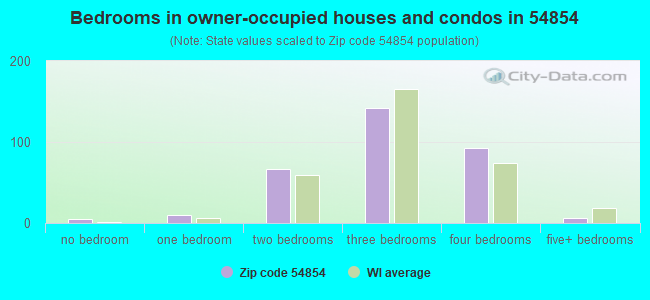
Median number of rooms in houses and condos:
Here:
6.7
State:
6.5
Median number of rooms in apartments:
Here:
4.1
State:
4.1
Notable locations in this zip code not listed on our city pages
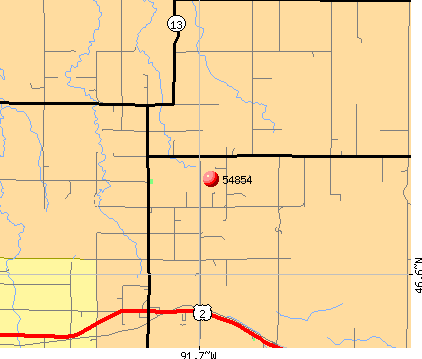
Notable locations in zip code 54854: McNeil Landing (A), Cloverland Volunteer Fire Department (B), Maple Fire Department (C). Display/hide their locations on the map
Rivers and creeks: Percival Creek (A), Amnicon River (B), Anderson Creek (C), Pearson Creek (D), Bois Brule River (E), Haukkala Creek (F), Trask Creek (G), Middle River (H), Nelson Creek (I). Display/hide their locations on the map
Parks in zip code 54854 include: Brule River Boreal Forest State Natural Area (1), Bear Beach State Natural Area (2), Brule River State Forest Waterfowl Management Area (3). Display/hide their locations on the map
Size of family households: 121 2-persons, 52 3-persons, 38 4-persons, 33 5-persons
Size of nonfamily households: 84 1-person, 15 2-persons, 3 3-persons
150 married couples with children.
16 single-parent households (16 women).
97.2% of residents of 54854 zip code speak English at home.
0.8% of residents speak Spanish at home (100% very well).
0.7% of residents speak other Indo-European language at home (50% very well, 50% not well).
0.8% of residents speak other language at home (57% very well, 43% not well).
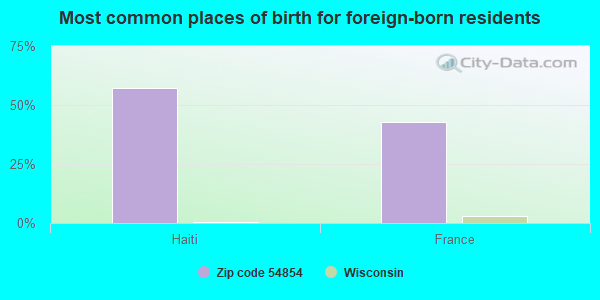
Foreign born population: 7 (0.9%) (62.6% of them are naturalized citizens)
This zip code:
0.9%
Whole state:
5.0%
57%Haiti
43%France
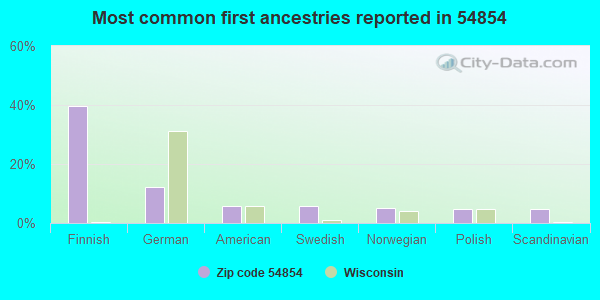
40%Finnish
12%German
6%American
6%Swedish
5%Norwegian
5%Polish
5%Scandinavian
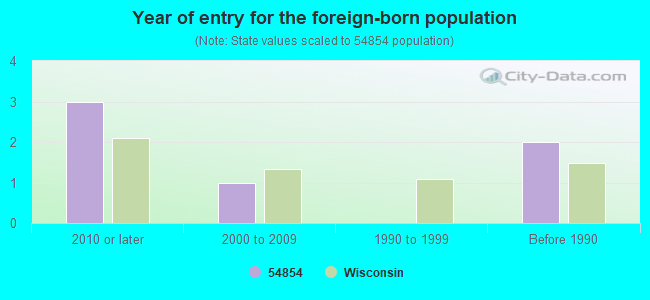
Year of entry for the foreign-born population
32010 or later
12000 to 2009
01990 to 1999
2Before 1990
Facilities with environmental interests located in this zip code:
A PLUS SMALL ENGINE& SALVAGE (11980 E HWY 2 in MAPLE, WI)
Conditionally Exempt Small Quantity Generators, less than 100 kg/month of hazardous waste (Resource Conservation and Recovery Act (tracking hazardous waste)) - notification STATE MASTER (Wisconsin database) - RCRAINFO-WID988643243, CESQG Organizations: A PLUS SMALL ENGINE AND SALVAGE (CONTACT/OWNER)
CLOVERLAND GARAGE (HWY 13 in MAPLE, WI)
Conditionally Exempt Small Quantity Generators, less than 100 kg/month of hazardous waste (Resource Conservation and Recovery Act (tracking hazardous waste)) STATE MASTER (Wisconsin database) - RCRAINFO-WID988615456, CESQG Business SIC classification: LOCAL TRUCKING WITHOUT STORAGE
Housing units lacking complete plumbing facilities: 4.6% Housing units lacking complete kitchen facilities: 4.6%
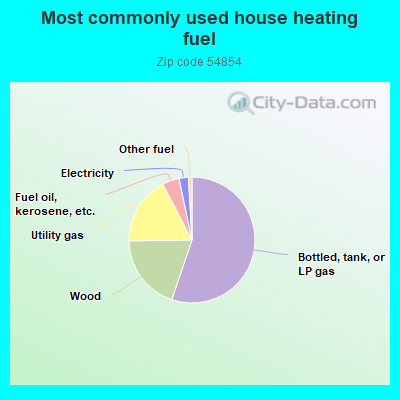
55.6%Bottled, tank, or LP gas
19.7%Wood
17.7%Utility gas
4.4%Fuel oil, kerosene, etc.
2.4%Electricity
0.9%Other fuel
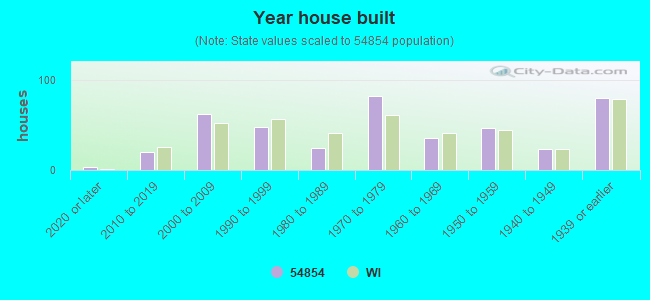
Population in 1990: 891.
Place of birth for U.S.-born residents:
This state: 374
Northeast: 11
Midwest: 476
South: 29
West: 9
70% of the 54854 zip code residents lived in the same house 5 years ago. Out of people who lived in different houses, 55% lived in this county. Out of people who lived in different counties, 50% lived in Wisconsin.
97% of the 54854 zip code residents lived in the same house 1 year ago. Out of people who lived in different houses, 33% moved from this county. Out of people who lived in different houses, 17% moved from different county within same state. Out of people who lived in different houses, 61% moved from different state.
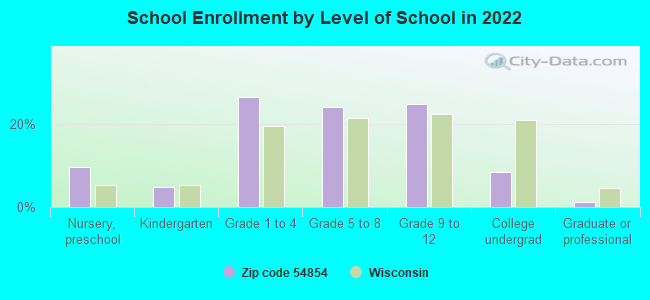
Private vs. public school enrollment:
Students in private schools in grades 1 to 8 (elementary and middle school): 9
Here:
10.7%
Wisconsin:
16.7%
Students in private schools in grades 9 to 12 (high school): 2
Here:
5.7%
Wisconsin:
12.5%
Students in private undergraduate colleges:
Here:
6.6%
Wisconsin:
17.5%
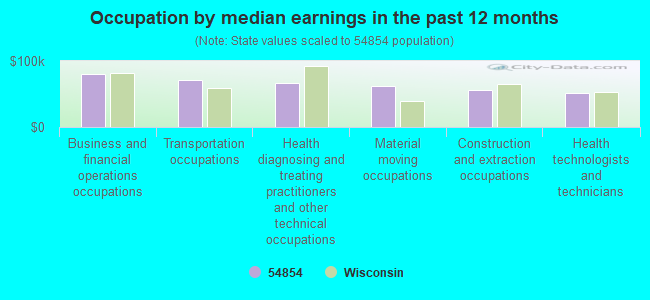
Occupation by median earnings in the past 12 months ($)
80,467Business and financial operations occupations
71,532Transportation occupations
66,276Health diagnosing and treating practitioners and other technical occupations
62,649Material moving occupations
56,087Construction and extraction occupations
51,852Health technologists and technicians
Top industries in this zip code by the number of employees in 2005:
Construction: Water and Sewer Line and Related Structures Construction (10-19 employees: 1 establishment)
Real Estate and Rental and Leasing: Nonresidential Property Managers (10-19: 1)
Accommodation and Food Services: Full-Service Restaurants (5-9: 1)
Wholesale Trade: Service Establishment Equipment and Supplies Merchant Wholesalers (1-4: 1)
Other Services (except Public Administration): General Automotive Repair (1-4: 1)
Administrative and Support and Waste Management and Remediation Services: Landscaping Services (1-4: 1)
Wholesale Trade: Motor Vehicle Supplies and New Parts Merchant Wholesalers (1-4: 1)
Fatal accident statistics in 2014:
Fatal accident count: 1
Vehicles involved in fatal accidents: 2
Fatal accidents caused by drunken drivers: 0
Fatalities: 1
Persons involved in fatal accidents: 4
Pedestrians involved in fatal accidents: 0
Home Mortgage Disclosure Act Aggregated Statistics For Year 2009 (Based on 2 partial tracts)
A) FHA, FSA/RHS & VA Home Purchase Loans
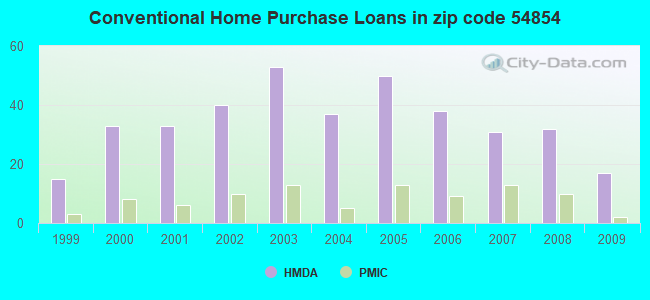
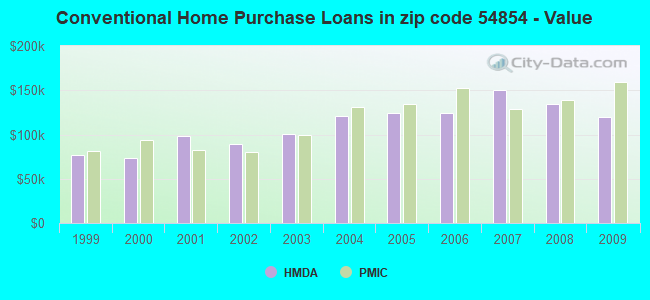
B) Conventional Home Purchase Loans
C) Refinancings
D) Home Improvement Loans
F) Non-occupant Loans on < 5 Family Dwellings (A B C & D)
G) Loans On Manufactured Home Dwelling (A B C & D)
Number
Average Value
Number
Average Value
Number
Average Value
Number
Average Value
Number
Average Value
Number
Average Value
LOANS ORIGINATED
4
$156,438
17
$120,019
123
$152,524
14
$57,666
11
$156,154
11
$80,077
APPLICATIONS APPROVED, NOT ACCEPTED
0
$0
0
$0
13
$162,719
3
$52,187
1
$164,570
3
$60,690
APPLICATIONS DENIED
1
$60,520
3
$87,703
39
$149,765
4
$50,645
2
$119,800
5
$104,842
APPLICATIONS WITHDRAWN
1
$155,060
1
$52,520
17
$157,710
1
$20,010
2
$63,525
1
$152,060
FILES CLOSED FOR INCOMPLETENESS
1
$36,010
1
$75,030
4
$162,440
2
$68,525
0
$0
0
$0
Aggregated Statistics For Year 2008 (Based on 2 partial tracts)
A) FHA, FSA/RHS & VA Home Purchase Loans
B) Conventional Home Purchase Loans
C) Refinancings
D) Home Improvement Loans
F) Non-occupant Loans on < 5 Family Dwellings (A B C & D)
G) Loans On Manufactured Home Dwelling (A B C & D)
Number
Average Value
Number
Average Value
Number
Average Value
Number
Average Value
Number
Average Value
Number
Average Value
LOANS ORIGINATED
4
$134,052
32
$134,507
64
$141,916
17
$49,873
13
$134,900
11
$85,125
APPLICATIONS APPROVED, NOT ACCEPTED
0
$0
1
$137,560
7
$124,479
2
$7,505
1
$11,000
2
$75,030
APPLICATIONS DENIED
2
$69,280
2
$96,040
26
$136,728
3
$69,193
1
$116,050
1
$64,030
APPLICATIONS WITHDRAWN
2
$71,030
0
$0
12
$156,646
1
$110,040
1
$236,590
0
$0
FILES CLOSED FOR INCOMPLETENESS
0
$0
0
$0
1
$65,030
0
$0
0
$0
0
$0
Aggregated Statistics For Year 2007 (Based on 2 partial tracts)
A) FHA, FSA/RHS & VA Home Purchase Loans
B) Conventional Home Purchase Loans
C) Refinancings
D) Home Improvement Loans
E) Loans on Dwellings For 5+ Families
F) Non-occupant Loans on < 5 Family Dwellings (A B C & D)
G) Loans On Manufactured Home Dwelling (A B C & D)
Number
Average Value
Number
Average Value
Number
Average Value
Number
Average Value
Number
Average Value
Number
Average Value
Number
Average Value
LOANS ORIGINATED
4
$125,675
31
$150,012
67
$108,013
27
$45,426
1
$245,600
17
$103,218
14
$86,356
APPLICATIONS APPROVED, NOT ACCEPTED
1
$50,020
4
$162,190
10
$107,793
4
$84,910
0
$0
2
$111,045
2
$60,525
APPLICATIONS DENIED
1
$71,030
7
$127,480
25
$114,146
5
$62,124
0
$0
3
$121,883
5
$101,840
APPLICATIONS WITHDRAWN
0
$0
3
$92,703
18
$139,639
2
$92,035
0
$0
1
$152,560
0
$0
FILES CLOSED FOR INCOMPLETENESS
0
$0
0
$0
4
$99,415
1
$24,010
0
$0
0
$0
0
$0
Aggregated Statistics For Year 2006 (Based on 2 partial tracts)
A) FHA, FSA/RHS & VA Home Purchase Loans
B) Conventional Home Purchase Loans
C) Refinancings
D) Home Improvement Loans
F) Non-occupant Loans on < 5 Family Dwellings (A B C & D)
G) Loans On Manufactured Home Dwelling (A B C & D)
Number
Average Value
Number
Average Value
Number
Average Value
Number
Average Value
Number
Average Value
Number
Average Value
LOANS ORIGINATED
3
$101,040
38
$124,418
71
$108,501
17
$35,455
11
$113,045
8
$66,964
APPLICATIONS APPROVED, NOT ACCEPTED
0
$0
5
$122,048
16
$98,039
1
$34,010
3
$171,403
1
$20,010
APPLICATIONS DENIED
1
$47,020
9
$163,232
47
$111,513
4
$46,768
3
$124,717
2
$58,025
APPLICATIONS WITHDRAWN
0
$0
4
$139,180
31
$93,763
3
$88,703
2
$145,560
0
$0
FILES CLOSED FOR INCOMPLETENESS
0
$0
1
$172,070
7
$130,839
0
$0
1
$55,520
0
$0
Aggregated Statistics For Year 2005 (Based on 2 partial tracts)
A) FHA, FSA/RHS & VA Home Purchase Loans
B) Conventional Home Purchase Loans
C) Refinancings
D) Home Improvement Loans
F) Non-occupant Loans on < 5 Family Dwellings (A B C & D)
G) Loans On Manufactured Home Dwelling (A B C & D)
Number
Average Value
Number
Average Value
Number
Average Value
Number
Average Value
Number
Average Value
Number
Average Value
LOANS ORIGINATED
3
$115,380
50
$124,500
88
$112,931
29
$47,347
15
$111,845
12
$53,062
APPLICATIONS APPROVED, NOT ACCEPTED
0
$0
8
$88,410
12
$130,010
3
$15,340
2
$117,795
4
$57,772
APPLICATIONS DENIED
0
$0
13
$98,732
38
$117,126
8
$64,526
2
$157,565
5
$53,922
APPLICATIONS WITHDRAWN
0
$0
6
$109,877
32
$123,237
2
$119,050
3
$119,213
3
$57,690
FILES CLOSED FOR INCOMPLETENESS
0
$0
0
$0
12
$144,182
1
$16,510
2
$150,560
1
$50,020
Aggregated Statistics For Year 2004 (Based on 2 partial tracts)
A) FHA, FSA/RHS & VA Home Purchase Loans
B) Conventional Home Purchase Loans
C) Refinancings
D) Home Improvement Loans
F) Non-occupant Loans on < 5 Family Dwellings (A B C & D)
G) Loans On Manufactured Home Dwelling (A B C & D)
Number
Average Value
Number
Average Value
Number
Average Value
Number
Average Value
Number
Average Value
Number
Average Value
LOANS ORIGINATED
1
$88,540
37
$121,008
75
$107,356
24
$49,020
14
$97,181
12
$66,902
APPLICATIONS APPROVED, NOT ACCEPTED
0
$0
2
$67,775
14
$119,655
3
$22,343
1
$38,020
2
$59,525
APPLICATIONS DENIED
0
$0
6
$75,780
30
$83,800
5
$37,214
1
$62,520
8
$71,216
APPLICATIONS WITHDRAWN
0
$0
4
$106,418
29
$100,627
2
$37,015
2
$90,285
4
$60,150
FILES CLOSED FOR INCOMPLETENESS
1
$29,510
0
$0
7
$101,111
2
$34,765
0
$0
0
$0
Aggregated Statistics For Year 2003 (Based on 2 partial tracts)
A) FHA, FSA/RHS & VA Home Purchase Loans
B) Conventional Home Purchase Loans
C) Refinancings
D) Home Improvement Loans
F) Non-occupant Loans on < 5 Family Dwellings (A B C & D)
Number
Average Value
Number
Average Value
Number
Average Value
Number
Average Value
Number
Average Value
LOANS ORIGINATED
1
$231,090
53
$101,116
228
$98,822
21
$41,564
21
$92,490
APPLICATIONS APPROVED, NOT ACCEPTED
0
$0
4
$75,030
13
$107,543
1
$10,000
1
$38,520
APPLICATIONS DENIED
0
$0
13
$81,879
53
$93,556
4
$12,630
3
$84,200
APPLICATIONS WITHDRAWN
1
$74,530
6
$102,292
24
$99,498
1
$45,020
2
$89,785
FILES CLOSED FOR INCOMPLETENESS
1
$43,520
2
$74,530
4
$63,650
1
$8,500
1
$27,010
Aggregated Statistics For Year 2002 (Based on 2 partial tracts)
A) FHA, FSA/RHS & VA Home Purchase Loans
B) Conventional Home Purchase Loans
C) Refinancings
D) Home Improvement Loans
F) Non-occupant Loans on < 5 Family Dwellings (A B C & D)
Number
Average Value
Number
Average Value
Number
Average Value
Number
Average Value
Number
Average Value
LOANS ORIGINATED
4
$69,402
40
$89,736
202
$87,570
18
$30,651
19
$82,823
APPLICATIONS APPROVED, NOT ACCEPTED
0
$0
4
$54,522
9
$85,590
2
$38,765
2
$48,270
APPLICATIONS DENIED
1
$38,520
9
$61,913
47
$84,034
6
$43,852
2
$93,785
APPLICATIONS WITHDRAWN
1
$71,530
5
$86,834
27
$90,518
2
$13,755
1
$125,550
FILES CLOSED FOR INCOMPLETENESS
0
$0
0
$0
5
$119,148
0
$0
0
$0
Aggregated Statistics For Year 2001 (Based on 2 partial tracts)
A) FHA, FSA/RHS & VA Home Purchase Loans
B) Conventional Home Purchase Loans
C) Refinancings
D) Home Improvement Loans
F) Non-occupant Loans on < 5 Family Dwellings (A B C & D)
Number
Average Value
Number
Average Value
Number
Average Value
Number
Average Value
Number
Average Value
LOANS ORIGINATED
2
$68,275
33
$98,782
151
$81,675
29
$25,510
15
$84,434
APPLICATIONS APPROVED, NOT ACCEPTED
0
$0
3
$47,853
8
$81,720
1
$35,010
1
$20,010
APPLICATIONS DENIED
0
$0
8
$68,715
41
$71,492
5
$31,812
2
$124,050
APPLICATIONS WITHDRAWN
1
$17,510
5
$56,522
22
$58,728
1
$2,500
2
$31,010
FILES CLOSED FOR INCOMPLETENESS
0
$0
0
$0
8
$92,224
0
$0
1
$90,040
Aggregated Statistics For Year 2000 (Based on 2 partial tracts)
A) FHA, FSA/RHS & VA Home Purchase Loans
B) Conventional Home Purchase Loans
C) Refinancings
D) Home Improvement Loans
F) Non-occupant Loans on < 5 Family Dwellings (A B C & D)
Number
Average Value
Number
Average Value
Number
Average Value
Number
Average Value
Number
Average Value
LOANS ORIGINATED
3
$87,533
33
$73,863
60
$57,615
28
$23,581
7
$50,234
APPLICATIONS APPROVED, NOT ACCEPTED
0
$0
5
$53,122
5
$57,824
1
$9,500
0
$0
APPLICATIONS DENIED
0
$0
11
$52,294
23
$47,062
3
$21,343
2
$43,515
APPLICATIONS WITHDRAWN
1
$46,020
3
$53,353
10
$43,767
2
$157,315
1
$25,010
FILES CLOSED FOR INCOMPLETENESS
0
$0
1
$24,510
3
$42,850
0
$0
0
$0
Aggregated Statistics For Year 1999 (Based on 1 partial tract)
A) FHA, FSA/RHS & VA Home Purchase Loans
B) Conventional Home Purchase Loans
C) Refinancings
D) Home Improvement Loans
F) Non-occupant Loans on < 5 Family Dwellings (A B C & D)


 Nearest zip codes: 54820, 54864, 54849, 54842, 54847, 54874.