Estimated zip code population in 2022: 7,810 Zip code population in 2010: 7,577 Zip code population in 2000: 5,301
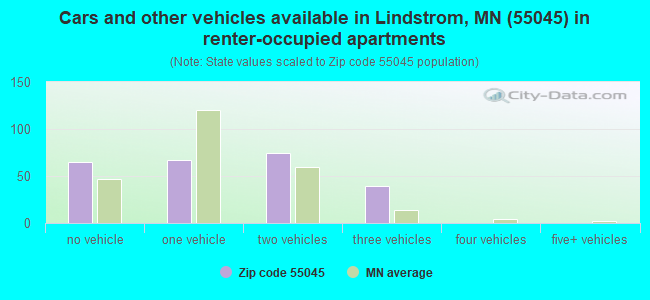
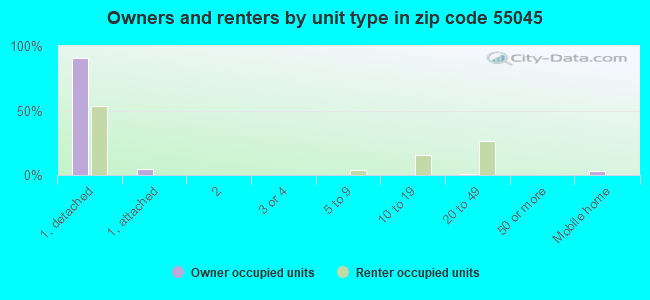
Houses and condos: 3,116 Renter-occupied apartments: 248
% of renters here:
9%
State:
28%
March 2022 cost of living index in zip code 55045: 113.4 (more than average, U.S. average is 100)
Land area: 35.4 sq. mi. Water area: 6.6 sq. mi.
Population density: 221 people per square mile
(very low).
OSM Map
General Map
Google Map
MSN Map
OSM Map
General Map
Google Map
MSN Map
OSM Map
General Map
Google Map
MSN Map
OSM Map
General Map
Google Map
MSN Map
Please wait while loading the map...
Real estate property taxes paid for housing units in 2022:
This zip code:
1.0% ($4,018)
Minnesota:
1.0% ($3,087)
Median real estate property taxes paid for housing units with mortgages in 2022: $4,038 (1.0%) Median real estate property taxes paid for housing units with no mortgage in 2022: $3,884 (1.0%)
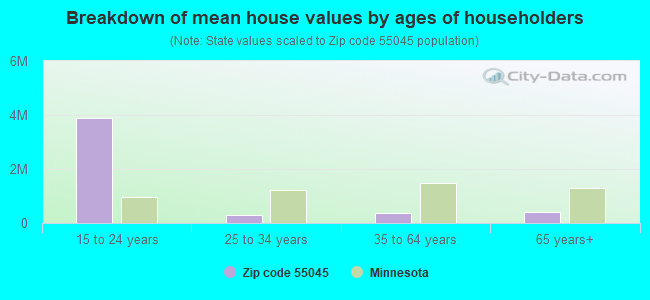
Estimated median house/condo value in 2022: $388,424
55045:
$388,424
Minnesota:
$314,600
Median resident age:
This zip code:
42.4 years
Minnesota median age:
39.0 years
Average household size:
This zip code:
2.7 people
Minnesota:
2.4 people
Averages for the 2020 tax year for zip code 55045, filed in 2021:
Average Adjusted Gross Income (AGI) in 2020: $83,266 (Individual Income Tax Returns)
Here:
$83,266
State:
$82,178
Salary/wage: $67,435 (reported on 81.0% of returns)
Here:
$67,435
State:
$67,438
(% of AGI for various income ranges: 1115.9% for AGIs below $25k, 3513.3% for AGIs $25k-50k, 5774.3% for AGIs $50k-75k, 8871.6% for AGIs $75k-100k, 19258.7% for AGIs $100k-200k, 65012.9% for AGIs over 200k)
Taxable interest for individuals: $1,165 (reported on 36.8% of returns)
This zip code:
$1,165
Minnesota:
$1,814
(% of AGI for various income ranges: 29.1% for AGIs below $25k, 26.5% for AGIs $25k-50k, 41.5% for AGIs $50k-75k, 41.9% for AGIs $75k-100k, 92.8% for AGIs $100k-200k, 861.4% for AGIs over 200k)
Ordinary dividends: $3,089 (reported on 23.3% of returns)
Here:
$3,089
State:
$6,928
(% of AGI for various income ranges: 36.8% for AGIs below $25k, 42.1% for AGIs $25k-50k, 85.2% for AGIs $50k-75k, 108.1% for AGIs $75k-100k, 188.5% for AGIs $100k-200k, 1094.3% for AGIs over 200k)
Net capital gain/loss in AGI: +$26,458 (reported on 21.1% of returns)
Here:
+$26,458
State:
+$20,591
(% of AGI for various income ranges: 30.4% for AGIs below $25k, 61.8% for AGIs $25k-50k, 81.7% for AGIs $50k-75k, 203.9% for AGIs $75k-100k, 458.1% for AGIs $100k-200k, 26431.4% for AGIs over 200k)
Profit/loss from business: +$11,480 (reported on 14.0% of returns)
Here:
+$11,480
State:
+$14,342
(% of AGI for various income ranges: 70.3% for AGIs below $25k, 176.5% for AGIs $25k-50k, 112.2% for AGIs $50k-75k, 379.4% for AGIs $75k-100k, 581.7% for AGIs $100k-200k, 731.4% for AGIs over 200k)
Taxable individual retirement arrangement distribution: $20,963 (reported on 12.8% of returns)
55045:
$20,963
Minnesota:
$20,675
(% of AGI for various income ranges: 104.8% for AGIs below $25k, 193.7% for AGIs $25k-50k, 308.7% for AGIs $50k-75k, 558.4% for AGIs $75k-100k, 892.6% for AGIs $100k-200k, 2168.6% for AGIs over 200k)
Total itemized deductions: $27,112 (reported on 10.0% of returns)
Here:
$27,112
State:
$33,311
(% of AGI for various income ranges: 88.1% for AGIs below $25k, 88.1% for AGIs $25k-50k, 297.8% for AGIs $50k-75k, 555.2% for AGIs $75k-100k, 942.6% for AGIs $100k-200k, 3162.9% for AGIs over 200k)
Charity contributions: $6,103 (reported on 8.0% of returns)
Here:
$6,103
State:
$11,879
(% of AGI for various income ranges: 9.1% for AGIs below $25k, 41.3% for AGIs $50k-75k, 59.4% for AGIs $75k-100k, 173.8% for AGIs $100k-200k, 998.6% for AGIs over 200k)
Taxes paid: $8,420 (reported on 10.0% of returns)
55045:
$8,420
State:
$8,252
(% of AGI for various income ranges: 10.9% for AGIs below $25k, 22.1% for AGIs $25k-50k, 108.0% for AGIs $50k-75k, 191.6% for AGIs $75k-100k, 305.5% for AGIs $100k-200k, 914.3% for AGIs over 200k)
Earned income credit: $1,900 (reported on 7.8% of returns)
Here:
$1,900
State:
$2,055
(% of AGI for various income ranges: 52.3% for AGIs below $25k, 40.0% for AGIs $25k-50k)
Percentage of individuals using paid preparers for their 2020 taxes: 95.0%
Here:
95%
State:
94%
(% for various income ranges: 92.4% for AGIs below $25k, 94.9% for AGIs $25k-50k, 95.2% for AGIs $50k-75k, 95.7% for AGIs $75k-100k, 96.6% for AGIs $100k-200k, 100.0% for AGIs over 200k)
Averages for the 2012 tax year for zip code 55045, filed in 2013:
Average Adjusted Gross Income (AGI) in 2012: $62,594 (Individual Income Tax Returns)
Here:
$62,594
State:
$67,192
Salary/wage: $53,526 (reported on 83.3% of returns)
Here:
$53,526
State:
$55,182
(% of AGI for various income ranges: 68.9% for AGIs below $25k, 72.6% for AGIs $25k-50k, 71.4% for AGIs $50k-75k, 76.3% for AGIs $75k-100k, 77.5% for AGIs $100k-200k, 53.5% for AGIs over 200k)
Taxable interest for individuals: $1,456 (reported on 38.1% of returns)
This zip code:
$1,456
Minnesota:
$1,664
(% of AGI for various income ranges: 2.0% for AGIs below $25k, 1.0% for AGIs $25k-50k, 0.8% for AGIs $50k-75k, 0.6% for AGIs $75k-100k, 0.5% for AGIs $100k-200k, 1.6% for AGIs over 200k)
Ordinary dividends: $2,825 (reported on 22.3% of returns)
Here:
$2,825
State:
$5,665
(% of AGI for various income ranges: 1.6% for AGIs below $25k, 0.9% for AGIs $25k-50k, 1.0% for AGIs $50k-75k, 0.7% for AGIs $75k-100k, 0.8% for AGIs $100k-200k, 1.7% for AGIs over 200k)
Net capital gain/loss in AGI: +$7,741 (reported on 15.3% of returns)
Here:
+$7,741
State:
+$16,131
(% of AGI for various income ranges: 0.5% for AGIs $25k-50k, 0.5% for AGIs $50k-75k, 0.8% for AGIs $75k-100k, 1.2% for AGIs $100k-200k, 7.5% for AGIs over 200k)
Profit/loss from business: +$10,875 (reported on 15.0% of returns)
Here:
+$10,875
State:
+$12,430
(% of AGI for various income ranges: 5.1% for AGIs below $25k, 3.6% for AGIs $25k-50k, 3.0% for AGIs $50k-75k, 1.5% for AGIs $75k-100k, 3.1% for AGIs $100k-200k, 0.9% for AGIs over 200k)
Taxable individual retirement arrangement distribution: $14,028 (reported on 13.3% of returns)
55045:
$14,028
Minnesota:
$15,212
(% of AGI for various income ranges: 4.8% for AGIs below $25k, 3.9% for AGIs $25k-50k, 3.9% for AGIs $50k-75k, 3.3% for AGIs $75k-100k, 3.3% for AGIs $100k-200k)
Total itemized deductions: $21,759 (22% of AGI, reported on 47.7% of returns)
Here:
$21,759
State:
$24,665
Here:
22.1% of AGI
State:
19.6% of AGI
(% of AGI for various income ranges: 16.4% for AGIs below $25k, 14.4% for AGIs $25k-50k, 16.0% for AGIs $50k-75k, 17.2% for AGIs $75k-100k, 18.2% for AGIs $100k-200k, 14.9% for AGIs over 200k)
Charity contributions: $2,728 (reported on 40.4% of returns)
Here:
$2,728
State:
$3,948
(% of AGI for various income ranges: 1.2% for AGIs below $25k, 1.2% for AGIs $25k-50k, 1.8% for AGIs $50k-75k, 1.8% for AGIs $75k-100k, 2.0% for AGIs $100k-200k, 1.8% for AGIs over 200k)
Taxes paid: $8,760 (reported on 47.7% of returns)
55045:
$8,760
State:
$10,589
(% of AGI for various income ranges: 3.1% for AGIs below $25k, 4.3% for AGIs $25k-50k, 5.3% for AGIs $50k-75k, 6.5% for AGIs $75k-100k, 8.0% for AGIs $100k-200k, 8.7% for AGIs over 200k)
Earned income credit: $1,763 (reported on 10.7% of returns)
Here:
$1,763
State:
$2,037
(% of AGI for various income ranges: 3.9% for AGIs below $25k, 0.6% for AGIs $25k-50k)
Percentage of individuals using paid preparers for their 2012 taxes: 61.9%
Here:
62%
State:
55%
(% for various income ranges: 53.4% for AGIs below $25k, 65.2% for AGIs $25k-50k, 67.3% for AGIs $50k-75k, 67.3% for AGIs $75k-100k, 61.1% for AGIs $100k-200k, 88.9% for AGIs over 200k)
Averages for the 2004 tax year for zip code 55045, filed in 2005:
Average Adjusted Gross Income (AGI) in 2004: $52,220 (Individual Income Tax Returns)
Here:
$52,220
State:
$53,560
Salary/wage: $45,817 (reported on 85.7% of returns)
Here:
$45,817
State:
$46,177
(% of AGI for various income ranges: 150.7% for AGIs below $10k, 69.1% for AGIs $10k-25k, 77.2% for AGIs $25k-50k, 83.8% for AGIs $50k-75k, 84.6% for AGIs $75k-100k, 61.6% for AGIs over 100k)
Taxable interest for individuals: $1,608 (reported on 50.7% of returns)
This zip code:
$1,608
Minnesota:
$1,796
(% of AGI for various income ranges: 5.9% for AGIs below $10k, 4.5% for AGIs $10k-25k, 1.2% for AGIs $25k-50k, 0.8% for AGIs $50k-75k, 0.6% for AGIs $75k-100k, 2.3% for AGIs over 100k)
Taxable dividends: $1,689 (reported on 27.8% of returns)
Here:
$1,689
State:
$3,096
(% of AGI for various income ranges: 3.1% for AGIs below $10k, 1.2% for AGIs $10k-25k, 0.7% for AGIs $25k-50k, 0.6% for AGIs $50k-75k, 0.5% for AGIs $75k-100k, 1.4% for AGIs over 100k)
Net capital gain/loss: +$7,675 (reported on 20.9% of returns)
Here:
+$7,675
State:
+$10,864
(% of AGI for various income ranges: -3.0% for AGIs below $10k, -0.2% for AGIs $10k-25k, 0.6% for AGIs $25k-50k, 0.5% for AGIs $50k-75k, 1.8% for AGIs $75k-100k, 7.7% for AGIs over 100k)
Profit/loss from business: +$8,117 (reported on 18.0% of returns)
Here:
+$8,117
State:
+$10,442
(% of AGI for various income ranges: 5.1% for AGIs below $10k, 5.0% for AGIs $10k-25k, 4.1% for AGIs $25k-50k, 1.5% for AGIs $50k-75k, 1.8% for AGIs $75k-100k, 3.2% for AGIs over 100k)
IRA payment deduction: $3,027 (reported on 2.2% of returns)
55045:
$3,027
Minnesota:
$2,955
(% of AGI for various income ranges: 0.8% for AGIs below $10k, 0.2% for AGIs $25k-50k, 0.2% for AGIs $50k-75k, 0.2% for AGIs $75k-100k)
Self-employed pension: $8,478 (reported on 0.7% of returns)
Here:
$8,478
Minnesota:
$12,099
Total itemized deductions: $18,536 (24% of AGI, reported on 55.2% of returns)
Here:
$18,536
State:
$20,035
Here:
24.0% of AGI
State:
21.3% of AGI
(% of AGI for various income ranges: 24.5% for AGIs below $10k, 16.9% for AGIs $10k-25k, 21.2% for AGIs $25k-50k, 22.1% for AGIs $50k-75k, 20.6% for AGIs $75k-100k, 16.7% for AGIs over 100k)
Charity contributions deductions: $2,602 (3% of AGI, reported on 50.5% of returns)
Here:
$2,602
State:
$3,333
Here:
3.3% of AGI
State:
3.4% of AGI
(% of AGI for various income ranges: 0.9% for AGIs below $10k, 1.6% for AGIs $10k-25k, 1.9% for AGIs $25k-50k, 2.2% for AGIs $50k-75k, 2.5% for AGIs $75k-100k, 3.2% for AGIs over 100k)
Total tax: $6,847 (reported on 81.0% of returns)
55045:
$6,847
State:
$8,485
(% of AGI for various income ranges: 4.3% for AGIs below $10k, 4.4% for AGIs $10k-25k, 6.9% for AGIs $25k-50k, 7.7% for AGIs $50k-75k, 9.0% for AGIs $75k-100k, 16.8% for AGIs over 100k)
Earned income credit: $1,481 (reported on 8.0% of returns)
Here:
$1,481
State:
$1,523
Percentage of individuals using paid preparers for their 2004 taxes: 62.7%
Here:
63%
State:
59%
(% for various income ranges: 46.3% for AGIs below $10k, 61.1% for AGIs $10k-25k, 66.1% for AGIs $25k-50k, 70.3% for AGIs $50k-75k, 67.2% for AGIs $75k-100k, 64.5% for AGIs over 100k)
Household received Food Stamps/SNAP in the past 12 months: 191 Household did not receive Food Stamps/SNAP in the past 12 months: 2,707
Women who had a birth in the past 12 months: 109 (59 now married, 47 unmarried) Women who did not have a birth in the past 12 months: 1,475 (850 now married, 626 unmarried)
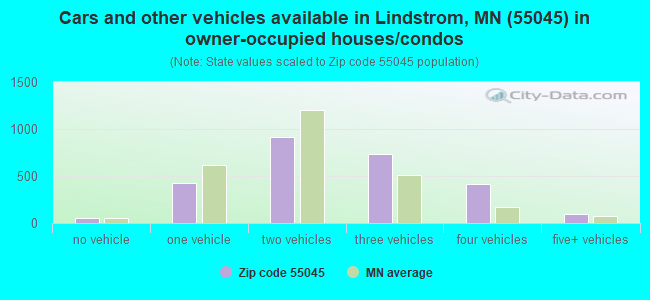
Housing units in zip code 55045 with a mortgage: 1,909 (163 second mortgage, 146 both second mortgage and home equity loan) Houses without a mortgage: 45
Median monthly owner costs for units with a mortgage: $2,032 Median monthly owner costs for units without a mortgage: $757
Residents with income below the poverty level in 2022:
This zip code:
4.6%
Whole state:
9.6%
Residents with income below 50% of the poverty level in 2022:
This zip code:
1.7%
Whole state:
5.2%
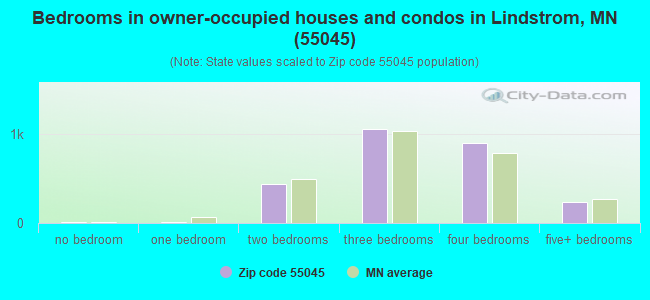
Median number of rooms in houses and condos:
Here:
7.0
State:
7.1
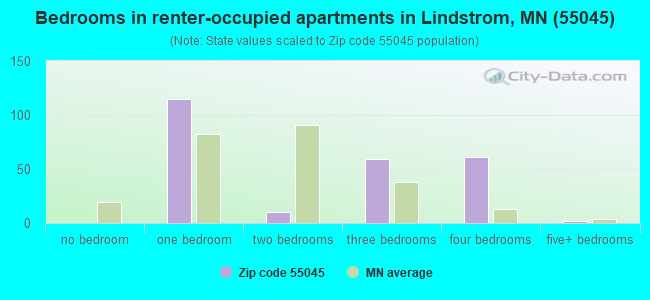
Median number of rooms in apartments:
Here:
6.0
State:
3.8
Notable locations in this zip code not listed on our city pages
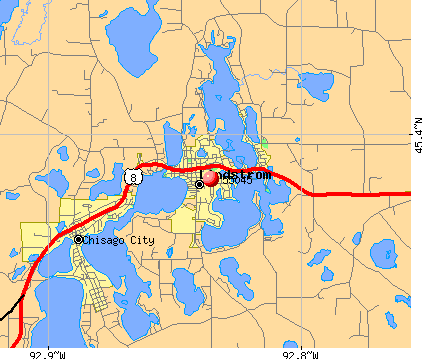
Notable locations in zip code 55045: Chisago Lakes Golf Club (A), Blue Waters Leisure Park Campgrounds (B), Hillcrest RV Park (C), Chisago County Sheriffs Office (D), Lindstrom Police Department (E), Lindstrom City Hall (F), Lindstrom Fire Department (G), Lindstrom Public Library (H). Display/hide their locations on the map
Churches in zip code 55045 include: Chisago Lakes Evangelical Free Church (A), First United Methodist Church (B), Trinity Lutheran Church (C), Saint Bridgets Catholic Church (D). Display/hide their locations on the map
Lakes: Boos Lake (A), Kroon Lake (B), Vibo Lake (C), Trulson Lake (D), Swamp Lake (E), Sunrise Lake (F), South Lindstrom Lake (G), South Center Lake (H). Display/hide their locations on the map
1,751 married couples with children.
271 single-parent households (115 men, 156 women).
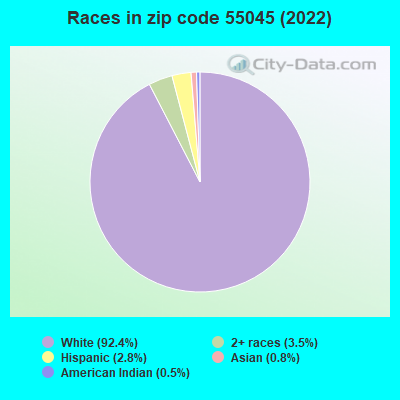
96.9% of residents of 55045 zip code speak English at home.
2.0% of residents speak Spanish at home (69% very well, 31% well).
0.4% of residents speak other Indo-European language at home (31% very well, 69% not well).
0.3% of residents speak Asian or Pacific Island language at home (50% very well, 50% well).
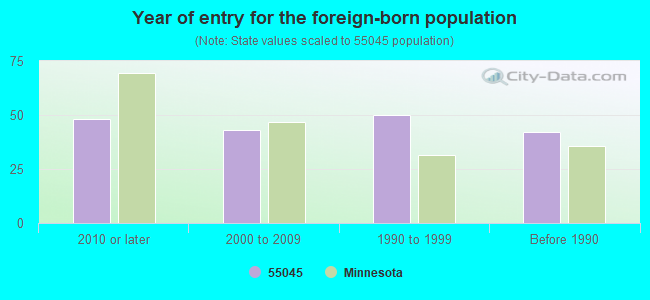
Foreign born population: 134 (1.7%) (72.4% of them are naturalized citizens)
This zip code:
1.7%
Whole state:
8.7%
52%Honduras
15%Malaysia
8%Serbia
8%Guatemala
5%Singapore
2%Germany
1%Japan
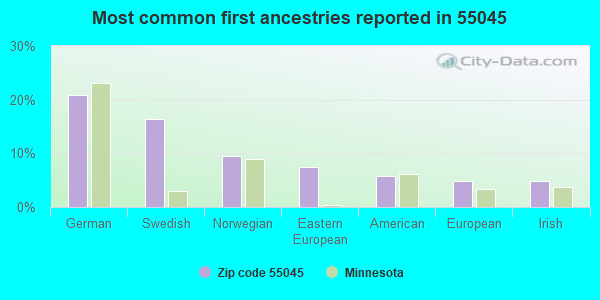
21%German
16%Swedish
9%Norwegian
8%Eastern European
6%American
5%European
5%Irish
Year of entry for the foreign-born population
482010 or later
432000 to 2009
501990 to 1999
42Before 1990
Major facilities with environmental interests located in this zip code:
ENGINEERED WALL CORPORATION (13290 NEWLANDER AVENUE in LINDSTROM, MN)
STATE MASTER (Minnesota Pollution Control Agency permits and compilance tracking) - RCRAINFO-MND985742410, CESQG, PCS-MN0064815, NPDES NON-MAJOR National Pollutant Discharge Elimination System NON-MAJOR (Tracking pollutant discharge elimination systems) - permit Conditionally Exempt Small Quantity Generators, less than 100 kg/month of hazardous waste (Resource Conservation and Recovery Act (tracking hazardous waste)) - notification Organizations: ENGINEERED PANEL SYSTEMS CORP (CONTACT/OWNER)
Alternative names: ENGINEERED PANEL SYSTEMS CORP
CHASSIS SERVICE (30375 VELMA STREET in LINDSTROM, MN)
STATE MASTER (Minnesota Pollution Control Agency permits and compilance tracking) - RCRAINFO-MND981536949, CESQG, RCRIS-MND981536949, Small Quantity Generators, between 100 kg and 1000 kg of hazardous waste/month (Resource Conservation and Recovery Act (tracking hazardous waste)) - notification Business SIC classification: MOTOR VEHICLE DEALERS (NEW AND USED) Organizations: ANDERSON LYNN (CONTACT/OWNER)
Alternative names: DW AUTO
CHISAGO COUNTY PRESS (12615 LAKE BLVD in LINDSTROM, MN)
STATE MASTER (Minnesota Pollution Control Agency permits and compilance tracking) - RCRAINFO-MND982213670, CESQG, RCRIS-MND982213670, Conditionally Exempt Small Quantity Generators, less than 100 kg/month of hazardous waste (Resource Conservation and Recovery Act (tracking hazardous waste)) - notification Organizations: STAR COMMUNICATIONS (CONTACT/OWNER)
CHISAGO LAKES HIGH SCHOOL (29400 OLINDA TRAIL N in LINDSTROM, MN)
STATE MASTER (Minnesota Pollution Control Agency permits and compilance tracking) - RCRAINFO-MNR000001719, CESQG, RCRIS-MNR000001719, (Resource Conservation and Recovery Act (tracking hazardous waste)) Business SIC classification: ELEMENTARY AND SECONDARY SCHOOLS Organizations: ISD 2144 (CONTACT/OWNER)
CHISAGO LAKES ALC ( in LINDSTROM, MN)
(National Center for Education Statistics) - STATE ID-012144610
CHISAGO LAKES EL. ( in LINDSTROM, MN)
(National Center for Education Statistics) - STATE ID-012144001
CHISAGO LAKES FAMILY CENTER ( in LINDSTROM, MN)
(National Center for Education Statistics) - STATE ID-012144008
CHISAGO LAKES MID. ( in LINDSTROM, MN)
(National Center for Education Statistics) - STATE ID-012144003
CHISAGO LAKES SR. ( in LINDSTROM, MN)
(National Center for Education Statistics) - STATE ID-012144004
CHISAGO LAKES TARGETED SERVICES ( in LINDSTROM, MN)
(National Center for Education Statistics) - STATE ID-012144009
BIO-TEC EMERGENCY SERVICES (29679 295TH LN in LINDSTROM, MN)
Conditionally Exempt Small Quantity Generators, less than 100 kg/month of hazardous waste (Resource Conservation and Recovery Act (tracking hazardous waste)) TRANSPORTER (Resource Conservation and Recovery Act (tracking hazardous waste))
O JAY JUICE CO (13325 LAKES BLVD in LINDSTROM, MN)
Conditionally Exempt Small Quantity Generators, less than 100 kg/month of hazardous waste (Resource Conservation and Recovery Act (tracking hazardous waste)) - notification Organizations: O-JAY JUICE CO (CONTACT/OWNER)
CHISAGO LAKES DRY CLEANERS (12935 LAKE BLVD in LINDSTROM, MN)
Small Quantity Generators, between 100 kg and 1000 kg of hazardous waste/month (Resource Conservation and Recovery Act (tracking hazardous waste)) - notification Organizations: LARSON MARY LOIS (CONTACT/OWNER)
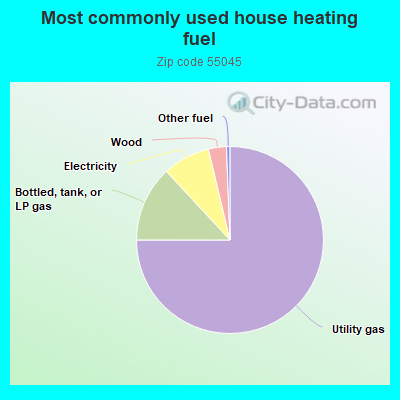
Housing units lacking complete plumbing facilities: 1.7% Housing units lacking complete kitchen facilities: 0.9%
75.0%Utility gas
13.1%Bottled, tank, or LP gas
8.2%Electricity
3.1%Wood
0.6%Other fuel
Population in 1990: 5,991.
Place of birth for U.S.-born residents:
This state: 6,152
Northeast: 13
Midwest: 1,226
South: 53
West: 138
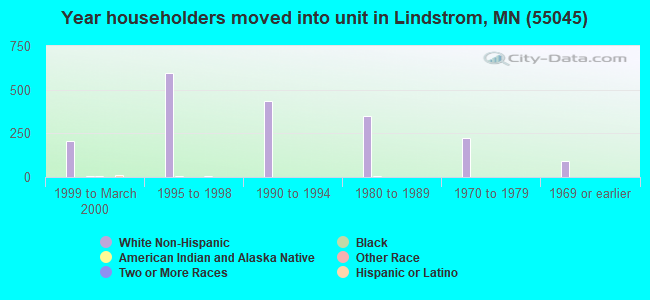
62% of the 55045 zip code residents lived in the same house 5 years ago. Out of people who lived in different houses, 36% lived in this county. Out of people who lived in different counties, 50% lived in Minnesota.
94% of the 55045 zip code residents lived in the same house 1 year ago. Out of people who lived in different houses, 59% moved from this county. Out of people who lived in different houses, 34% moved from different county within same state. Out of people who lived in different houses, 6% moved from different state.
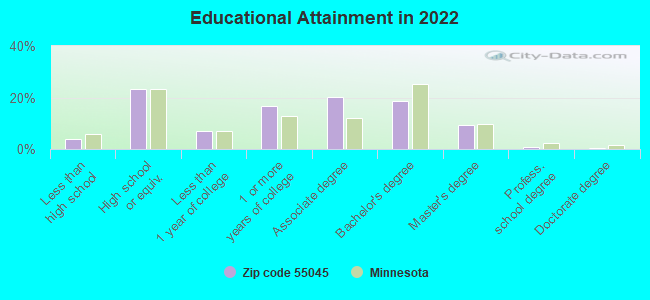
Private vs. public school enrollment:
Students in private schools in grades 1 to 8 (elementary and middle school): 53
Here:
5.8%
Minnesota:
12.9%
Students in private schools in grades 9 to 12 (high school):
Here:
0.0%
Minnesota:
8.6%
Students in private undergraduate colleges: 54
Here:
19.2%
Minnesota:
26.2%
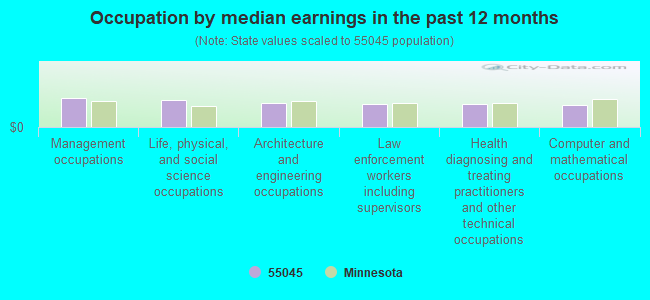
Occupation by median earnings in the past 12 months ($)
102,538Management occupations
95,359Life, physical, and social science occupations
84,585Architecture and engineering occupations
81,107Law enforcement workers including supervisors
80,437Health diagnosing and treating practitioners and other technical occupations
78,487Computer and mathematical occupations
Companies with federal contracts located in this zip code:
TERMOIDRAULICA VERSILIA DI TOR (VIA BOZZA 33 in PIETRASANTA, In; small business)
$398,000 with Alcohol and Tobacco Tax and Trade Bureau for Draperies, Awnings, and Shades. Taking place in VA. Signed on 2001-09-15. Completion date: 2001-10-15.
Top industries in this zip code by the number of employees in 2005:
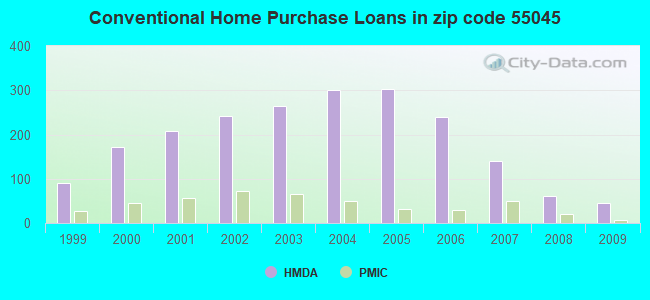
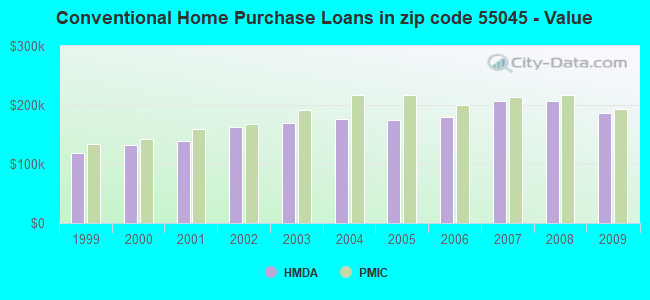
Detailed PMIC statistics for the following Tracts:1105.00
, 1106.00
2002 - 2018 National Fire Incident Reporting System (NFIRS) incidents
Based on the data from the years 2002 - 2018 the average number of fire incidents per year is 17. The highest number of fire incidents - 28 took place in 2012, and the least - 10 in 2011. The data has an increasing trend.
When looking into fire subcategories, the most reports belonged to: Structure Fires (43.5%), and Outside Fires (30.5%).
Fire incident types reported to NFIRS in Zip Code 55045
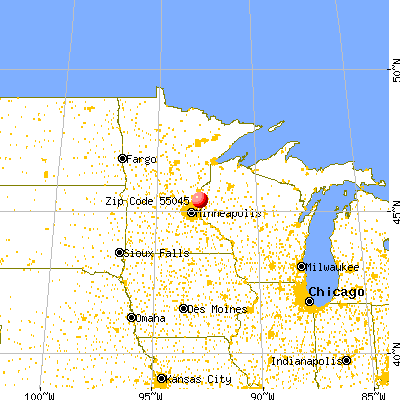


 Nearest zip codes: 55012, 55013, 55074, 55073, 55084, 55056.


 Based on the data from the years 2002 - 2018 the average number of fire incidents per year is 17. The highest number of fire incidents - 28 took place in 2012, and the least - 10 in 2011. The data has an increasing trend.
 When looking into fire subcategories, the most reports belonged to: Structure Fires (43.5%), and Outside Fires (30.5%).