Estimated zip code population in 2022: 3,180 Zip code population in 2010: 2,693 Zip code population in 2000: 2,565
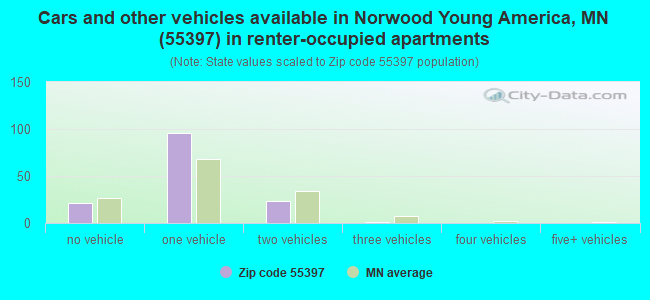
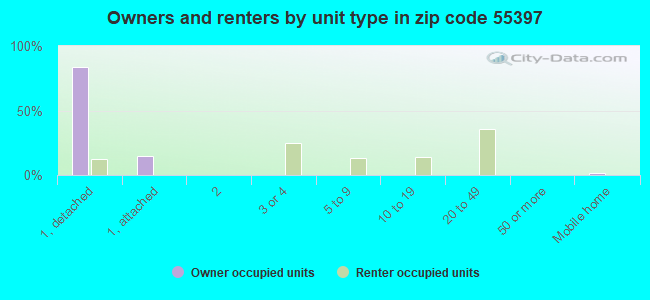
Houses and condos: 1,190 Renter-occupied apartments: 140
% of renters here:
12%
State:
28%
March 2022 cost of living index in zip code 55397: 113.6 (more than average, U.S. average is 100)
Land area: 27.3 sq. mi. Water area: 1.2 sq. mi.
Population density: 117 people per square mile
(very low).
OSM Map
General Map
Google Map
MSN Map
OSM Map
General Map
Google Map
MSN Map
OSM Map
General Map
Google Map
MSN Map
OSM Map
General Map
Google Map
MSN Map
Please wait while loading the map...
Real estate property taxes paid for housing units in 2022:
This zip code:
0.9% ($3,104)
Minnesota:
1.0% ($3,087)
Median real estate property taxes paid for housing units with mortgages in 2022: $3,010 (0.9%) Median real estate property taxes paid for housing units with no mortgage in 2022: $3,242 (1.1%)
Business Search- 14 Million verified businesses
Males: 1,656
(52.1%)
Females: 1,523
(47.9%)
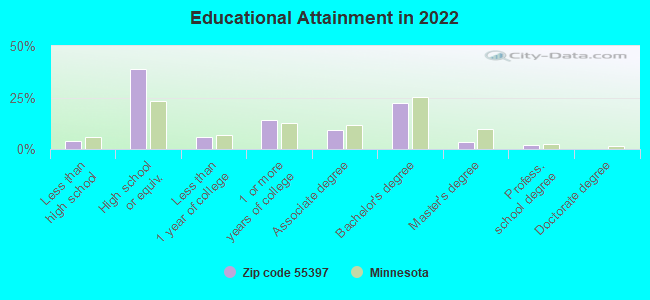
For population 25 years and over in 55397:
High school or higher: 94.6%
Bachelor's degree or higher: 27.1%
Graduate or professional degree: 5.3%
Unemployed: 4.9%
Mean travel time to work (commute): 26.9 minutes
For population 15 years and over in 55397:
Never married: 26.2%
Now married: 61.8%
Separated: 0.0%
Widowed: 4.4%
Divorced: 7.5%
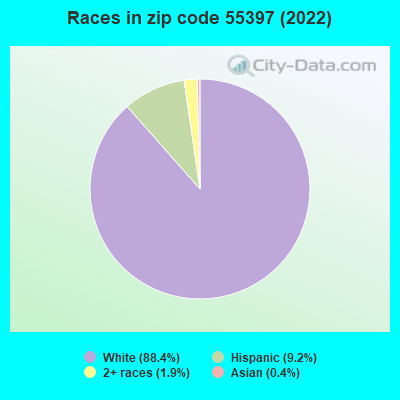
Zip code 55397 compared to state average:
Black race population percentage significantly below state average.
Renting percentage significantly below state average.
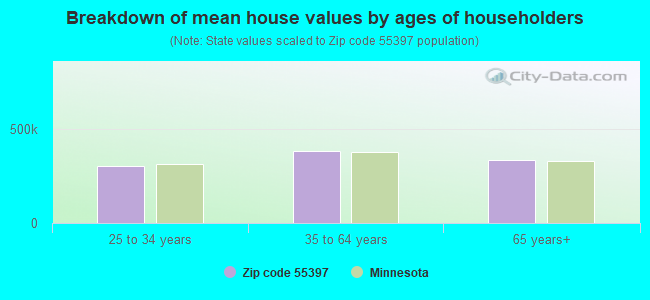
Estimated median house/condo value in 2022: $335,113
55397:
$335,113
Minnesota:
$314,600
Median resident age:
This zip code:
38.9 years
Minnesota median age:
39.0 years
Average household size:
This zip code:
2.7 people
Minnesota:
2.4 people
Averages for the 2020 tax year for zip code 55397, filed in 2021:
Average Adjusted Gross Income (AGI) in 2020: $67,530 (Individual Income Tax Returns)
Here:
$67,530
State:
$82,178
Salary/wage: $60,408 (reported on 82.8% of returns)
Here:
$60,408
State:
$67,438
(% of AGI for various income ranges: 1334.8% for AGIs below $25k, 3891.2% for AGIs $25k-50k, 6442.1% for AGIs $50k-75k, 9876.9% for AGIs $75k-100k, 17799.4% for AGIs $100k-200k)
Taxable interest for individuals: $954 (reported on 35.8% of returns)
This zip code:
$954
Minnesota:
$1,814
(% of AGI for various income ranges: 46.2% for AGIs below $25k, 34.6% for AGIs $25k-50k, 31.6% for AGIs $50k-75k, 75.4% for AGIs $75k-100k, 85.9% for AGIs $100k-200k)
Ordinary dividends: $1,871 (reported on 22.5% of returns)
Here:
$1,871
State:
$6,928
(% of AGI for various income ranges: 25.2% for AGIs below $25k, 27.1% for AGIs $25k-50k, 57.4% for AGIs $50k-75k, 93.1% for AGIs $75k-100k, 134.1% for AGIs $100k-200k)
Net capital gain/loss in AGI: +$6,525 (reported on 21.2% of returns)
Here:
+$6,525
State:
+$20,591
(% of AGI for various income ranges: 17.1% for AGIs below $25k, 14.6% for AGIs $25k-50k, 28.9% for AGIs $50k-75k, 290.8% for AGIs $75k-100k, 570.6% for AGIs $100k-200k)
Profit/loss from business: +$10,863 (reported on 12.6% of returns)
Here:
+$10,863
State:
+$14,342
(% of AGI for various income ranges: 101.0% for AGIs below $25k, 170.4% for AGIs $25k-50k, 182.6% for AGIs $50k-75k, 331.5% for AGIs $75k-100k, 391.2% for AGIs $100k-200k)
Taxable individual retirement arrangement distribution: $17,581 (reported on 13.9% of returns)
55397:
$17,581
Minnesota:
$20,675
(% of AGI for various income ranges: 180.5% for AGIs below $25k, 273.3% for AGIs $25k-50k, 371.1% for AGIs $50k-75k, 505.4% for AGIs $75k-100k, 761.8% for AGIs $100k-200k)
Total itemized deductions: $26,775 (reported on 7.9% of returns)
Here:
$26,775
State:
$33,311
(% of AGI for various income ranges: 210.5% for AGIs below $25k, 581.1% for AGIs $50k-75k, 980.6% for AGIs $100k-200k)
Charity contributions: $5,689 (reported on 6.0% of returns)
Here:
$5,689
State:
$11,879
(% of AGI for various income ranges: 96.8% for AGIs $50k-75k, 192.9% for AGIs $100k-200k)
Taxes paid: $7,725 (reported on 7.9% of returns)
55397:
$7,725
State:
$8,252
(% of AGI for various income ranges: 222.1% for AGIs $50k-75k, 297.1% for AGIs $100k-200k)
Earned income credit: $1,782 (reported on 7.3% of returns)
Here:
$1,782
State:
$2,055
(% of AGI for various income ranges: 54.3% for AGIs below $25k, 34.2% for AGIs $25k-50k)
Percentage of individuals using paid preparers for their 2020 taxes: 93.4%
Here:
93%
State:
94%
(% for various income ranges: 91.7% for AGIs below $25k, 91.2% for AGIs $25k-50k, 96.2% for AGIs $50k-75k, 95.0% for AGIs $75k-100k, 96.7% for AGIs $100k-200k, 80.0% for AGIs over 200k)
Averages for the 2012 tax year for zip code 55397, filed in 2013:
Average Adjusted Gross Income (AGI) in 2012: $57,764 (Individual Income Tax Returns)
Here:
$57,764
State:
$67,192
Salary/wage: $50,187 (reported on 89.1% of returns)
Here:
$50,187
State:
$55,182
(% of AGI for various income ranges: 77.3% for AGIs below $25k, 79.6% for AGIs $25k-50k, 76.9% for AGIs $50k-75k, 84.6% for AGIs $75k-100k, 99.7% for AGIs $100k-200k)
Taxable interest for individuals: $980 (reported on 39.5% of returns)
This zip code:
$980
Minnesota:
$1,664
(% of AGI for various income ranges: 1.8% for AGIs below $25k, 0.8% for AGIs $25k-50k, 0.5% for AGIs $50k-75k, 0.7% for AGIs $75k-100k, 0.7% for AGIs $100k-200k)
Ordinary dividends: $1,186 (reported on 21.7% of returns)
Here:
$1,186
State:
$5,665
(% of AGI for various income ranges: 1.1% for AGIs below $25k, 0.4% for AGIs $25k-50k, 0.6% for AGIs $50k-75k, 0.4% for AGIs $75k-100k, 0.4% for AGIs $100k-200k)
Net capital gain/loss in AGI: +$15,343 (reported on 16.3% of returns)
Here:
+$15,343
State:
+$16,131
(% of AGI for various income ranges: 0.9% for AGIs $50k-75k, 0.9% for AGIs $75k-100k, 14.3% for AGIs $100k-200k)
Profit/loss from business: +$9,306 (reported on 12.4% of returns)
Here:
+$9,306
State:
+$12,430
(% of AGI for various income ranges: 5.3% for AGIs below $25k, 4.0% for AGIs $25k-50k, 3.2% for AGIs $50k-75k, 1.3% for AGIs $75k-100k, 0.7% for AGIs $100k-200k)
Taxable individual retirement arrangement distribution: $13,712 (reported on 12.4% of returns)
55397:
$13,712
Minnesota:
$15,212
(% of AGI for various income ranges: 3.8% for AGIs below $25k, 4.1% for AGIs $25k-50k, 3.7% for AGIs $50k-75k, 1.8% for AGIs $75k-100k, 3.7% for AGIs $100k-200k)
Total itemized deductions: $19,331 (22% of AGI, reported on 41.9% of returns)
Here:
$19,331
State:
$24,665
Here:
21.7% of AGI
State:
19.6% of AGI
(% of AGI for various income ranges: 11.2% for AGIs below $25k, 13.0% for AGIs $25k-50k, 13.0% for AGIs $50k-75k, 14.6% for AGIs $75k-100k, 20.6% for AGIs $100k-200k)
Charity contributions: $3,064 (reported on 34.9% of returns)
Here:
$3,064
State:
$3,948
(% of AGI for various income ranges: 1.5% for AGIs below $25k, 1.2% for AGIs $25k-50k, 1.5% for AGIs $50k-75k, 2.0% for AGIs $75k-100k, 3.1% for AGIs $100k-200k)
Taxes paid: $7,113 (reported on 41.9% of returns)
55397:
$7,113
State:
$10,589
(% of AGI for various income ranges: 2.0% for AGIs below $25k, 3.1% for AGIs $25k-50k, 3.9% for AGIs $50k-75k, 5.3% for AGIs $75k-100k, 9.5% for AGIs $100k-200k)
Earned income credit: $1,942 (reported on 9.3% of returns)
Here:
$1,942
State:
$2,037
(% of AGI for various income ranges: 3.9% for AGIs below $25k, 0.4% for AGIs $25k-50k)
Percentage of individuals using paid preparers for their 2012 taxes: 60.5%
Here:
60%
State:
55%
(% for various income ranges: 48.8% for AGIs below $25k, 58.6% for AGIs $25k-50k, 68.2% for AGIs $50k-75k, 68.4% for AGIs $75k-100k, 81.2% for AGIs $100k-200k)
Averages for the 2004 tax year for zip code 55397, filed in 2005:
Average Adjusted Gross Income (AGI) in 2004: $45,328 (Individual Income Tax Returns)
Here:
$45,328
State:
$53,560
Salary/wage: $42,486 (reported on 90.1% of returns)
Here:
$42,486
State:
$46,177
(% of AGI for various income ranges: 120.4% for AGIs below $10k, 76.3% for AGIs $10k-25k, 85.4% for AGIs $25k-50k, 85.2% for AGIs $50k-75k, 93.7% for AGIs $75k-100k, 75.4% for AGIs over 100k)
Taxable interest for individuals: $1,285 (reported on 54.0% of returns)
This zip code:
$1,285
Minnesota:
$1,796
(% of AGI for various income ranges: 5.8% for AGIs below $10k, 5.0% for AGIs $10k-25k, 1.6% for AGIs $25k-50k, 1.4% for AGIs $50k-75k, 0.8% for AGIs $75k-100k, 1.0% for AGIs over 100k)
Taxable dividends: $653 (reported on 27.6% of returns)
Here:
$653
State:
$3,096
(% of AGI for various income ranges: 1.4% for AGIs below $10k, 1.1% for AGIs $10k-25k, 0.3% for AGIs $25k-50k, 0.3% for AGIs $50k-75k, 0.1% for AGIs $75k-100k, 0.5% for AGIs over 100k)
Net capital gain/loss: +$5,650 (reported on 21.5% of returns)
Here:
+$5,650
State:
+$10,864
(% of AGI for various income ranges: -1.7% for AGIs below $10k, 0.5% for AGIs $10k-25k, 1.2% for AGIs $25k-50k, 0.4% for AGIs $50k-75k, 0.1% for AGIs $75k-100k, 9.5% for AGIs over 100k)
Profit/loss from business: +$8,801 (reported on 13.3% of returns)
Here:
+$8,801
State:
+$10,442
(% of AGI for various income ranges: 1.2% for AGIs $10k-25k, 3.1% for AGIs $25k-50k, 2.8% for AGIs $50k-75k, 1.2% for AGIs $75k-100k, 3.5% for AGIs over 100k)
IRA payment deduction: $2,571 (reported on 2.9% of returns)
55397:
$2,571
Minnesota:
$2,955
Total itemized deductions: $16,284 (23% of AGI, reported on 44.4% of returns)
Here:
$16,284
State:
$20,035
Here:
23.1% of AGI
State:
21.3% of AGI
(% of AGI for various income ranges: 13.1% for AGIs below $10k, 13.2% for AGIs $10k-25k, 15.1% for AGIs $25k-50k, 16.5% for AGIs $50k-75k, 16.9% for AGIs $75k-100k, 16.2% for AGIs over 100k)
Charity contributions deductions: $2,584 (4% of AGI, reported on 41.4% of returns)
Here:
$2,584
State:
$3,333
Here:
3.6% of AGI
State:
3.4% of AGI
(% of AGI for various income ranges: 2.1% for AGIs $10k-25k, 1.4% for AGIs $25k-50k, 2.2% for AGIs $50k-75k, 2.6% for AGIs $75k-100k, 3.4% for AGIs over 100k)
Total tax: $5,525 (reported on 79.9% of returns)
55397:
$5,525
State:
$8,485
(% of AGI for various income ranges: 2.2% for AGIs below $10k, 4.4% for AGIs $10k-25k, 7.8% for AGIs $25k-50k, 8.3% for AGIs $50k-75k, 9.3% for AGIs $75k-100k, 15.3% for AGIs over 100k)
Earned income credit: $1,388 (reported on 6.6% of returns)
Here:
$1,388
State:
$1,523
Percentage of individuals using paid preparers for their 2004 taxes: 63.7%
Here:
64%
State:
59%
(% for various income ranges: 51.5% for AGIs below $10k, 63.0% for AGIs $10k-25k, 63.7% for AGIs $25k-50k, 69.7% for AGIs $50k-75k, 72.7% for AGIs $75k-100k, 68.5% for AGIs over 100k)
Household received Food Stamps/SNAP in the past 12 months: 47 Household did not receive Food Stamps/SNAP in the past 12 months: 1,127
Women who had a birth in the past 12 months: 8 (7 now married, 0 unmarried) Women who did not have a birth in the past 12 months: 644 (331 now married, 313 unmarried)
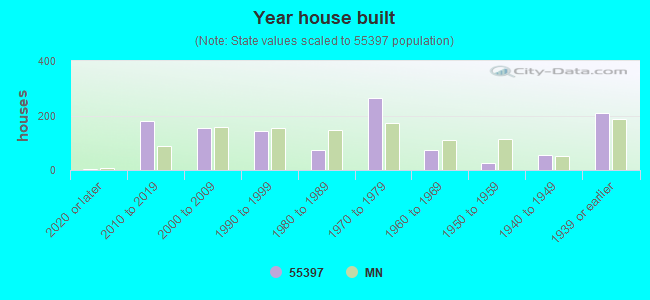
Housing units in zip code 55397 with a mortgage: 744 (17 second mortgage, 16 both second mortgage and home equity loan) Houses without a mortgage: 52
Median monthly owner costs for units with a mortgage: $1,546 Median monthly owner costs for units without a mortgage: $660
Residents with income below the poverty level in 2022:
This zip code:
8.3%
Whole state:
9.6%
Residents with income below 50% of the poverty level in 2022:
This zip code:
0.8%
Whole state:
5.2%
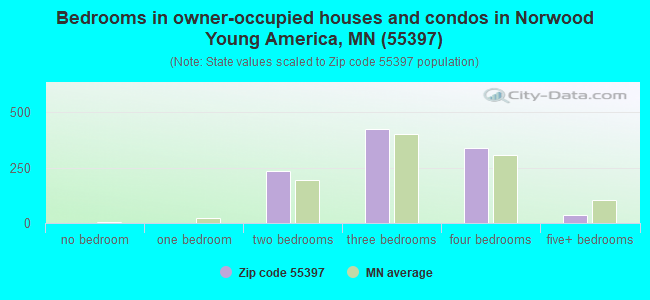
Median number of rooms in houses and condos:
Here:
6.9
State:
7.1
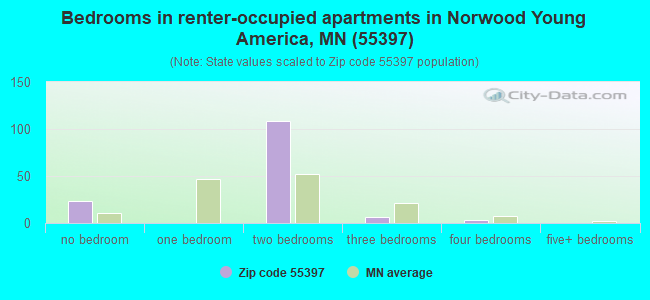
Median number of rooms in apartments:
Here:
4.1
State:
3.8
Notable locations in this zip code not listed on our city pages
Notable locations in zip code 55397: Young America Industrial Park (A), Norwood - Young America Fire Department North Station (B), Young America City Hall (C), Young America Library (D). Display/hide their locations on the map
Lakes: Barlous Lake (A), Barnes Lake (B), Baylor Lake (C), Young America Lake (D), Smith Lake (E), Rice Lake (F), Myers Lake (G), Eagle Lake (H). Display/hide their locations on the map
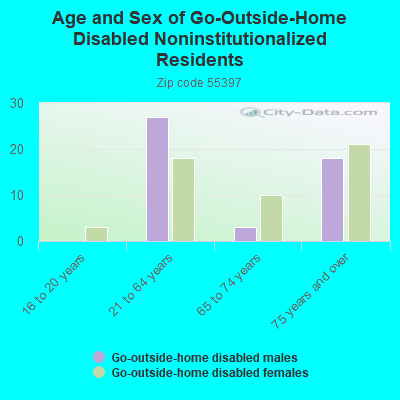
In group quarters: 6 (-1 institutionalized population)
Size of family households: 391 2-persons, 109 3-persons, 94 4-persons, 106 5-persons, 6 6-persons, 110 7-or-more-persons
Size of nonfamily households: 283 1-person, 75 2-persons
585 married couples with children.
73 single-parent households (7 men, 66 women).
92.0% of residents of 55397 zip code speak English at home.
7.0% of residents speak Spanish at home (4% very well, 88% well, 8% not well).
0.7% of residents speak other Indo-European language at home (100% very well).
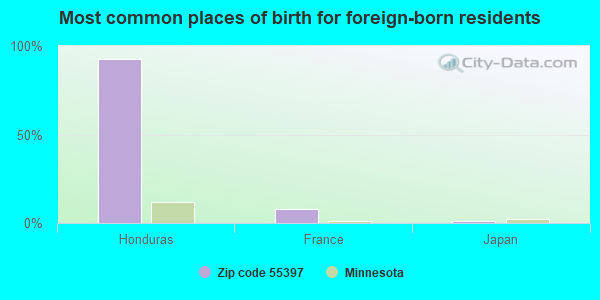
Foreign born population: 195 (6.1%) (47.7% of them are naturalized citizens)
This zip code:
6.1%
Whole state:
8.7%
93%Honduras
8%France
1%Japan
1%Cambodia
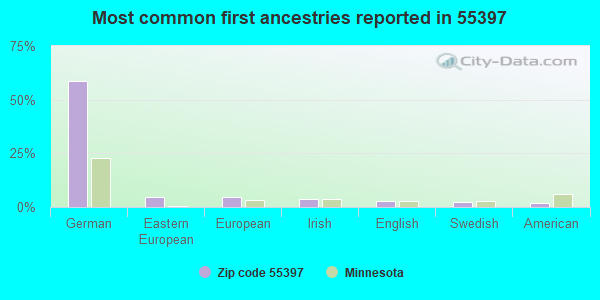
59%German
5%Eastern European
5%European
4%Irish
3%English
2%Swedish
2%American
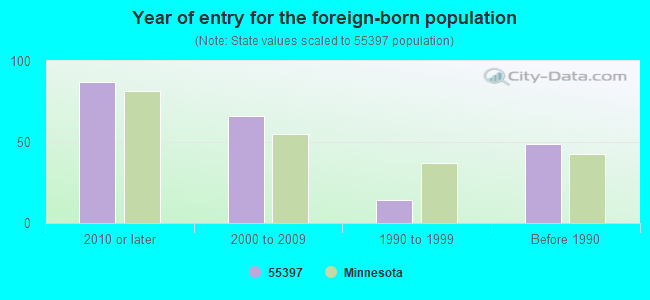
Year of entry for the foreign-born population
872010 or later
662000 to 2009
141990 to 1999
49Before 1990
Facilities with environmental interests located in this zip code:
BAYLOR REGIONAL PARK CARVER COUNTY (10775 COUNTY ROAD 33 in YOUNG AMERICA, MN)
STATE MASTER (Minnesota Pollution Control Agency permits and compilance tracking) - RCRAINFO-MND982072407, CESQG, RCRIS-MND982072407, (Resource Conservation and Recovery Act (tracking hazardous waste)) Business SIC classification: AMUSEMENT AND RECREATION SERVICES Organizations: CARVER CO PUBLIC WORKS (CONTACT/OWNER)
AXEL RICHARD C DDS PA (216 MAIN ST E in YOUNG AMERICA, MN)
STATE MASTER (Minnesota Pollution Control Agency permits and compilance tracking) - RCRAINFO-MND985677566, CESQG, RCRIS-MND985677566, Small Quantity Generators, between 100 kg and 1000 kg of hazardous waste/month (Resource Conservation and Recovery Act (tracking hazardous waste)) - notification Business SIC classification: OFFICES AND CLINICS OF DENTISTS Business NAICS classification: OFFICES OF DENTISTS. Organizations: AXEL RICHARD DDS (CONTACT/OWNER)
Alternative names: AXEL RICHARD DDS
Housing units lacking complete plumbing facilities: 0.5% Housing units lacking complete kitchen facilities: 4.8%
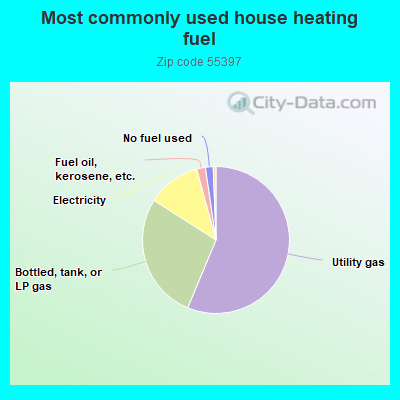
56.2%Utility gas
27.7%Bottled, tank, or LP gas
11.7%Electricity
1.9%Fuel oil, kerosene, etc.
1.7%No fuel used
0.6%Wood
Population in 1990: 2,527. Population change in the 1990s: +38 (+1.5%).
Place of birth for U.S.-born residents:
This state: 2,381
Midwest: 434
South: 58
West: 83
71% of the 55397 zip code residents lived in the same house 5 years ago. Out of people who lived in different houses, 60% lived in this county. Out of people who lived in different counties, 50% lived in Minnesota.
96% of the 55397 zip code residents lived in the same house 1 year ago. Out of people who lived in different houses, 47% moved from this county. Out of people who lived in different houses, 57% moved from different county within same state.
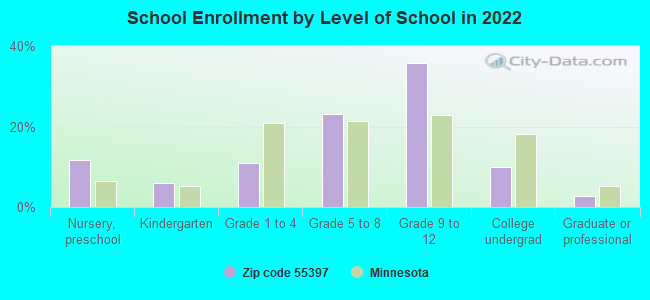
Private vs. public school enrollment:
Students in private schools in grades 1 to 8 (elementary and middle school): 18
Here:
9.7%
Minnesota:
12.9%
Students in private schools in grades 9 to 12 (high school): 2
Here:
1.1%
Minnesota:
8.6%
Students in private undergraduate colleges: 32
Here:
55.1%
Minnesota:
26.2%
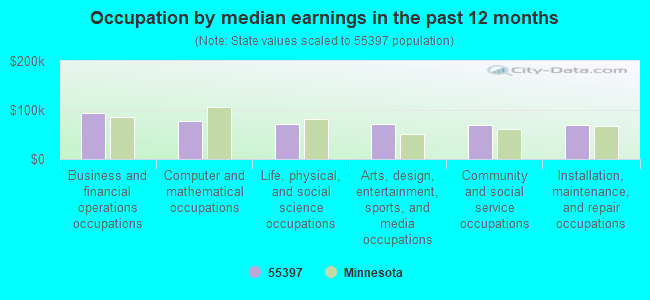
Occupation by median earnings in the past 12 months ($)
94,834Business and financial operations occupations
77,797Computer and mathematical occupations
71,623Life, physical, and social science occupations
70,793Arts, design, entertainment, sports, and media occupations
68,766Community and social service occupations
68,555Installation, maintenance, and repair occupations
Top industries in this zip code by the number of employees in 2005:
Administrative and Support and Waste Management and Remediation Services: Temporary Help Services (250-499 employees: 1 establishment)
Administrative and Support and Waste Management and Remediation Services: All Other Support Services (250-499: 1)
Administrative and Support and Waste Management and Remediation Services: Landscaping Services (20-49: 1, 1-4: 2)
Accommodation and Food Services: Full-Service Restaurants (20-49: 1)
Educational Services: Elementary and Secondary Schools (20-49: 1)
Finance and Insurance: Commercial Banking (20-49: 1)
Professional, Scientific, and Technical Services: Veterinary Services (10-19: 1)
Accommodation and Food Services: Limited-Service Restaurants (10-19: 1)
People in group quarters in 2010:
4 people in group homes intended for adults
Fatal accident statistics in 2013:
Fatal accident count: 1
Vehicles involved in fatal accidents: 3
Fatal accidents caused by drunken drivers: 0
Fatalities: 1
Persons involved in fatal accidents: 5
Pedestrians involved in fatal accidents: 0
Fatal accident statistics in 2012:
Fatal accident count: 1
Vehicles involved in fatal accidents: 1
Fatal accidents caused by drunken drivers: 1
Fatalities: 1
Persons involved in fatal accidents: 1
Pedestrians involved in fatal accidents: 0
Home Mortgage Disclosure Act Aggregated Statistics For Year 2009 (Based on 4 partial tracts)
A) FHA, FSA/RHS & VA Home Purchase Loans
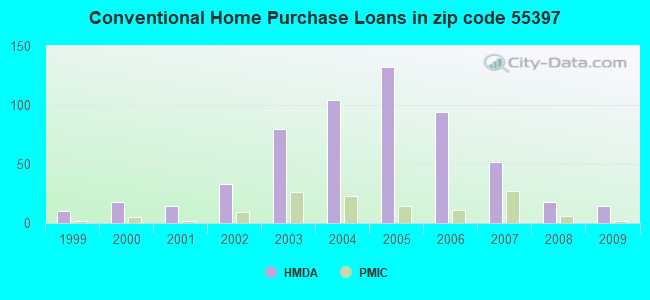
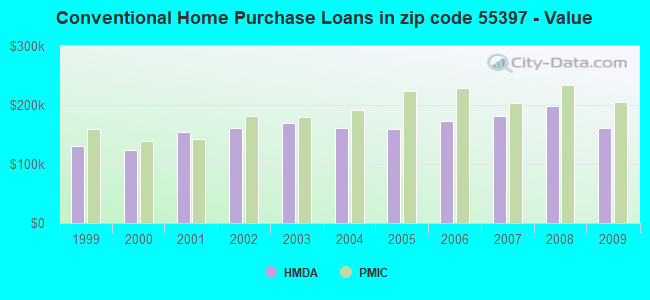
B) Conventional Home Purchase Loans
C) Refinancings
D) Home Improvement Loans
F) Non-occupant Loans on < 5 Family Dwellings (A B C & D)
G) Loans On Manufactured Home Dwelling (A B C & D)
Number
Average Value
Number
Average Value
Number
Average Value
Number
Average Value
Number
Average Value
Number
Average Value
LOANS ORIGINATED
27
$158,232
14
$160,416
94
$189,712
6
$83,737
5
$123,934
1
$49,020
APPLICATIONS APPROVED, NOT ACCEPTED
3
$145,887
2
$158,450
9
$220,357
0
$0
1
$108,630
0
$0
APPLICATIONS DENIED
5
$144,576
3
$113,613
33
$204,310
1
$7,860
0
$0
0
$0
APPLICATIONS WITHDRAWN
1
$96,450
2
$128,695
32
$208,345
1
$72,020
1
$150,600
0
$0
FILES CLOSED FOR INCOMPLETENESS
0
$0
0
$0
7
$209,616
1
$30,630
0
$0
0
$0
Aggregated Statistics For Year 2008 (Based on 4 partial tracts)
A) FHA, FSA/RHS & VA Home Purchase Loans
B) Conventional Home Purchase Loans
C) Refinancings
D) Home Improvement Loans
F) Non-occupant Loans on < 5 Family Dwellings (A B C & D)
G) Loans On Manufactured Home Dwelling (A B C & D)
Number
Average Value
Number
Average Value
Number
Average Value
Number
Average Value
Number
Average Value
Number
Average Value
LOANS ORIGINATED
18
$175,903
18
$197,703
44
$188,920
8
$54,154
4
$176,900
1
$102,220
APPLICATIONS APPROVED, NOT ACCEPTED
2
$162,435
0
$0
6
$209,763
0
$0
0
$0
0
$0
APPLICATIONS DENIED
2
$179,830
5
$175,694
42
$212,855
4
$83,478
3
$279,573
1
$49,470
APPLICATIONS WITHDRAWN
1
$238,540
1
$215,360
9
$231,177
2
$136,075
1
$216,210
0
$0
FILES CLOSED FOR INCOMPLETENESS
0
$0
1
$174,460
5
$189,614
0
$0
1
$79,680
0
$0
Aggregated Statistics For Year 2007 (Based on 4 partial tracts)
A) FHA, FSA/RHS & VA Home Purchase Loans
B) Conventional Home Purchase Loans
C) Refinancings
D) Home Improvement Loans
F) Non-occupant Loans on < 5 Family Dwellings (A B C & D)
G) Loans On Manufactured Home Dwelling (A B C & D)
Number
Average Value
Number
Average Value
Number
Average Value
Number
Average Value
Number
Average Value
Number
Average Value
LOANS ORIGINATED
4
$173,355
52
$182,198
75
$173,962
10
$80,254
9
$145,027
1
$12,580
APPLICATIONS APPROVED, NOT ACCEPTED
0
$0
7
$173,749
17
$138,974
3
$115,503
1
$116,710
0
$0
APPLICATIONS DENIED
3
$169,570
12
$151,664
55
$191,865
4
$103,122
6
$123,650
2
$46,655
APPLICATIONS WITHDRAWN
0
$0
9
$174,540
34
$201,476
1
$75,760
4
$150,008
0
$0
FILES CLOSED FOR INCOMPLETENESS
0
$0
1
$342,870
10
$190,677
0
$0
0
$0
0
$0
Aggregated Statistics For Year 2006 (Based on 4 partial tracts)
A) FHA, FSA/RHS & VA Home Purchase Loans
B) Conventional Home Purchase Loans
C) Refinancings
D) Home Improvement Loans
F) Non-occupant Loans on < 5 Family Dwellings (A B C & D)
G) Loans On Manufactured Home Dwelling (A B C & D)
Number
Average Value
Number
Average Value
Number
Average Value
Number
Average Value
Number
Average Value
Number
Average Value
LOANS ORIGINATED
5
$205,714
94
$173,008
102
$153,446
20
$62,633
8
$162,262
1
$41,520
APPLICATIONS APPROVED, NOT ACCEPTED
0
$0
8
$285,624
25
$180,268
3
$51,687
2
$288,535
0
$0
APPLICATIONS DENIED
1
$222,380
15
$193,666
54
$183,790
8
$61,132
4
$170,208
0
$0
APPLICATIONS WITHDRAWN
0
$0
13
$246,986
39
$160,935
1
$141,370
4
$138,262
0
$0
FILES CLOSED FOR INCOMPLETENESS
0
$0
1
$105,890
13
$211,897
0
$0
1
$79,680
0
$0
Aggregated Statistics For Year 2005 (Based on 4 partial tracts)
A) FHA, FSA/RHS & VA Home Purchase Loans
B) Conventional Home Purchase Loans
C) Refinancings
D) Home Improvement Loans
E) Loans on Dwellings For 5+ Families
F) Non-occupant Loans on < 5 Family Dwellings (A B C & D)
G) Loans On Manufactured Home Dwelling (A B C & D)
Number
Average Value
Number
Average Value
Number
Average Value
Number
Average Value
Number
Average Value
Number
Average Value
Number
Average Value
LOANS ORIGINATED
7
$197,876
132
$158,603
104
$170,682
8
$59,861
0
$0
15
$114,211
1
$18,700
APPLICATIONS APPROVED, NOT ACCEPTED
1
$122,140
7
$88,993
11
$178,360
2
$28,040
0
$0
1
$59,760
0
$0
APPLICATIONS DENIED
0
$0
18
$156,836
48
$181,196
7
$106,781
1
$15,730
4
$148,182
2
$28,585
APPLICATIONS WITHDRAWN
1
$114,450
9
$164,297
43
$192,067
3
$128,433
0
$0
2
$255,455
1
$22,540
FILES CLOSED FOR INCOMPLETENESS
0
$0
5
$152,090
22
$185,080
1
$27,400
0
$0
0
$0
0
$0
Aggregated Statistics For Year 2004 (Based on 4 partial tracts)
A) FHA, FSA/RHS & VA Home Purchase Loans
B) Conventional Home Purchase Loans
C) Refinancings
D) Home Improvement Loans
E) Loans on Dwellings For 5+ Families
F) Non-occupant Loans on < 5 Family Dwellings (A B C & D)
G) Loans On Manufactured Home Dwelling (A B C & D)
Number
Average Value
Number
Average Value
Number
Average Value
Number
Average Value
Number
Average Value
Number
Average Value
Number
Average Value
LOANS ORIGINATED
8
$186,968
104
$161,295
106
$154,178
15
$57,711
1
$117,420
13
$114,025
1
$154,490
APPLICATIONS APPROVED, NOT ACCEPTED
0
$0
11
$131,116
20
$155,923
2
$30,195
0
$0
1
$35,460
0
$0
APPLICATIONS DENIED
0
$0
13
$213,605
31
$171,904
8
$51,272
0
$0
4
$141,768
1
$100,560
APPLICATIONS WITHDRAWN
1
$73,390
12
$194,287
31
$158,182
0
$0
0
$0
1
$204,350
0
$0
FILES CLOSED FOR INCOMPLETENESS
1
$170,410
2
$138,145
26
$174,316
1
$26,210
0
$0
0
$0
1
$119,520
Aggregated Statistics For Year 2003 (Based on 4 partial tracts)
A) FHA, FSA/RHS & VA Home Purchase Loans
B) Conventional Home Purchase Loans
C) Refinancings
D) Home Improvement Loans
F) Non-occupant Loans on < 5 Family Dwellings (A B C & D)
Number
Average Value
Number
Average Value
Number
Average Value
Number
Average Value
Number
Average Value
LOANS ORIGINATED
10
$175,864
80
$168,807
222
$149,973
8
$34,025
6
$132,170
APPLICATIONS APPROVED, NOT ACCEPTED
1
$70,770
9
$264,738
16
$135,524
1
$26,320
2
$133,615
APPLICATIONS DENIED
2
$197,935
12
$178,514
55
$158,314
6
$26,237
5
$105,900
APPLICATIONS WITHDRAWN
0
$0
11
$209,817
42
$155,071
1
$114,800
1
$187,960
FILES CLOSED FOR INCOMPLETENESS
0
$0
1
$208,010
11
$188,389
1
$42,410
0
$0
Aggregated Statistics For Year 2002 (Based on 2 partial tracts)
A) FHA, FSA/RHS & VA Home Purchase Loans
B) Conventional Home Purchase Loans
C) Refinancings
D) Home Improvement Loans
E) Loans on Dwellings For 5+ Families
F) Non-occupant Loans on < 5 Family Dwellings (A B C & D)
Number
Average Value
Number
Average Value
Number
Average Value
Number
Average Value
Number
Average Value
Number
Average Value
LOANS ORIGINATED
9
$170,714
33
$160,977
68
$145,728
8
$63,756
1
$52,420
3
$113,053
APPLICATIONS APPROVED, NOT ACCEPTED
0
$0
5
$224,776
5
$162,816
1
$4,190
0
$0
0
$0
APPLICATIONS DENIED
0
$0
7
$148,274
11
$133,957
3
$51,197
0
$0
3
$90,513
APPLICATIONS WITHDRAWN
1
$102,740
2
$208,370
18
$167,773
0
$0
0
$0
0
$0
FILES CLOSED FOR INCOMPLETENESS
0
$0
1
$132,620
9
$142,699
0
$0
0
$0
1
$57,660
Aggregated Statistics For Year 2001 (Based on 2 partial tracts)
A) FHA, FSA/RHS & VA Home Purchase Loans
B) Conventional Home Purchase Loans
C) Refinancings
D) Home Improvement Loans
E) Loans on Dwellings For 5+ Families
F) Non-occupant Loans on < 5 Family Dwellings (A B C & D)
Number
Average Value
Number
Average Value
Number
Average Value
Number
Average Value
Number
Average Value
Number
Average Value
LOANS ORIGINATED
2
$114,275
14
$153,404
61
$141,001
11
$33,692
0
$0
4
$132,752
APPLICATIONS APPROVED, NOT ACCEPTED
0
$0
2
$112,180
5
$103,582
2
$9,960
0
$0
0
$0
APPLICATIONS DENIED
0
$0
3
$148,350
13
$146,655
2
$14,155
0
$0
0
$0
APPLICATIONS WITHDRAWN
0
$0
2
$91,995
22
$110,582
1
$47,180
1
$1,343,520
1
$47,180
FILES CLOSED FOR INCOMPLETENESS
0
$0
2
$118,205
6
$128,342
1
$26,210
0
$0
0
$0
Aggregated Statistics For Year 2000 (Based on 2 partial tracts)
A) FHA, FSA/RHS & VA Home Purchase Loans
B) Conventional Home Purchase Loans
C) Refinancings
D) Home Improvement Loans
F) Non-occupant Loans on < 5 Family Dwellings (A B C & D)
Number
Average Value
Number
Average Value
Number
Average Value
Number
Average Value
Number
Average Value
LOANS ORIGINATED
6
$124,323
18
$124,439
20
$108,693
9
$23,414
3
$90,163
APPLICATIONS APPROVED, NOT ACCEPTED
0
$0
3
$144,680
1
$98,550
3
$12,580
1
$93,310
APPLICATIONS DENIED
1
$125,810
4
$90,292
5
$72,234
3
$7,340
0
$0
APPLICATIONS WITHDRAWN
1
$112,180
1
$36,170
8
$76,009
0
$0
0
$0
FILES CLOSED FOR INCOMPLETENESS
0
$0
0
$0
2
$108,510
0
$0
0
$0
Aggregated Statistics For Year 1999 (Based on 1 partial tract)
A) FHA, FSA/RHS & VA Home Purchase Loans
B) Conventional Home Purchase Loans
C) Refinancings
D) Home Improvement Loans
F) Non-occupant Loans on < 5 Family Dwellings (A B C & D)

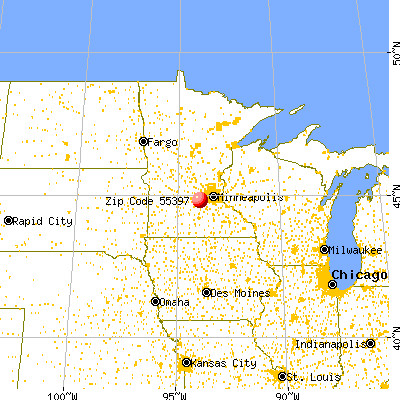


 Nearest zip codes: 55367, 55368, 55360, 55339, 55370, 55354.