Estimated zip code population in 2022: 28,926 Zip code population in 2010: 26,332 Zip code population in 2000: 24,407
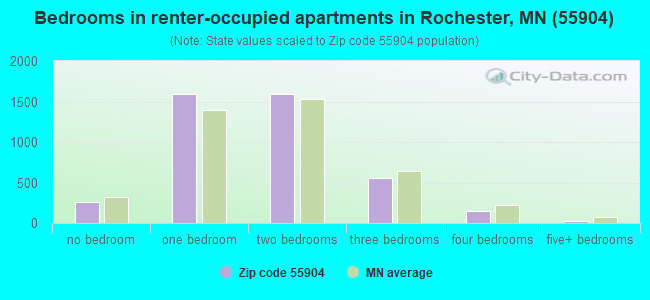
Houses and condos: 13,100 Renter-occupied apartments: 4,165
% of renters here:
34%
State:
28%
March 2022 cost of living index in zip code 55904: 104.4 (near average, U.S. average is 100)
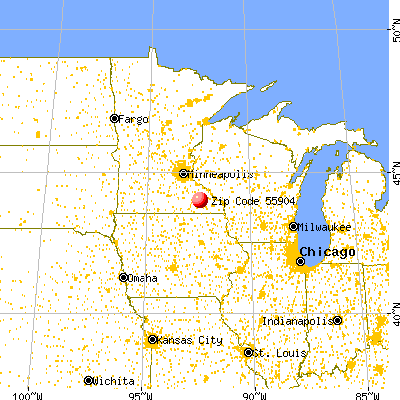
Land area: 62.2 sq. mi. Water area: 0.0 sq. mi.
Population density: 465 people per square mile
(low).
OSM Map
General Map
Google Map
MSN Map
OSM Map
General Map
Google Map
MSN Map
OSM Map
General Map
Google Map
MSN Map
OSM Map
General Map
Google Map
MSN Map
Please wait while loading the map...
Real estate property taxes paid for housing units in 2022:
This zip code:
1.0% ($2,359)
Minnesota:
1.0% ($3,087)
Median real estate property taxes paid for housing units with mortgages in 2022: $2,402 (0.9%) Median real estate property taxes paid for housing units with no mortgage in 2022: $2,262 (1.0%)
Averages for the 2020 tax year for zip code 55904, filed in 2021:
Average Adjusted Gross Income (AGI) in 2020: $58,551 (Individual Income Tax Returns)
Here:
$58,551
State:
$82,178
Salary/wage: $52,619 (reported on 85.5% of returns)
Here:
$52,619
State:
$67,438
(% of AGI for various income ranges: 1204.1% for AGIs below $25k, 3713.5% for AGIs $25k-50k, 6750.4% for AGIs $50k-75k, 9845.7% for AGIs $75k-100k, 17862.4% for AGIs $100k-200k, 59158.3% for AGIs over 200k)
Taxable interest for individuals: $763 (reported on 30.9% of returns)
This zip code:
$763
Minnesota:
$1,814
(% of AGI for various income ranges: 13.7% for AGIs below $25k, 16.2% for AGIs $25k-50k, 25.1% for AGIs $50k-75k, 49.2% for AGIs $75k-100k, 81.8% for AGIs $100k-200k, 515.8% for AGIs over 200k)
Ordinary dividends: $2,995 (reported on 16.6% of returns)
Here:
$2,995
State:
$6,928
(% of AGI for various income ranges: 16.5% for AGIs below $25k, 21.5% for AGIs $25k-50k, 37.6% for AGIs $50k-75k, 100.5% for AGIs $75k-100k, 212.1% for AGIs $100k-200k, 1621.7% for AGIs over 200k)
Net capital gain/loss in AGI: +$8,804 (reported on 14.5% of returns)
Here:
+$8,804
State:
+$20,591
(% of AGI for various income ranges: 7.9% for AGIs below $25k, 19.7% for AGIs $25k-50k, 53.7% for AGIs $50k-75k, 169.1% for AGIs $75k-100k, 458.9% for AGIs $100k-200k, 8234.2% for AGIs over 200k)
Profit/loss from business: +$10,904 (reported on 11.7% of returns)
Here:
+$10,904
State:
+$14,342
(% of AGI for various income ranges: 79.5% for AGIs below $25k, 100.6% for AGIs $25k-50k, 126.8% for AGIs $50k-75k, 328.5% for AGIs $75k-100k, 432.9% for AGIs $100k-200k, 1980.0% for AGIs over 200k)
Taxable individual retirement arrangement distribution: $15,911 (reported on 8.3% of returns)
55904:
$15,911
Minnesota:
$20,675
(% of AGI for various income ranges: 55.7% for AGIs below $25k, 100.8% for AGIs $25k-50k, 152.4% for AGIs $50k-75k, 262.5% for AGIs $75k-100k, 594.0% for AGIs $100k-200k, 1655.0% for AGIs over 200k)
Self-employed (Keogh) retirement plans: $14,900 (reported on 0.3% of returns)
55904:
$14,900
Minnesota:
$23,059
(% of AGI for various income ranges: 63.1% for AGIs $100k-200k)
Total itemized deductions: $26,164 (reported on 5.1% of returns)
Here:
$26,164
State:
$33,311
(% of AGI for various income ranges: 17.4% for AGIs below $25k, 57.6% for AGIs $25k-50k, 180.3% for AGIs $50k-75k, 375.4% for AGIs $75k-100k, 540.7% for AGIs $100k-200k, 3117.5% for AGIs over 200k)
Charity contributions: $7,264 (reported on 3.8% of returns)
Here:
$7,264
State:
$11,879
(% of AGI for various income ranges: 1.3% for AGIs below $25k, 8.1% for AGIs $25k-50k, 23.5% for AGIs $50k-75k, 62.6% for AGIs $75k-100k, 131.1% for AGIs $100k-200k, 969.2% for AGIs over 200k)
Taxes paid: $7,389 (reported on 5.1% of returns)
55904:
$7,389
State:
$8,252
(% of AGI for various income ranges: 3.6% for AGIs below $25k, 11.8% for AGIs $25k-50k, 48.9% for AGIs $50k-75k, 112.3% for AGIs $75k-100k, 174.7% for AGIs $100k-200k, 799.2% for AGIs over 200k)
Earned income credit: $2,077 (reported on 13.7% of returns)
Here:
$2,077
State:
$2,055
(% of AGI for various income ranges: 76.6% for AGIs below $25k, 57.5% for AGIs $25k-50k, 1.1% for AGIs $50k-75k)
Percentage of individuals using paid preparers for their 2020 taxes: 95.2%
Here:
95%
State:
94%
(% for various income ranges: 94.0% for AGIs below $25k, 95.6% for AGIs $25k-50k, 95.8% for AGIs $50k-75k, 95.7% for AGIs $75k-100k, 95.5% for AGIs $100k-200k, 97.1% for AGIs over 200k)
Averages for the 2012 tax year for zip code 55904, filed in 2013:
Average Adjusted Gross Income (AGI) in 2012: $46,519 (Individual Income Tax Returns)
Here:
$46,519
State:
$67,192
Salary/wage: $42,103 (reported on 88.8% of returns)
Here:
$42,103
State:
$55,182
(% of AGI for various income ranges: 80.3% for AGIs below $25k, 85.3% for AGIs $25k-50k, 81.8% for AGIs $50k-75k, 80.3% for AGIs $75k-100k, 83.2% for AGIs $100k-200k, 54.3% for AGIs over 200k)
Taxable interest for individuals: $797 (reported on 35.2% of returns)
This zip code:
$797
Minnesota:
$1,664
(% of AGI for various income ranges: 0.8% for AGIs below $25k, 0.5% for AGIs $25k-50k, 0.5% for AGIs $50k-75k, 0.5% for AGIs $75k-100k, 0.6% for AGIs $100k-200k, 0.9% for AGIs over 200k)
Ordinary dividends: $2,210 (reported on 15.9% of returns)
Here:
$2,210
State:
$5,665
(% of AGI for various income ranges: 0.8% for AGIs below $25k, 0.5% for AGIs $25k-50k, 0.5% for AGIs $50k-75k, 0.8% for AGIs $75k-100k, 0.9% for AGIs $100k-200k, 1.6% for AGIs over 200k)
Net capital gain/loss in AGI: +$5,539 (reported on 12.2% of returns)
Here:
+$5,539
State:
+$16,131
(% of AGI for various income ranges: 0.3% for AGIs $25k-50k, 0.4% for AGIs $50k-75k, 0.6% for AGIs $75k-100k, 1.8% for AGIs $100k-200k, 10.3% for AGIs over 200k)
Profit/loss from business: +$10,437 (reported on 11.4% of returns)
Here:
+$10,437
State:
+$12,430
(% of AGI for various income ranges: 6.0% for AGIs below $25k, 1.8% for AGIs $25k-50k, 2.3% for AGIs $50k-75k, 2.3% for AGIs $75k-100k, 1.8% for AGIs $100k-200k, 3.9% for AGIs over 200k)
Taxable individual retirement arrangement distribution: $10,010 (reported on 8.5% of returns)
55904:
$10,010
Minnesota:
$15,212
(% of AGI for various income ranges: 2.6% for AGIs below $25k, 1.5% for AGIs $25k-50k, 1.8% for AGIs $50k-75k, 2.2% for AGIs $75k-100k, 1.7% for AGIs $100k-200k, 1.3% for AGIs over 200k)
Self-employment retirement plans: $10,675 (reported on 0.3% of returns)
55904:
$10,675
Minnesota:
$17,874
Total itemized deductions: $17,171 (20% of AGI, reported on 29.3% of returns)
Here:
$17,171
State:
$24,665
Here:
19.9% of AGI
State:
19.6% of AGI
(% of AGI for various income ranges: 5.0% for AGIs below $25k, 7.8% for AGIs $25k-50k, 10.7% for AGIs $50k-75k, 12.0% for AGIs $75k-100k, 14.3% for AGIs $100k-200k, 13.3% for AGIs over 200k)
Charity contributions: $2,659 (reported on 23.8% of returns)
Here:
$2,659
State:
$3,948
(% of AGI for various income ranges: 0.4% for AGIs below $25k, 0.7% for AGIs $25k-50k, 1.1% for AGIs $50k-75k, 1.6% for AGIs $75k-100k, 2.1% for AGIs $100k-200k, 2.1% for AGIs over 200k)
Taxes paid: $6,802 (reported on 29.2% of returns)
55904:
$6,802
State:
$10,589
(% of AGI for various income ranges: 0.8% for AGIs below $25k, 2.2% for AGIs $25k-50k, 3.7% for AGIs $50k-75k, 4.5% for AGIs $75k-100k, 6.6% for AGIs $100k-200k, 7.8% for AGIs over 200k)
Earned income credit: $2,165 (reported on 18.9% of returns)
Here:
$2,165
State:
$2,037
(% of AGI for various income ranges: 6.5% for AGIs below $25k, 1.0% for AGIs $25k-50k)
Percentage of individuals using paid preparers for their 2012 taxes: 53.3%
Here:
53%
State:
55%
(% for various income ranges: 48.7% for AGIs below $25k, 51.5% for AGIs $25k-50k, 58.9% for AGIs $50k-75k, 60.5% for AGIs $75k-100k, 59.8% for AGIs $100k-200k, 76.9% for AGIs over 200k)
Averages for the 2004 tax year for zip code 55904, filed in 2005:
Average Adjusted Gross Income (AGI) in 2004: $38,387 (Individual Income Tax Returns)
Here:
$38,387
State:
$53,560
Salary/wage: $36,271 (reported on 90.5% of returns)
Here:
$36,271
State:
$46,177
(% of AGI for various income ranges: 114.4% for AGIs below $10k, 81.7% for AGIs $10k-25k, 86.6% for AGIs $25k-50k, 86.0% for AGIs $50k-75k, 88.2% for AGIs $75k-100k, 79.4% for AGIs over 100k)
Taxable interest for individuals: $910 (reported on 42.8% of returns)
This zip code:
$910
Minnesota:
$1,796
(% of AGI for various income ranges: 5.9% for AGIs below $10k, 1.5% for AGIs $10k-25k, 0.9% for AGIs $25k-50k, 0.9% for AGIs $50k-75k, 0.5% for AGIs $75k-100k, 1.0% for AGIs over 100k)
Taxable dividends: $999 (reported on 20.1% of returns)
Here:
$999
State:
$3,096
(% of AGI for various income ranges: 1.8% for AGIs below $10k, 0.7% for AGIs $10k-25k, 0.3% for AGIs $25k-50k, 0.4% for AGIs $50k-75k, 0.4% for AGIs $75k-100k, 0.9% for AGIs over 100k)
Net capital gain/loss: +$2,506 (reported on 15.0% of returns)
Here:
+$2,506
State:
+$10,864
(% of AGI for various income ranges: -0.7% for AGIs below $10k, 0.1% for AGIs $10k-25k, 0.2% for AGIs $25k-50k, 0.5% for AGIs $50k-75k, 0.8% for AGIs $75k-100k, 3.7% for AGIs over 100k)
Profit/loss from business: +$8,982 (reported on 12.5% of returns)
Here:
+$8,982
State:
+$10,442
(% of AGI for various income ranges: 3.8% for AGIs below $10k, 3.9% for AGIs $10k-25k, 2.3% for AGIs $25k-50k, 2.7% for AGIs $50k-75k, 1.9% for AGIs $75k-100k, 4.6% for AGIs over 100k)
IRA payment deduction: $2,542 (reported on 2.5% of returns)
55904:
$2,542
Minnesota:
$2,955
(% of AGI for various income ranges: 0.2% for AGIs $10k-25k, 0.3% for AGIs $25k-50k, 0.1% for AGIs $50k-75k, 0.1% for AGIs $75k-100k, 0.1% for AGIs over 100k)
Self-employed pension: $5,891 (reported on 0.6% of returns)
Here:
$5,891
Minnesota:
$12,099
(% of AGI for various income ranges: 0.1% for AGIs $25k-50k, 0.1% for AGIs $50k-75k, 0.1% for AGIs $75k-100k, 0.2% for AGIs over 100k)
Total itemized deductions: $14,038 (22% of AGI, reported on 35.6% of returns)
Here:
$14,038
State:
$20,035
Here:
21.9% of AGI
State:
21.3% of AGI
(% of AGI for various income ranges: 9.9% for AGIs below $10k, 7.6% for AGIs $10k-25k, 12.1% for AGIs $25k-50k, 14.4% for AGIs $50k-75k, 14.7% for AGIs $75k-100k, 14.4% for AGIs over 100k)
Charity contributions deductions: $1,992 (3% of AGI, reported on 30.6% of returns)
Here:
$1,992
State:
$3,333
Here:
2.9% of AGI
State:
3.4% of AGI
(% of AGI for various income ranges: 0.6% for AGIs below $10k, 0.7% for AGIs $10k-25k, 1.1% for AGIs $25k-50k, 1.7% for AGIs $50k-75k, 1.9% for AGIs $75k-100k, 2.4% for AGIs over 100k)
Total tax: $4,675 (reported on 75.9% of returns)
55904:
$4,675
State:
$8,485
(% of AGI for various income ranges: 2.4% for AGIs below $10k, 4.4% for AGIs $10k-25k, 7.1% for AGIs $25k-50k, 8.9% for AGIs $50k-75k, 10.1% for AGIs $75k-100k, 15.8% for AGIs over 100k)
Earned income credit: $1,621 (reported on 15.4% of returns)
Here:
$1,621
State:
$1,523
Percentage of individuals using paid preparers for their 2004 taxes: 60.7%
Here:
61%
State:
59%
(% for various income ranges: 55.8% for AGIs below $10k, 62.2% for AGIs $10k-25k, 61.5% for AGIs $25k-50k, 64.3% for AGIs $50k-75k, 60.0% for AGIs $75k-100k, 58.8% for AGIs over 100k)
Likely homosexual households (counted as self-reported same-sex unmarried-partner households)
Lesbian couples: 0.1% of all households
Gay men: 0.0% of all households
Household received Food Stamps/SNAP in the past 12 months: 1,133 Household did not receive Food Stamps/SNAP in the past 12 months: 11,167
Women who had a birth in the past 12 months: 434 (373 now married, 64 unmarried) Women who did not have a birth in the past 12 months: 6,549 (2,505 now married, 4,041 unmarried)
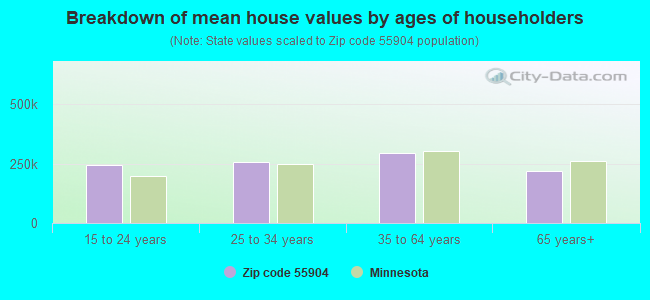
Housing units in zip code 55904 with a mortgage: 5,061 (460 second mortgage, 351 both second mortgage and home equity loan) Houses without a mortgage: 86
Median monthly owner costs for units with a mortgage: $1,473 Median monthly owner costs for units without a mortgage: $601
Residents with income below the poverty level in 2022:
This zip code:
9.9%
Whole state:
9.6%
Residents with income below 50% of the poverty level in 2022:
This zip code:
5.9%
Whole state:
5.2%
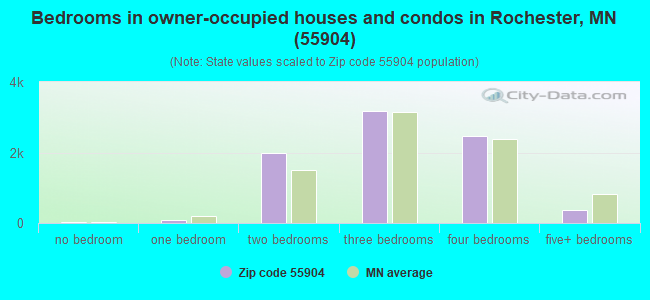
Median number of rooms in houses and condos:
Here:
6.6
State:
7.1
Median number of rooms in apartments:
Here:
3.5
State:
3.8
Notable locations in this zip code not listed on our city pages
Notable locations in zip code 55904: Maple Valley Country Club (A), Eastwood Golf Course (B), Northern Turkey Farm (C), Borst Family Farms (D), Sekapp Orchard (E), Camp Kahler (F), Chester (G), Rochester City Hall (H), Rochester Fire Department Station 1 (I), Rochester Public Library (J), Zumbro Valley Mental Health Center (K), Rochester Fire Department Station 5 (L). Display/hide their locations on the map
Churches in zip code 55904 include: Christ Church (A), Soul Harbor Christian Fellowship (B), The Church of Jesus Christ of Latter Day Saints (C), Church of the Savior (D), Cornerstone Evangelical Free Church (E), Victory Baptist Church (F), Outreach Church (G), Faith Family Church (H), Homestead United Methodist Church (I). Display/hide their locations on the map
Cemeteries: Fairview Cemetery (1), Grandview Memorial Gardens (2), Marion Cemetery (3), Chester Cemetery (4), Saint Bridget Cemetery (5). Display/hide their locations on the map
Parks in zip code 55904 include: Mayo Park (1), Slatterly Park (2), Joyce Park (3), Bear Creek Park (4), Homestead Park (5), Valleyside Estates Park (6), Eastwood Park (7), Faud Mansour Sports Complex (8), East Park (9). Display/hide their locations on the map
4,436 married couples with children.
1,540 single-parent households (396 men, 1,144 women).
83.4% of residents of 55904 zip code speak English at home.
4.4% of residents speak Spanish at home (72% very well, 18% well, 6% not well, 3% not at all).
1.8% of residents speak other Indo-European language at home (66% very well, 29% well, 5% not well).
3.6% of residents speak Asian or Pacific Island language at home (66% very well, 28% well, 5% not well, 2% not at all).
7.2% of residents speak other language at home (51% very well, 17% well, 29% not well, 2% not at all).
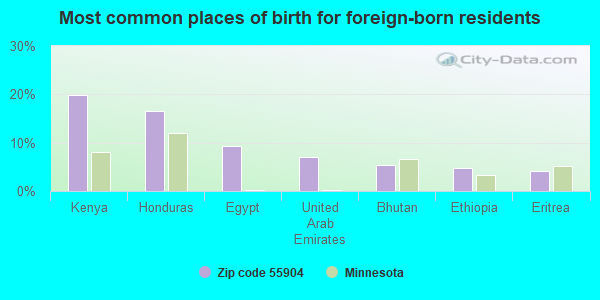
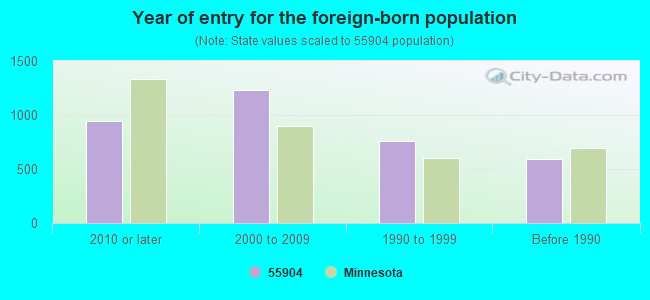
Foreign born population: 3,438 (11.9%) (58.6% of them are naturalized citizens)
AIR MAJOR (AIRS/AFS) ENFORCEMENT/COMPLIANCE ACTIVITY (Integrated Compliance Information System) - ICIS-05-2003-0650, FORMAL ENFORCEMENT ACTION (Integrated Compliance Information System) - ICIS-05-2003-0650, FORMAL ENFORCEMENT ACTION STATE MASTER (Minnesota Pollution Control Agency permits and compilance tracking) - AIRS-2710900010, AIR PROGRAM, RCRAINFO-MN0000448498, CESQG, AFS-2710900010, AIR MAJOR STATE MASTER (Minnesota Pollution Control Agency permits and compilance tracking) - PCS-MNG255051, National Pollutant Discharge Elimination System Permit, PCS-MNG960010, PCS-054491964, GENERAL PERMIT STORM WATER IND, NPDES STORMWATER PERMIT STATE MASTER (Minnesota Pollution Control Agency permits and compilance tracking) - RCRAINFO-MND054491964, CESQG, PCS-MN0059803, NPDES NON-MAJOR, RCRIS-MND054491964, CESQG CRITERIA AND HAZARDOUS AIR POLLUTANT INVENTORY (Inventory of air pollution sources) National Pollutant Discharge Elimination System NON-MAJOR (Tracking pollutant discharge elimination systems) - permit Conditionally Exempt Small Quantity Generators, less than 100 kg/month of hazardous waste (Resource Conservation and Recovery Act (tracking hazardous waste)) - notification Conditionally Exempt Small Quantity Generators, less than 100 kg/month of hazardous waste (Resource Conservation and Recovery Act (tracking hazardous waste)) - notification TRI REPORTER (Tracking of toxic chemicals releasing facilities) Business SIC classification: NATURAL, PROCESSED, AND IMITATION CHEESE; FLUID MILK Business NAICS classification: FLUID MILK MANUFACTURING.; CHEESE MANUFACTURING.; CHEESE MANUFACTURING.; CHEESE MANUFACTURING.; CHEESE MANUFACTURING.; CHEESE MANUFACTURING. Organizations: ASSOCAITED MILK PRODUCERS INC (CONTACT/OWNER)
, AMPI COOPERATIVE (CONTACT/OWNER)
, MARIGOLD FOODS INC (CONTACT/OWNER)
Alternative names: AMPI - ROCHESTER, ASSOCIATED MILK PRODUCERS INC -ROCHESTER, ASSOCIATED MILK PRODUCERS ROCHESTER, MARIGOLD FOODS
GREENWAY OF ROCHESTER (1024 N BROADWAY in ROCHESTER, MN)
(Integrated Compliance Information System) - ICIS-05-1998-0403, FORMAL ENFORCEMENT ACTION STATE MASTER (Minnesota Pollution Control Agency permits and compilance tracking) - RCRAINFO-MND985683242, CESQG, RCRIS-MND985683242, Conditionally Exempt Small Quantity Generators, less than 100 kg/month of hazardous waste (Resource Conservation and Recovery Act (tracking hazardous waste)) - notification Business SIC classification: TOBACCO AND TOBACCO PRODUCTS; GASOLINE SERVICE STATIONS Organizations: GREENWAY COOP (CONTACT/OWNER)
Alternative names: GREENWAY OF ROCHESTER N BROADWAY
OLMSTED COUNTY PUBLIC WORKS DEPARTMENT (2122 CAMPUS DRIVE SOUTH EAST SUITE 200 in ROCHESTER, MN)
STATE MASTER (Minnesota Pollution Control Agency permits and compilance tracking) - PCS-MN0059323, NPDES NON-MAJOR, PCS-MNG255076, National Pollutant Discharge Elimination System Permit COMPLIANCE ACTIVITY (Tracking inspections of insecticide, fungicide, and rodenticide, and toxic substances) National Pollutant Discharge Elimination System NON-MAJOR (Tracking pollutant discharge elimination systems) - permit Business SIC classification: REFUSE SYSTEMS Business NAICS classification: HAZARDOUS WASTE TREATMENT AND DISPOSAL.
HATHAWAY TREE SERVICE INC (2187 30TH AVE SE in ROCHESTER, MN)
STATE MASTER (Minnesota Pollution Control Agency permits and compilance tracking) - RCRIS-MND057096513, CESQG Conditionally Exempt Small Quantity Generators, less than 100 kg/month of hazardous waste (Resource Conservation and Recovery Act (tracking hazardous waste)) - notification Business SIC classification: REFUSE SYSTEMS Business NAICS classification: MATERIALS RECOVERY FACILITIES. Organizations: HATHAWAY SALES AND SVC INC (CONTACT/OWNER)
Alternative names: HATHAWAY SALES AND SVC INC
NASH FINCH ECONO FOODS 337 (1200 16TH ST SW in ROCHESTER, MN)
STATE MASTER (Minnesota Pollution Control Agency permits and compilance tracking) - RCRIS-MNS000108753, HAZARDOUS WASTE PROGRAM (Resource Conservation and Recovery Act (tracking hazardous waste)) Business SIC classification: GROCERY STORES Business NAICS classification: SUPERMARKETS AND OTHER GROCERY (EXCEPT CONVENIENCE) STORES. Organizations: NASH FINCH CO (CONTACT/OWNER)
ELMERS REPAIR (3820 SE 21ST in ROCHESTER, MN)
STATE MASTER (Minnesota Pollution Control Agency permits and compilance tracking) - RCRAINFO-MND985738970, CESQG, RCRIS-MND985738970, Conditionally Exempt Small Quantity Generators, less than 100 kg/month of hazardous waste (Resource Conservation and Recovery Act (tracking hazardous waste)) - notification TRANSPORTER (Resource Conservation and Recovery Act (tracking hazardous waste)) - notification Organizations: SCHULTZ RICHARD (CONTACT/OWNER)
OLMSTED COUNTY PUBLIC WORKS (1407 3RD AVE SE in ROCHESTER, MN)
STATE MASTER (Minnesota Pollution Control Agency permits and compilance tracking) - RCRAINFO-MND985677160, CESQG, RCRIS-MND985677160, Conditionally Exempt Small Quantity Generators, less than 100 kg/month of hazardous waste (Resource Conservation and Recovery Act (tracking hazardous waste)) - notification Business SIC classification: GENERAL GOVERNMENT Business NAICS classification: ALL OTHER AUTOMOTIVE REPAIR AND MAINTENANCE. Organizations: OLMSTED COUNTY HWY DEPT (CONTACT/OWNER)
Alternative names: OLMSTED COUNTY PUBLIC WORKS DEPT
ALIS MARKET (1352 3RD AVE SE in ROCHESTER, MN)
STATE MASTER (Minnesota Pollution Control Agency permits and compilance tracking) - RCRIS-MNR000119420, CESQG Conditionally Exempt Small Quantity Generators, less than 100 kg/month of hazardous waste (Resource Conservation and Recovery Act (tracking hazardous waste)) Organizations: ALI ABUSERRIEH (CONTACT/OPERATOR)
, AL S MARKET (CONTACT/OWNER)
Alternative names: AL S MARKET
ALS SPECIALTY SERVICE INC (4090 HWY 63 N in ROCHESTER, MN)
STATE MASTER (Minnesota Pollution Control Agency permits and compilance tracking) - RCRAINFO-MND985679513, CESQG, RCRIS-MND985679513, Small Quantity Generators, between 100 kg and 1000 kg of hazardous waste/month (Resource Conservation and Recovery Act (tracking hazardous waste)) - notification Business SIC and NAICS classification: BOAT DEALERS Organizations: BRUGGENTHIES AL (CONTACT/OWNER)
, AL S SPECIALTY SERVICE INC (CONTACT/OWNER)
BAKER OIL CO INC (1836 3RD AVE S E in ROCHESTER, MN)
STATE MASTER (Minnesota Pollution Control Agency permits and compilance tracking) - RCRAINFO-MNR000022020, HAZARDOUS WASTE PROGRAM, RCRIS-MNR000022020, TRANSPORTER (Resource Conservation and Recovery Act (tracking hazardous waste)) USED OIL PROGRAM (Resource Conservation and Recovery Act (tracking hazardous waste)) Business SIC classification: PETROLEUM AND PETROLEUM PRODUCTS WHOLESALERS, EXCEPT BULK STATIONS AND TERMINALS Organizations: BAKER JACK (CONTACT/OWNER)
FEDERAL MEDICAL CENTER (2110 E CENTER ST in ROCHESTER, MN) . Federal Facility. DEPARTMENT OF AGRICULTURE
STATE MASTER (Minnesota Pollution Control Agency permits and compilance tracking) - RCRAINFO-MN4151990070, CESQG, RCRIS-MN4151990070, Conditionally Exempt Small Quantity Generators, less than 100 kg/month of hazardous waste (Resource Conservation and Recovery Act (tracking hazardous waste)) - notification Business SIC and NAICS classification: GENERAL MEDICAL AND SURGICAL HOSPITALS Organizations: FEDERAL BUREAU OF PRISONS (CONTACT/OWNER)
, US DOJ FEDERAL MEDICAL CENTER (CONTACT/OWNER)
Alternative names: US JUSTICE DEPT FEDERAL MEDICAL CENTER
FLURY AUTO BODY (999 1ST AVE SE in ROCHESTER, MN)
STATE MASTER (Minnesota Pollution Control Agency permits and compilance tracking) - RCRAINFO-MND982218802, CESQG, RCRIS-MND982218802, Conditionally Exempt Small Quantity Generators, less than 100 kg/month of hazardous waste (Resource Conservation and Recovery Act (tracking hazardous waste)) - notification Business SIC classification: TOP, BODY, AND UPHOLSTERY REPAIR SHOPS AND PAINT SHOPS Business NAICS classification: AUTOMOTIVE BODY, PAINT, AND INTERIOR REPAIR AND MAINTENANCE. Organizations: FLURY ROSS (CONTACT/OWNER)
GOLDEN HILL AMOCO (2276 S BROADWAY in ROCHESTER, MN)
STATE MASTER (Minnesota Pollution Control Agency permits and compilance tracking) - RCRAINFO-MND144658317, CESQG, RCRIS-MND144658317, Small Quantity Generators, between 100 kg and 1000 kg of hazardous waste/month (Resource Conservation and Recovery Act (tracking hazardous waste)) - notification Organizations: AMOCO OIL COMPANY (CONTACT/OWNER)
Housing units lacking complete plumbing facilities: 0.6% Housing units lacking complete kitchen facilities: 0.7%
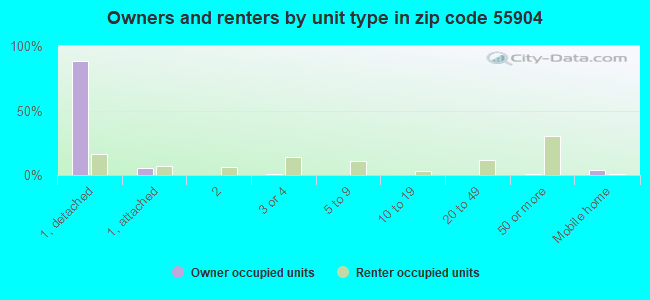
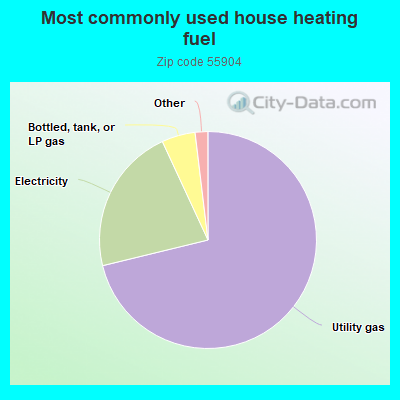
71.2%Utility gas
21.9%Electricity
5.0%Bottled, tank, or LP gas
0.7%Other fuel
0.6%No fuel used
0.5%Wood
Population in 1990: 7,854. Population change in the 1990s: +16,553 (+210.8%).
Place of birth for U.S.-born residents:
This state: 17,536
Northeast: 691
Midwest: 5,167
South: 911
West: 1,004
59% of the 55904 zip code residents lived in the same house 5 years ago. Out of people who lived in different houses, 50% lived in this county. Out of people who lived in different counties, 50% lived in Minnesota.
86% of the 55904 zip code residents lived in the same house 1 year ago. Out of people who lived in different houses, 41% moved from this county. Out of people who lived in different houses, 28% moved from different county within same state. Out of people who lived in different houses, 29% moved from different state. Out of people who lived in different houses, 3% moved from abroad.
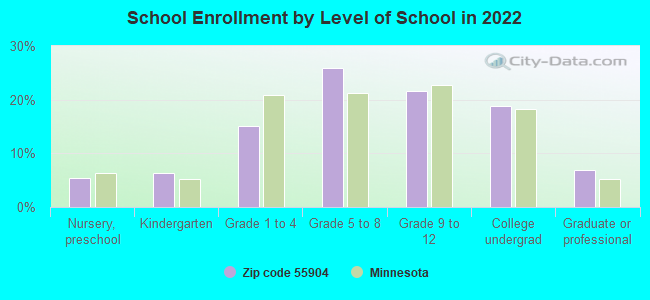
Private vs. public school enrollment:
Students in private schools in grades 1 to 8 (elementary and middle school): 353
Here:
12.3%
Minnesota:
12.9%
Students in private schools in grades 9 to 12 (high school): 55
Here:
3.6%
Minnesota:
8.6%
Students in private undergraduate colleges: 384
Here:
28.8%
Minnesota:
26.2%
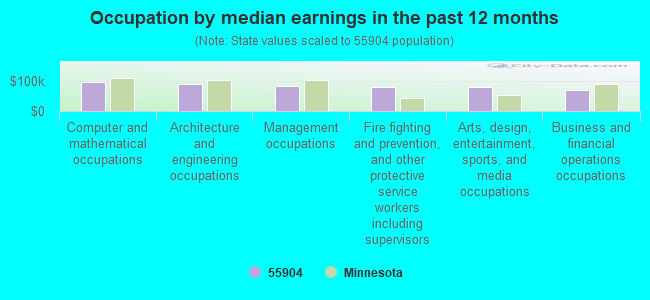
Occupation by median earnings in the past 12 months ($)
98,860Computer and mathematical occupations
91,188Architecture and engineering occupations
84,867Management occupations
81,859Fire fighting and prevention, and other protective service workers including supervisors
80,008Arts, design, entertainment, sports, and media occupations
71,078Business and financial operations occupations
Companies with federal contracts located in this zip code:
MACK TRUCKS OF ROCHESTER, INC (6500 US HWY 63 SOUTH in ROCHESTER, MN; small business) : $223,907 in 6 contractsfrom 2001 to 2005
Contracts for Trucks and Truck Tractors, Wheeled, Lease or Rental of Equipment -- Ground Effect Vehicles, Motor Vehicles, Trailers, and Cycles by Army Signed by year:2000: $0; 2001: $96,321; 2002: $0; 2003: $41,480; 2004: $3,875; 2005: $82,231; 2006: $0.
Biggest contracts:
$96,321 with Army for Trucks and Truck Tractors, Wheeled. Signed on 2001-08-07. Completion date: 2001-11-09.
$41,480 with Army for Lease or Rental of Equipment -- Ground Effect Vehicles, Motor Vehicles, Trailers, and Cycles. Signed on 2003-09-29. Completion date: 2003-10-14.
$38,542, same as above.Signed on 2005-10-26. Completion date: 2003-10-14.
$38,096, same as above.Signed on 2005-02-01. Completion date: 2003-10-14.
GDM SALES & SERVICE LLC (3500 S HWY 63 STE B in ROCHESTER, MN; small business)
$20,639 with Army for Trailers. Signed on 2005-03-16. Completion date: 2005-05-16.
Top industries in this zip code by the number of employees in 2005:
2002 - 2018 National Fire Incident Reporting System (NFIRS) incidents
According to the data from the years 2002 - 2018 the average number of fires per year is 67. The highest number of reported fires - 94 took place in 2007, and the least - 34 in 2011. The data has a dropping trend.
When looking into fire subcategories, the most incidents belonged to: Structure Fires (48.6%), and Outside Fires (29.8%).
Fire incident types reported to NFIRS in Zip Code 55904


 Nearest zip codes: 55902, 55976, 55906, 55934, 55901, 55905.


 According to the data from the years 2002 - 2018 the average number of fires per year is 67. The highest number of reported fires - 94 took place in 2007, and the least - 34 in 2011. The data has a dropping trend.
 When looking into fire subcategories, the most incidents belonged to: Structure Fires (48.6%), and Outside Fires (29.8%).