Estimated zip code population in 2022: 31,467 Zip code population in 2010: 29,439 Zip code population in 2000: 27,604
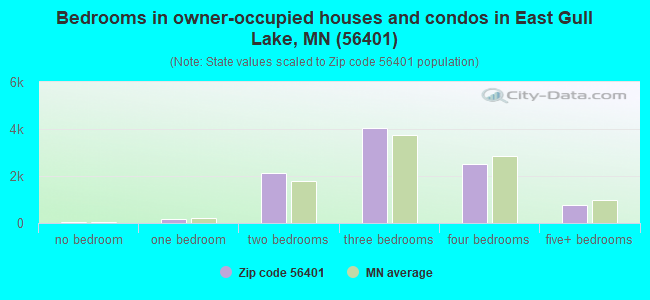
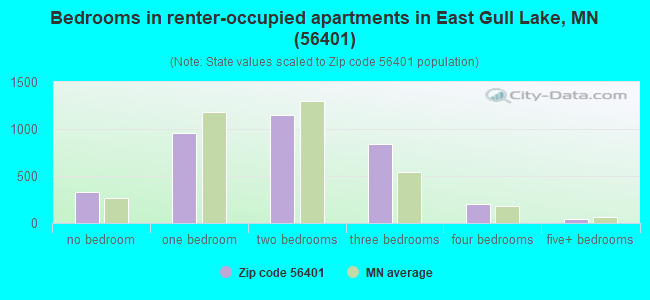
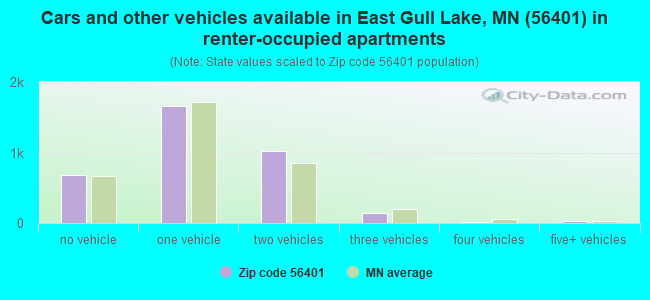
Houses and condos: 16,112 Renter-occupied apartments: 3,540
% of renters here:
27%
State:
28%
March 2022 cost of living index in zip code 56401: 87.3 (less than average, U.S. average is 100)
Land area: 325.1 sq. mi. Water area: 37.8 sq. mi.
Population density: 97 people per square mile
(very low).
OSM Map
General Map
Google Map
MSN Map
OSM Map
General Map
Google Map
MSN Map
OSM Map
General Map
Google Map
MSN Map
OSM Map
General Map
Google Map
MSN Map
Please wait while loading the map...
Real estate property taxes paid for housing units in 2022:
This zip code:
0.8% ($1,862)
Minnesota:
1.0% ($3,087)
Median real estate property taxes paid for housing units with mortgages in 2022: $1,892 (0.8%) Median real estate property taxes paid for housing units with no mortgage in 2022: $1,782 (0.8%)
Averages for the 2020 tax year for zip code 56401, filed in 2021:
Average Adjusted Gross Income (AGI) in 2020: $61,638 (Individual Income Tax Returns)
Here:
$61,638
State:
$82,178
Salary/wage: $48,664 (reported on 82.7% of returns)
Here:
$48,664
State:
$67,438
(% of AGI for various income ranges: 1231.8% for AGIs below $25k, 3537.7% for AGIs $25k-50k, 6369.0% for AGIs $50k-75k, 9400.0% for AGIs $75k-100k, 17809.0% for AGIs $100k-200k, 67458.0% for AGIs over 200k)
Taxable interest for individuals: $1,673 (reported on 28.0% of returns)
This zip code:
$1,673
Minnesota:
$1,814
(% of AGI for various income ranges: 18.5% for AGIs below $25k, 25.0% for AGIs $25k-50k, 57.8% for AGIs $50k-75k, 82.3% for AGIs $75k-100k, 177.2% for AGIs $100k-200k, 1539.3% for AGIs over 200k)
Ordinary dividends: $4,529 (reported on 16.0% of returns)
Here:
$4,529
State:
$6,928
(% of AGI for various income ranges: 17.7% for AGIs below $25k, 27.7% for AGIs $25k-50k, 80.4% for AGIs $50k-75k, 85.1% for AGIs $75k-100k, 322.6% for AGIs $100k-200k, 2929.3% for AGIs over 200k)
Net capital gain/loss in AGI: +$14,632 (reported on 15.8% of returns)
Here:
+$14,632
State:
+$20,591
(% of AGI for various income ranges: 11.3% for AGIs below $25k, 32.8% for AGIs $25k-50k, 113.2% for AGIs $50k-75k, 259.5% for AGIs $75k-100k, 705.1% for AGIs $100k-200k, 15137.3% for AGIs over 200k)
Profit/loss from business: +$12,944 (reported on 13.9% of returns)
Here:
+$12,944
State:
+$14,342
(% of AGI for various income ranges: 72.8% for AGIs below $25k, 127.9% for AGIs $25k-50k, 306.2% for AGIs $50k-75k, 384.0% for AGIs $75k-100k, 626.6% for AGIs $100k-200k, 4363.3% for AGIs over 200k)
Taxable individual retirement arrangement distribution: $18,091 (reported on 10.8% of returns)
56401:
$18,091
Minnesota:
$20,675
(% of AGI for various income ranges: 66.3% for AGIs below $25k, 100.3% for AGIs $25k-50k, 277.4% for AGIs $50k-75k, 491.3% for AGIs $75k-100k, 1076.5% for AGIs $100k-200k, 3511.3% for AGIs over 200k)
Self-employed (Keogh) retirement plans: $17,240 (reported on 0.3% of returns)
56401:
$17,240
Minnesota:
$23,059
(% of AGI for various income ranges: 92.7% for AGIs $100k-200k)
Total itemized deductions: $34,547 (reported on 5.7% of returns)
Here:
$34,547
State:
$33,311
(% of AGI for various income ranges: 40.5% for AGIs below $25k, 83.0% for AGIs $25k-50k, 273.5% for AGIs $50k-75k, 390.9% for AGIs $75k-100k, 737.0% for AGIs $100k-200k, 7478.0% for AGIs over 200k)
Charity contributions: $12,722 (reported on 4.3% of returns)
Here:
$12,722
State:
$11,879
(% of AGI for various income ranges: 2.6% for AGIs below $25k, 6.0% for AGIs $25k-50k, 35.8% for AGIs $50k-75k, 61.0% for AGIs $75k-100k, 171.5% for AGIs $100k-200k, 3461.3% for AGIs over 200k)
Taxes paid: $7,529 (reported on 5.7% of returns)
56401:
$7,529
State:
$8,252
(% of AGI for various income ranges: 3.6% for AGIs below $25k, 12.1% for AGIs $25k-50k, 60.9% for AGIs $50k-75k, 101.3% for AGIs $75k-100k, 216.7% for AGIs $100k-200k, 1379.3% for AGIs over 200k)
Earned income credit: $2,056 (reported on 15.9% of returns)
Here:
$2,056
State:
$2,055
(% of AGI for various income ranges: 76.3% for AGIs below $25k, 67.7% for AGIs $25k-50k, 1.5% for AGIs $50k-75k)
Percentage of individuals using paid preparers for their 2020 taxes: 94.6%
Here:
95%
State:
94%
(% for various income ranges: 92.8% for AGIs below $25k, 95.1% for AGIs $25k-50k, 95.0% for AGIs $50k-75k, 95.5% for AGIs $75k-100k, 96.1% for AGIs $100k-200k, 98.0% for AGIs over 200k)
Averages for the 2012 tax year for zip code 56401, filed in 2013:
Average Adjusted Gross Income (AGI) in 2012: $47,334 (Individual Income Tax Returns)
Here:
$47,334
State:
$67,192
Salary/wage: $38,120 (reported on 84.9% of returns)
Here:
$38,120
State:
$55,182
(% of AGI for various income ranges: 79.1% for AGIs below $25k, 76.7% for AGIs $25k-50k, 74.4% for AGIs $50k-75k, 72.3% for AGIs $75k-100k, 68.7% for AGIs $100k-200k, 44.3% for AGIs over 200k)
Taxable interest for individuals: $1,516 (reported on 29.9% of returns)
This zip code:
$1,516
Minnesota:
$1,664
(% of AGI for various income ranges: 1.1% for AGIs below $25k, 0.7% for AGIs $25k-50k, 0.7% for AGIs $50k-75k, 0.8% for AGIs $75k-100k, 0.9% for AGIs $100k-200k, 1.5% for AGIs over 200k)
Ordinary dividends: $3,516 (reported on 15.9% of returns)
Here:
$3,516
State:
$5,665
(% of AGI for various income ranges: 1.1% for AGIs below $25k, 0.7% for AGIs $25k-50k, 0.6% for AGIs $50k-75k, 1.0% for AGIs $75k-100k, 1.4% for AGIs $100k-200k, 2.2% for AGIs over 200k)
Net capital gain/loss in AGI: +$8,490 (reported on 13.7% of returns)
Here:
+$8,490
State:
+$16,131
(% of AGI for various income ranges: 0.3% for AGIs $25k-50k, 0.7% for AGIs $50k-75k, 0.9% for AGIs $75k-100k, 2.6% for AGIs $100k-200k, 8.8% for AGIs over 200k)
Profit/loss from business: +$8,483 (reported on 14.6% of returns)
Here:
+$8,483
State:
+$12,430
(% of AGI for various income ranges: 4.8% for AGIs below $25k, 2.9% for AGIs $25k-50k, 2.1% for AGIs $50k-75k, 1.7% for AGIs $75k-100k, 2.7% for AGIs $100k-200k, 2.1% for AGIs over 200k)
Taxable individual retirement arrangement distribution: $13,993 (reported on 11.1% of returns)
56401:
$13,993
Minnesota:
$15,212
(% of AGI for various income ranges: 3.0% for AGIs below $25k, 3.1% for AGIs $25k-50k, 2.7% for AGIs $50k-75k, 3.6% for AGIs $75k-100k, 4.5% for AGIs $100k-200k, 2.7% for AGIs over 200k)
Self-employment retirement plans: $17,067 (reported on 0.4% of returns)
56401:
$17,067
Minnesota:
$17,874
Total itemized deductions: $21,754 (22% of AGI, reported on 27.7% of returns)
Here:
$21,754
State:
$24,665
Here:
22.1% of AGI
State:
19.6% of AGI
(% of AGI for various income ranges: 7.4% for AGIs below $25k, 10.2% for AGIs $25k-50k, 12.8% for AGIs $50k-75k, 13.7% for AGIs $75k-100k, 16.0% for AGIs $100k-200k, 14.5% for AGIs over 200k)
Charity contributions: $3,614 (reported on 21.3% of returns)
Here:
$3,614
State:
$3,948
(% of AGI for various income ranges: 0.6% for AGIs below $25k, 0.9% for AGIs $25k-50k, 1.4% for AGIs $50k-75k, 1.8% for AGIs $75k-100k, 2.2% for AGIs $100k-200k, 2.5% for AGIs over 200k)
Taxes paid: $7,928 (reported on 27.6% of returns)
56401:
$7,928
State:
$10,589
(% of AGI for various income ranges: 1.2% for AGIs below $25k, 2.3% for AGIs $25k-50k, 3.4% for AGIs $50k-75k, 4.7% for AGIs $75k-100k, 6.6% for AGIs $100k-200k, 8.3% for AGIs over 200k)
Earned income credit: $2,042 (reported on 21.5% of returns)
Here:
$2,042
State:
$2,037
(% of AGI for various income ranges: 6.0% for AGIs below $25k, 1.2% for AGIs $25k-50k)
Percentage of individuals using paid preparers for their 2012 taxes: 50.7%
Here:
51%
State:
55%
(% for various income ranges: 40.3% for AGIs below $25k, 51.5% for AGIs $25k-50k, 61.0% for AGIs $50k-75k, 67.0% for AGIs $75k-100k, 68.1% for AGIs $100k-200k, 83.3% for AGIs over 200k)
Averages for the 2004 tax year for zip code 56401, filed in 2005:
Average Adjusted Gross Income (AGI) in 2004: $39,807 (Individual Income Tax Returns)
Here:
$39,807
State:
$53,560
Salary/wage: $32,519 (reported on 85.2% of returns)
Here:
$32,519
State:
$46,177
(% of AGI for various income ranges: 115.6% for AGIs below $10k, 76.6% for AGIs $10k-25k, 78.8% for AGIs $25k-50k, 77.6% for AGIs $50k-75k, 74.6% for AGIs $75k-100k, 47.5% for AGIs over 100k)
Taxable interest for individuals: $2,179 (reported on 41.7% of returns)
This zip code:
$2,179
Minnesota:
$1,796
(% of AGI for various income ranges: 4.8% for AGIs below $10k, 1.9% for AGIs $10k-25k, 1.2% for AGIs $25k-50k, 1.4% for AGIs $50k-75k, 1.6% for AGIs $75k-100k, 4.1% for AGIs over 100k)
Taxable dividends: $2,160 (reported on 19.6% of returns)
Here:
$2,160
State:
$3,096
(% of AGI for various income ranges: 2.6% for AGIs below $10k, 1.0% for AGIs $10k-25k, 0.7% for AGIs $25k-50k, 0.8% for AGIs $50k-75k, 0.7% for AGIs $75k-100k, 1.7% for AGIs over 100k)
Net capital gain/loss: +$15,277 (reported on 17.1% of returns)
Here:
+$15,277
State:
+$10,864
(% of AGI for various income ranges: 0.8% for AGIs below $10k, 0.8% for AGIs $10k-25k, 1.1% for AGIs $25k-50k, 1.7% for AGIs $50k-75k, 3.7% for AGIs $75k-100k, 18.8% for AGIs over 100k)
Profit/loss from business: +$8,136 (reported on 16.7% of returns)
Here:
+$8,136
State:
+$10,442
(% of AGI for various income ranges: 4.0% for AGIs below $10k, 5.3% for AGIs $10k-25k, 3.3% for AGIs $25k-50k, 2.5% for AGIs $50k-75k, 3.2% for AGIs $75k-100k, 3.5% for AGIs over 100k)
IRA payment deduction: $3,000 (reported on 2.8% of returns)
56401:
$3,000
Minnesota:
$2,955
(% of AGI for various income ranges: 0.2% for AGIs $10k-25k, 0.4% for AGIs $25k-50k, 0.2% for AGIs $50k-75k, 0.2% for AGIs $75k-100k, 0.1% for AGIs over 100k)
Self-employed pension: $10,315 (reported on 0.7% of returns)
Here:
$10,315
Minnesota:
$12,099
(% of AGI for various income ranges: 0.0% for AGIs $25k-50k, 0.1% for AGIs $50k-75k, 0.2% for AGIs $75k-100k, 0.4% for AGIs over 100k)
Total itemized deductions: $18,197 (23% of AGI, reported on 29.0% of returns)
Here:
$18,197
State:
$20,035
Here:
23.0% of AGI
State:
21.3% of AGI
(% of AGI for various income ranges: 8.3% for AGIs below $10k, 7.9% for AGIs $10k-25k, 11.3% for AGIs $25k-50k, 13.9% for AGIs $50k-75k, 16.5% for AGIs $75k-100k, 15.5% for AGIs over 100k)
Charity contributions deductions: $3,156 (4% of AGI, reported on 24.9% of returns)
Here:
$3,156
State:
$3,333
Here:
3.7% of AGI
State:
3.4% of AGI
(% of AGI for various income ranges: 0.5% for AGIs below $10k, 0.7% for AGIs $10k-25k, 1.3% for AGIs $25k-50k, 1.9% for AGIs $50k-75k, 2.4% for AGIs $75k-100k, 3.1% for AGIs over 100k)
Total tax: $5,531 (reported on 74.0% of returns)
56401:
$5,531
State:
$8,485
(% of AGI for various income ranges: 3.0% for AGIs below $10k, 4.4% for AGIs $10k-25k, 6.4% for AGIs $25k-50k, 8.2% for AGIs $50k-75k, 9.9% for AGIs $75k-100k, 18.2% for AGIs over 100k)
Earned income credit: $1,590 (reported on 16.4% of returns)
Here:
$1,590
State:
$1,523
Percentage of individuals using paid preparers for their 2004 taxes: 58.7%
Here:
59%
State:
59%
(% for various income ranges: 46.2% for AGIs below $10k, 54.1% for AGIs $10k-25k, 63.1% for AGIs $25k-50k, 66.4% for AGIs $50k-75k, 71.2% for AGIs $75k-100k, 79.8% for AGIs over 100k)
Likely homosexual households (counted as self-reported same-sex unmarried-partner households)
Lesbian couples: 0.0% of all households
Gay men: 0.0% of all households
Household received Food Stamps/SNAP in the past 12 months: 1,497 Household did not receive Food Stamps/SNAP in the past 12 months: 11,692
Women who had a birth in the past 12 months: 267 (216 now married, 51 unmarried) Women who did not have a birth in the past 12 months: 6,335 (2,946 now married, 3,389 unmarried)
Housing units in zip code 56401 with a mortgage: 6,177 (544 second mortgage, 10 home equity loan, 436 both second mortgage and home equity loan) Houses without a mortgage: 127
Median monthly owner costs for units with a mortgage: $1,408 Median monthly owner costs for units without a mortgage: $525
Residents with income below the poverty level in 2022:
This zip code:
12.6%
Whole state:
9.6%
Residents with income below 50% of the poverty level in 2022:
This zip code:
7.7%
Whole state:
5.2%
Median number of rooms in houses and condos:
Here:
6.4
State:
7.1
Median number of rooms in apartments:
Here:
4.0
State:
3.8
Notable locations in this zip code not listed on our city pages
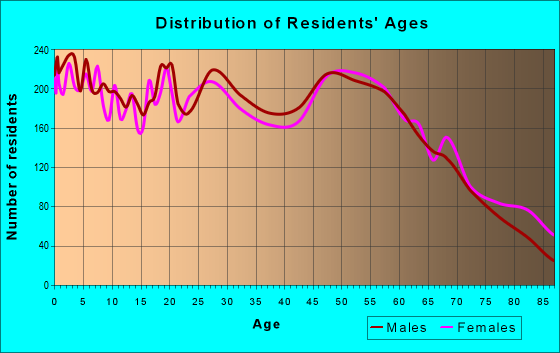
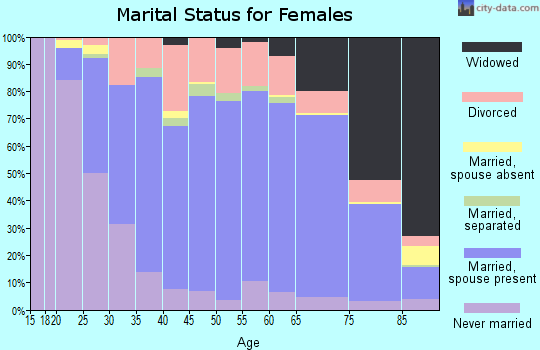
4,380 married couples with children.
2,290 single-parent households (723 men, 1,567 women).
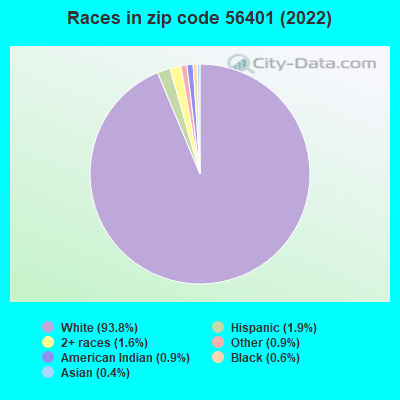
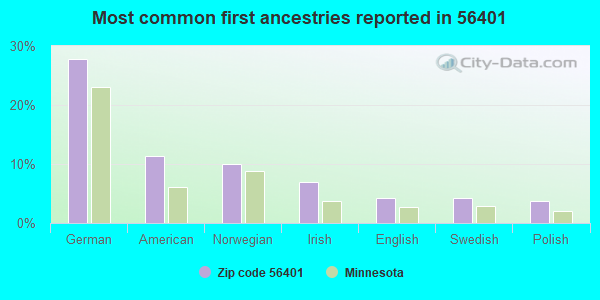
98.0% of residents of 56401 zip code speak English at home.
0.6% of residents speak Spanish at home (54% very well, 21% well, 25% not well).
0.5% of residents speak other Indo-European language at home (57% very well, 20% well, 16% not well, 7% not at all).
0.6% of residents speak Asian or Pacific Island language at home (73% very well, 27% well).
0.3% of residents speak other language at home (37% very well, 59% well, 3% not well).
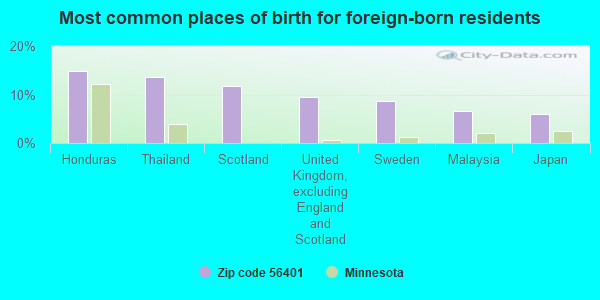
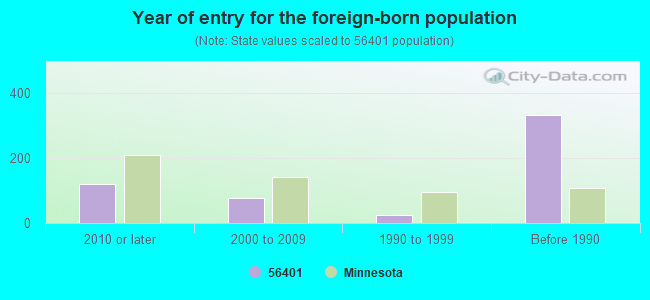
Foreign born population: 407 (1.3%) (68.1% of them are naturalized citizens)
Major facilities with environmental interests located in this zip code:
ANDERSON BROTHERS CONSTRUCTION (1500 HIGHWAY 210 E in BRAINERD, MN)
AIR MINOR (AIRS/AFS) AIR SYNTHETIC MINOR (AIRS/AFS) STATE MASTER (Minnesota Pollution Control Agency permits and compilance tracking) - AIRS-2799000002, AIR PROGRAM, AFS-2799000002, AIR SYNTHETIC MINOR STATE MASTER (Minnesota Pollution Control Agency permits and compilance tracking) - RCRAINFO-MND022727606, CESQG, RCRIS-MND022727606, Business SIC classification: HIGHWAY AND STREET CONSTRUCTION, EXCEPT ELEVATED HIGHWAYS; ASPHALT PAVING MIXTURES AND BLOCKS Business NAICS classification: HIGHWAY, STREET, AND BRIDGE CONSTRUCTION.; ASPHALT PAVING MIXTURE AND BLOCK MANUFACTURING. Organizations: ANDERSON BROTHERS CONSTRUCTION CO (CONTACT/OWNER)
Alternative names: ANDERSON BROTHERS CONSTRUCTION CO - BASE
NORTH STAR PLATING (2110 SOUTH 10TH STREET in BRAINERD, MN)
AIR MINOR (AIRS/AFS) STATE MASTER (Minnesota Pollution Control Agency permits and compilance tracking) - AIRS-2703500042, AIR PROGRAM, RCRAINFO-MNT280010133, LQG, PCS-MNG120011, National Pollutant Discharge Elimination System Permit, PCS-SIU000028, NPDES PRETREATMENT PROGRAM, PCS-193142668, GENERAL PERMIT STORM WATER IND, RCRAINFO-MNT280010133, TRANSPORTER, AFS-2703500042, AIR SYNTHETIC MINOR, PCS-193142668, NPDES STORMWATER PERMIT, RCRIS-MNT280010133, LQG, TRANSPORTER CRITERIA AND HAZARDOUS AIR POLLUTANT INVENTORY (Inventory of air pollution sources) HAZARDOUS WASTE BIENNIAL REPORTER (Resource Conservation and Recovery Act (tracking hazardous waste)) Large Quantity Generators, more that 1000 kg of hazardous waste/month (Resource Conservation and Recovery Act (tracking hazardous waste)) TRI REPORTER (Tracking of toxic chemicals releasing facilities) Business SIC classification: PAINTS, VARNISHES, LACQUERS, ENAMELS, AND ALLIED PRODUCTS; ELECTROPLATING, PLATING, POLISHING, ANODIZING, AND COLORING Business NAICS classification: ELECTROPLATING, PLATING, POLISHING, ANODIZING, AND COLORING.; ELECTROPLATING, PLATING, POLISHING, ANODIZING, AND COLORING. Organizations: KEYSTONE AUTOMOTIVE INDUSTRIES MN INC (CONTACT/OPERATOR)
, BX PROPERTIES (CONTACT/OWNER)
Alternative names: KEYSTONE AUTOMOTIVE IND, KEYSTONE AUTOMOTIVE IND MN INC, KEYSTONE AUTOMOTIVE IND MN INC
HOME DEPOT #2818 (101 ELDER DRIVE SOUTH in BAXTER, MN)
STATE MASTER (Minnesota Pollution Control Agency permits and compilance tracking) - RCRAINFO-MNR000079913, CESQG, RCRIS-MNR000079913, SQG Conditionally Exempt Small Quantity Generators, less than 100 kg/month of hazardous waste (Resource Conservation and Recovery Act (tracking hazardous waste)) - notification (Resource Conservation and Recovery Act (tracking hazardous waste)) Business SIC classification: LUMBER AND OTHER BUILDING MATERIALS DEALERS Business NAICS classification: HOME CENTERS. Organizations: HOME DEPOT USA (CONTACT/OPERATOR)
, HOME DEPOT USA INC (CONTACT/OWNER)
Alternative names: HOME DEPOT - BAXTER, HOME DEPOT TOOL RENTAL
ANDERSON BROTHERS CONSTRUCTION CO (14099 HIGHWAY 210 in BRAINERD, MN)
AIR MINOR (AIRS/AFS) STATE MASTER (Minnesota Pollution Control Agency permits and compilance tracking) - PCS-MNG490001, National Pollutant Discharge Elimination System Permit CRITERIA AND HAZARDOUS AIR POLLUTANT INVENTORY (Inventory of air pollution sources) National Pollutant Discharge Elimination System NON-MAJOR (Tracking pollutant discharge elimination systems) - permit Business SIC classification: ASPHALT PAVING MIXTURES AND BLOCKS Business NAICS classification: ASPHALT PAVING MIXTURE AND BLOCK MANUFACTURING. Alternative names: ANDERSON BROS BASE 7, ANDERSON BROTHERS CONSTRUCTION CO - BASE
BRAINERD NATL GUARD ARMORY (1115 WRIGHT ST in BRAINERD, MN) . Federal Facility. U.S. ARMY
STATE MASTER (Minnesota Pollution Control Agency permits and compilance tracking) - RCRAINFO-MND985706134, CESQG, RCRIS-MND985706134, (Resource Conservation and Recovery Act (tracking hazardous waste)) Conditionally Exempt Small Quantity Generators, less than 100 kg/month of hazardous waste (Resource Conservation and Recovery Act (tracking hazardous waste)) - notification TRANSPORTER (Resource Conservation and Recovery Act (tracking hazardous waste)) - notification Business SIC and NAICS classification: NATIONAL SECURITY Organizations: US GOVT (CONTACT/OWNER)
, MINNESOTA STATE OF (CONTACT/OWNER)
, MINNESOTA DEPT OF MILITARY AFFAIRS (CONTACT/OWNER)
Alternative names: BRAINERD TACC
A-TEK INCORPORATED (HIGHWAY 210 EAST in BRAINERD, MN)
ENFORCEMENT/COMPLIANCE ACTIVITY (Integrated Compliance Information System) STATE MASTER (Minnesota Pollution Control Agency permits and compilance tracking) - AIRS-2703500046, AIR PROGRAM, AFS-2703500046, AIR SYNTHETIC MINOR CRITERIA AND HAZARDOUS AIR POLLUTANT INVENTORY (Inventory of air pollution sources) Conditionally Exempt Small Quantity Generators, less than 100 kg/month of hazardous waste (Resource Conservation and Recovery Act (tracking hazardous waste)) - notification TRI REPORTER (Tracking of toxic chemicals releasing facilities) Business SIC classification: TELEPHONE AND TELEGRAPH APPARATUS Business NAICS classification: PRINTED CIRCUIT ASSEMBLY (ELECTRONIC ASSEMBLY) MANUFACTURING. Organizations: A TEK INC (CONTACT/OWNER)
, ACROTECH SE (CONTACT/OWNER)
Alternative names: A-TEK MANUFACTURING
BNSF BRAINERD (324 WASHINGTON ST NE in BRAINERD, MN)
STATE MASTER (Minnesota Pollution Control Agency permits and compilance tracking) - AIRS-2703500043, AIR PROGRAM, RCRAINFO-MND000780536, CESQG, PCS-A00000858, GENERAL PERMIT STORM WATER IND, AFS-2703500043, AIR SYNTHETIC MINOR, PCS-A00000858, NPDES STORMWATER PERMIT, RCRIS-MND000780536, CESQG CRITERIA AND HAZARDOUS AIR POLLUTANT INVENTORY (Inventory of air pollution sources) (Resource Conservation and Recovery Act (tracking hazardous waste)) Business SIC classification: RAILROADS, LINE-HAUL OPERATING Business NAICS classification: LINE-HAUL RAILROADS.; LINE-HAUL RAILROADS. Organizations: BNSF CORP (CONTACT/OWNER)
, BNSF RAILWAY CO (CONTACT/OWNER)
Alternative names: BNSF RR - BRAINERD, BURLINGTON NORTHERN, Burlington Northern Railroad - Brainerd
ACROMETAL (210 N.E.10TH. AVE. in BRAINERD, MN)
ENFORCEMENT/COMPLIANCE ACTIVITY (Integrated Compliance Information System) STATE MASTER (Minnesota Pollution Control Agency permits and compilance tracking) - AIRS-2703500047, AIR PROGRAM, PCS-MNG120002, National Pollutant Discharge Elimination System Permit, PCS-SIU000027, NPDES PRETREATMENT PROGRAM, RCRAINFO-MND006173397, SQG, AFS-2703500047, AIR SYNTHETIC MINOR, RCRIS-MND006173397, CESQG CRITERIA AND HAZARDOUS AIR POLLUTANT INVENTORY (Inventory of air pollution sources) Small Quantity Generators, between 100 kg and 1000 kg of hazardous waste/month (Resource Conservation and Recovery Act (tracking hazardous waste)) - notification TRI REPORTER (Tracking of toxic chemicals releasing facilities) Business SIC classification: HARDWARE Business NAICS classification: ALL OTHER MISCELLANEOUS FABRICATED METAL PRODUCT MANUFACTURING. Organizations: ATEK WEST MANUFACTURING (CONTACT/OWNER)
, ATEK MANUFACTURING LLC (CONTACT/OWNER)
Alternative names: ATEK WEST MANUFACTURING LLC
BANG PRINTING (3323 OAK ST in BRAINERD, MN)
AIR SYNTHETIC MINOR (AIRS/AFS) STATE MASTER (Minnesota Pollution Control Agency permits and compilance tracking) - RCRAINFO-MND068148261, LQG, AFS-2703500054, AIR SYNTHETIC MINOR, RCRIS-MND068148261, CESQG Conditionally Exempt Small Quantity Generators, less than 100 kg/month of hazardous waste (Resource Conservation and Recovery Act (tracking hazardous waste)) HAZARDOUS WASTE BIENNIAL REPORTER (Resource Conservation and Recovery Act (tracking hazardous waste)) Business SIC classification: BOOK PRINTING Business NAICS classification: BOOKS PRINTING. Alternative names: BANG PRINTING INC
BRAINERD AREA USED CARS (510 10TH AVE NE in BRAINERD, MN)
STATE MASTER (Minnesota Pollution Control Agency permits and compilance tracking) - RCRAINFO-MND981774904, CESQG, RCRIS-MND981774904, Conditionally Exempt Small Quantity Generators, less than 100 kg/month of hazardous waste (Resource Conservation and Recovery Act (tracking hazardous waste)) - notification USED OIL PROGRAM (Resource Conservation and Recovery Act (tracking hazardous waste)) Business SIC classification: MOTOR VEHICLE DEALERS (USED ONLY) Business NAICS classification: USED CAR DEALERS. Organizations: JOHNSON CARROLL J (CONTACT/OWNER)
BENDER RJ& CJ WINEGAR DDS (1903 S 6TH ST STE 6 in BRAINERD, MN)
STATE MASTER (Minnesota Pollution Control Agency permits and compilance tracking) - RCRAINFO-MND985738475, CESQG, RCRIS-MND985738475, (Resource Conservation and Recovery Act (tracking hazardous waste)) Business SIC classification: HEALTH AND ALLIED SERVICES Organizations: BENDER AND WINEGARD DDS PARTNERS (CONTACT/OWNER)
, BENDER RJ & CJ WINEGAR DDS (CONTACT/OWNER)
Alternative names: BENDER RJ AND WINEGAR CJ DDS
GULL LAKE DAM PROJECT (896 EAST GULL LAKE DRIVE NORTH in BRAINERD, MN) . Federal Facility. ARMY CORPS OF ENGINEERS
STATE MASTER (Minnesota Pollution Control Agency permits and compilance tracking) - RCRAINFO-MND985770957, CESQG, RCRIS-MND985770957, Conditionally Exempt Small Quantity Generators, less than 100 kg/month of hazardous waste (Resource Conservation and Recovery Act (tracking hazardous waste)) - notification TRANSPORTER (Resource Conservation and Recovery Act (tracking hazardous waste)) - notification Organizations: US ARMY CORPS OF ENGINEERS (CONTACT/OWNER)
NORTHERN STATES POWER (17246 STATE HIGHWAY 371 in BRAINERD, MN)
STATE MASTER (Minnesota Pollution Control Agency permits and compilance tracking) - RCRAINFO-MNR000020347, CESQG, RCRIS-MNR000020347, Conditionally Exempt Small Quantity Generators, less than 100 kg/month of hazardous waste (Resource Conservation and Recovery Act (tracking hazardous waste)) - notification TRANSPORTER (Resource Conservation and Recovery Act (tracking hazardous waste)) - notification Business SIC classification: ELECTRIC SERVICES Organizations: CROW WING COOP (CONTACT/OWNER)
, NORTHERN STATES POWER CO DBA XCEL ENERGY (CONTACT/OWNER)
Alternative names: NSP
Housing units lacking complete plumbing facilities: 1.9% Housing units lacking complete kitchen facilities: 2.4%
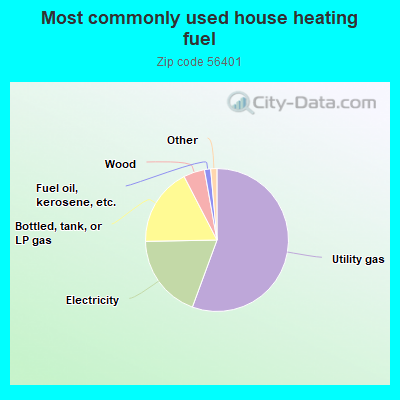
55.6%Utility gas
19.1%Electricity
17.7%Bottled, tank, or LP gas
4.8%Wood
1.4%Fuel oil, kerosene, etc.
0.7%No fuel used
0.7%Other fuel
Population in 1990: 23,504. Population change in the 1990s: +4,100 (+17.4%).
Place of birth for U.S.-born residents:
This state: 25,418
Northeast: 271
Midwest: 2,829
South: 713
West: 1,573
53% of the 56401 zip code residents lived in the same house 5 years ago. Out of people who lived in different houses, 55% lived in this county. Out of people who lived in different counties, 50% lived in Minnesota.
92% of the 56401 zip code residents lived in the same house 1 year ago. Out of people who lived in different houses, 47% moved from this county. Out of people who lived in different houses, 34% moved from different county within same state. Out of people who lived in different houses, 17% moved from different state. Out of people who lived in different houses, 2% moved from abroad.
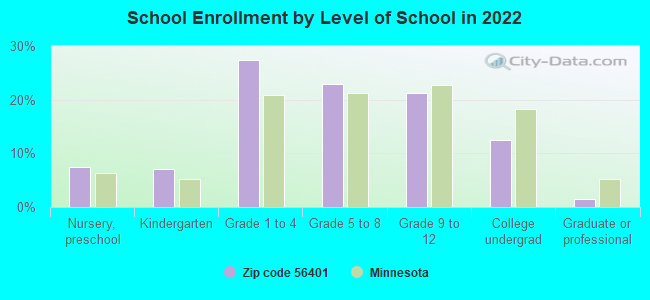
Private vs. public school enrollment:
Students in private schools in grades 1 to 8 (elementary and middle school): 452
Here:
14.4%
Minnesota:
12.9%
Students in private schools in grades 9 to 12 (high school): 81
Here:
6.2%
Minnesota:
8.6%
Students in private undergraduate colleges: 159
Here:
20.6%
Minnesota:
26.2%
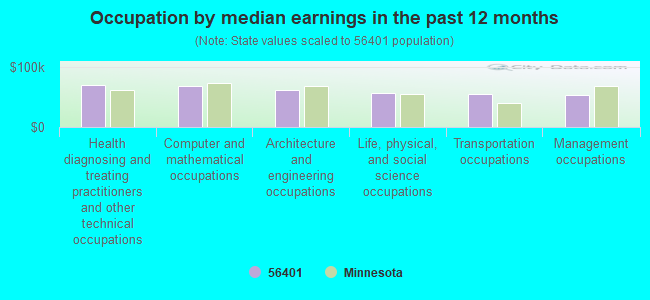
Occupation by median earnings in the past 12 months ($)
70,595Health diagnosing and treating practitioners and other technical occupations
68,212Computer and mathematical occupations
61,398Architecture and engineering occupations
56,205Life, physical, and social science occupations
55,088Transportation occupations
53,644Management occupations
Companies with biggest federal contracts located in this zip code:
EAST GULL LAKE, CITY OF (10790 SQUAW POINT RD in BRAINERD, MN; small business) : $317,088 in 2 contractsin 2005
$158,544 with Army for Construction of Structures and Facilities -- Waste Treatment and Storage Facilities. Signed on 2005-06-20. Completion date: 2005-08-30.
$158,544 with U.S. Army Corps of Engineers - civil program financing only for Construction of Structures and Facilities -- Waste Treatment and Storage Facilities. Signed on 2005-06-20. Completion date: 2005-08-30.
COVENANT HOSPITALITY (2115 S 6TH ST in BRAINERD, MN; small business) : $121,922 in 7 contractsfrom 2003 to 2005
Contracts for Lodging - Hotel/Motel by Army Signed by year:2000: $0; 2001: $0; 2002: $0; 2003: $18,153; 2004: $66,406; 2005: $37,363; 2006: $0.
Biggest contracts:
$58,463 with Army for Lodging - Hotel/Motel. Signed on 2004-01-20. Completion date: 2004-02-13.
$23,453, same as above.Signed on 2005-09-15. Completion date: 2005-09-21.
$15,400, same as above.Signed on 2003-11-26. Completion date: 2003-12-11.
$9,230, same as above.Signed on 2005-12-21. Completion date: 2005-12-07.
HY-TEC CNSTR BRAINERD INC (11360 BUSINESS STE 371 in BRAINERD, MN; small business) : $119,360 in 2 contractsin 2005
$59,680 with Army for Construction of Structures and Facilities -- Other Non-Building Facilities. Signed on 2005-05-31. Completion date: 2005-09-30.
$59,680 with U.S. Army Corps of Engineers - civil program financing only for Construction of Structures and Facilities -- Other Non-Building Facilities. Signed on 2005-05-31. Completion date: 2005-09-30.
CRAGUN CORPORATION (2001 PINE BEACH RD W in BRAINERD, MN; small business) : $76,462 in 7 contractsfrom 2000 to 2005
Contracts for Lodging - Hotel/Motel, Tuition, Registration, and Membership Fees, Lease or Rental of Facilities -- Conference Space and Facilities by Department of Veterans Affairs, Army Signed by year:2000: $30,000; 2001: $0; 2002: $7,587; 2003: $34,635; 2004: $0; 2005: $4,240; 2006: $0.
Biggest contracts:
$30,000 with Department of Veterans Affairs for Lodging - Hotel/Motel. Signed on 2000-10-15. Completion date: 2001-04-15.
$22,390 with Army for Tuition, Registration, and Membership Fees. Signed on 2003-10-27. Completion date: 2003-11-02.
$7,587 with Army for Lease or Rental of Facilities -- Conference Space and Facilities. Signed on 2002-02-27. Completion date: 2002-03-03.
$6,857 with Army for Lodging - Hotel/Motel. Signed on 2003-07-16. Completion date: 2003-02-23.
AUTO IMPORT, INC (22 WASHINGTON ST in BRAINERD, MN) : $58,325 in 4 contractsfrom 2004 to 2005
$32,650 with Army for Motorcycles, Motor Scooters, and Bicycles. Signed on 2004-09-09. Completion date: 2004-10-08.
$8,899, same as above.Signed on 2005-08-11. Completion date: 2005-09-30.
$8,388 with Army for Ground Effect Vehicles. Signed on 2005-08-16. Completion date: 2005-08-22.
$8,388 with U.S. Army Corps of Engineers - civil program financing only for Ground Effect Vehicles. Signed on 2005-08-16. Completion date: 2005-08-22.
CROW WING COOPERATIVE POWER & (17330 STATE HIGHWAY 371 in BRAINERD, MN) : $52,348 in 12 contractsfrom 2003 to 2005
Contracts for Electric Services by U.S. Army Corps of Engineers - civil program financing only, Army Signed by year:2000: $0; 2001: $0; 2002: $0; 2003: $36,000; 2004: $7,630; 2005: $8,718; 2006: $0.
Biggest contracts:
$15,900 with U.S. Army Corps of Engineers - civil program financing only for Electric Services. Signed on 2003-11-28. Completion date: 2004-11-29.
$15,900 with Army for Electric Services. Signed on 2003-11-28. Completion date: 2004-11-29.
$3,815, same as above.Signed on 2004-10-28. Completion date: 2004-10-19.
$3,815 with U.S. Army Corps of Engineers - civil program financing only for Electric Services. Signed on 2004-10-28. Completion date: 2004-10-19.
LODGE AT BRAINERD LAKE,THE (6967 LAKE FOREST RD in BAXTER, MN; small business) : $49,072 in 4 contractsin 2005
$20,400 with Army for Lodging - Hotel/Motel. Signed on 2005-09-19. Completion date: 2005-09-23.
$14,790, same as above.Signed on 2005-09-15. Completion date: 2005-09-21.
$10,057, same as above.Signed on 2005-08-30. Completion date: 2005-08-28.
$3,825, same as above.Signed on 2005-10-04. Completion date: 2005-10-03.
TRIPLE R SYSTEMS INC (1861 NORTHERN PACIFIC ROAD in BRAINERD, MN; small business) : $39,350 in 2 contractsfrom 2002 to 2005
$33,850 with Air Force for Miscellaneous Special Industry Machinery. Signed on 2002-09-13. Completion date: 2002-09-13.
$5,500 with Navy for Grinding Machines. Signed on 2005-06-30. Completion date: 2005-07-29.
MADDEN BROTHERS, INC (11266 PINE BEACH PENINSULA in BRAINERD, MN; small business)
$35,064 with Army for Lodging - Hotel/Motel. Signed on 2004-09-30. Completion date: 2004-09-26.
PIKE PLUMBING & HEATING OF BRA (830 BROOK ST in BRAINERD, MN) : $25,500 in 2 contractsin 2005
$12,750 with U.S. Army Corps of Engineers - civil program financing only for Industrial Furnaces, Kilns, Lehrs, and Ovens. Signed on 2005-06-21. Completion date: 2005-01-26.
$12,750 with Army for Industrial Furnaces, Kilns, Lehrs, and Ovens. Signed on 2005-06-21. Completion date: 2005-01-26.
Top industries in this zip code by the number of employees in 2005:
Health Care and Social Assistance: General Medical and Surgical Hospitals (500-999 employees: 1 establishment)
Health Care and Social Assistance: Nursing Care Facilities (250-499: 1, 100-249: 1, 50-99: 1)
221 people in nursing facilities/skilled-nursing facilities
162 people in group homes intended for adults
124 people in local jails and other municipal confinement facilities
31 people in other noninstitutional facilities
14 people in mental (psychiatric) hospitals and psychiatric units in other hospitals
11 people in correctional facilities intended for juveniles
10 people in residential treatment centers for adults
7 people in emergency and transitional shelters (with sleeping facilities) for people experiencing homelessness
4 people in residential treatment centers for juveniles (non-correctional)
People in group quarters in 2000:
265 people in nursing homes
169 people in mental (psychiatric) hospitals or wards
103 people in other noninstitutional group quarters
85 people in other group homes
75 people in local jails and other confinement facilities (including police lockups)
64 people in homes for the mentally retarded
40 people in hospitals/wards and hospices for chronically ill
40 people in other hospitals or wards for chronically ill
15 people in homes for the mentally ill
12 people in other types of correctional institutions
4 people in hospitals or wards for drug/alcohol abuse
2002 - 2018 National Fire Incident Reporting System (NFIRS) incidents
Based on the data from the years 2002 - 2018 the average number of fire incidents per year is 102. The highest number of fire incidents - 136 took place in 2003, and the least - 67 in 2005. The data has a declining trend.
When looking into fire subcategories, the most reports belonged to: Structure Fires (42.1%), and Outside Fires (36.5%).
Fire incident types reported to NFIRS in Zip Code 56401
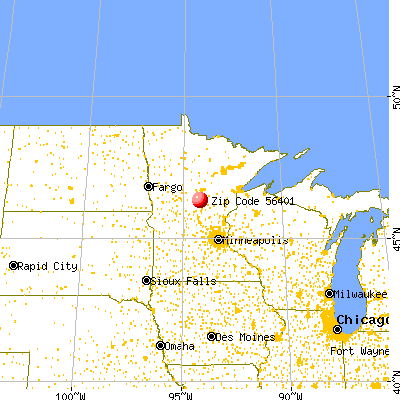


 Nearest zip codes: 56425, 56455, 56449, 56465, 56468, 56444.


 Based on the data from the years 2002 - 2018 the average number of fire incidents per year is 102. The highest number of fire incidents - 136 took place in 2003, and the least - 67 in 2005. The data has a declining trend.
 When looking into fire subcategories, the most reports belonged to: Structure Fires (42.1%), and Outside Fires (36.5%).