Estimated zip code population in 2022: 19,598 Zip code population in 2010: 12,375 Zip code population in 2000: 8,009
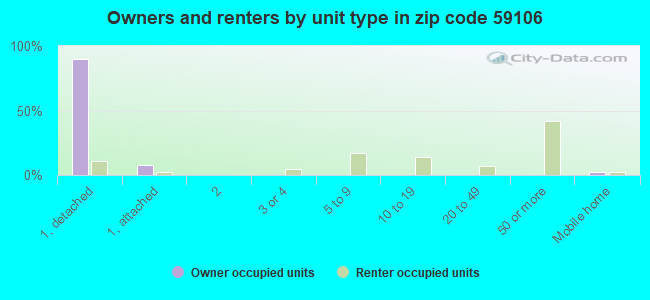
Houses and condos: 7,933 Renter-occupied apartments: 1,699
% of renters here:
22%
State:
31%
March 2022 cost of living index in zip code 59106: 92.0 (less than average, U.S. average is 100)
Land area: 96.9 sq. mi. Water area: 0.0 sq. mi.
Population density: 202 people per square mile
(very low).
OSM Map
General Map
Google Map
MSN Map
OSM Map
General Map
Google Map
MSN Map
OSM Map
General Map
Google Map
MSN Map
OSM Map
General Map
Google Map
MSN Map
Please wait while loading the map...
Real estate property taxes paid for housing units in 2022:
This zip code:
0.7% ($4,051)
Montana:
0.7% ($2,498)
Median real estate property taxes paid for housing units with mortgages in 2022: $4,052 (0.7%) Median real estate property taxes paid for housing units with no mortgage in 2022: $4,095 (0.8%)
Estimated median house/condo value in 2022: $556,012
59106:
$556,012
Montana:
$366,400
According to our research of Montana and other state lists, there were 16 registered sex offenders living in 59106 zip code as of April 26, 2024. The ratio of all residents to sex offenders in zip code 59106 is 963 to 1. The ratio of registered sex offenders to all residents in this zip code is much lower than the state average.
Median resident age:
This zip code:
40.4 years
Montana median age:
40.2 years
Average household size:
This zip code:
2.5 people
Montana:
2.4 people
Averages for the 2020 tax year for zip code 59106, filed in 2021:
Average Adjusted Gross Income (AGI) in 2020: $125,432 (Individual Income Tax Returns)
Here:
$125,432
State:
$70,533
Salary/wage: $93,425 (reported on 81.4% of returns)
Here:
$93,425
State:
$52,258
(% of AGI for various income ranges: 1323.0% for AGIs below $25k, 3697.4% for AGIs $25k-50k, 6612.2% for AGIs $50k-75k, 9449.5% for AGIs $75k-100k, 19196.5% for AGIs $100k-200k, 83404.8% for AGIs over 200k)
Taxable interest for individuals: $3,265 (reported on 43.9% of returns)
This zip code:
$3,265
Montana:
$1,928
(% of AGI for various income ranges: 37.4% for AGIs below $25k, 63.8% for AGIs $25k-50k, 101.6% for AGIs $50k-75k, 157.3% for AGIs $75k-100k, 253.5% for AGIs $100k-200k, 1941.9% for AGIs over 200k)
Ordinary dividends: $11,255 (reported on 32.5% of returns)
Here:
$11,255
State:
$7,554
(% of AGI for various income ranges: 56.3% for AGIs below $25k, 108.9% for AGIs $25k-50k, 196.1% for AGIs $50k-75k, 374.5% for AGIs $75k-100k, 504.4% for AGIs $100k-200k, 5839.0% for AGIs over 200k)
Net capital gain/loss in AGI: +$29,350 (reported on 30.9% of returns)
Here:
+$29,350
State:
+$26,730
(% of AGI for various income ranges: 30.9% for AGIs below $25k, 67.8% for AGIs $25k-50k, 303.1% for AGIs $50k-75k, 394.0% for AGIs $75k-100k, 955.9% for AGIs $100k-200k, 17430.0% for AGIs over 200k)
Profit/loss from business: +$17,330 (reported on 16.4% of returns)
Here:
+$17,330
State:
+$13,757
(% of AGI for various income ranges: 72.4% for AGIs below $25k, 138.2% for AGIs $25k-50k, 308.9% for AGIs $50k-75k, 464.4% for AGIs $75k-100k, 682.8% for AGIs $100k-200k, 2875.2% for AGIs over 200k)
Taxable individual retirement arrangement distribution: $27,681 (reported on 12.3% of returns)
59106:
$27,681
Montana:
$19,575
(% of AGI for various income ranges: 75.0% for AGIs below $25k, 169.1% for AGIs $25k-50k, 363.1% for AGIs $50k-75k, 601.8% for AGIs $75k-100k, 1065.0% for AGIs $100k-200k, 2690.7% for AGIs over 200k)
Self-employed (Keogh) retirement plans: $22,189 (reported on 0.9% of returns)
59106:
$22,189
Montana:
$23,886
(% of AGI for various income ranges: 26.5% for AGIs $100k-200k, 395.2% for AGIs over 200k)
Total itemized deductions: $37,375 (reported on 19.2% of returns)
Here:
$37,375
State:
$33,125
(% of AGI for various income ranges: 128.7% for AGIs below $25k, 250.9% for AGIs $25k-50k, 517.4% for AGIs $50k-75k, 915.2% for AGIs $75k-100k, 1534.0% for AGIs $100k-200k, 9124.3% for AGIs over 200k)
Charity contributions: $15,252 (reported on 16.0% of returns)
Here:
$15,252
State:
$12,481
(% of AGI for various income ranges: 9.8% for AGIs below $25k, 28.8% for AGIs $25k-50k, 67.8% for AGIs $50k-75k, 119.5% for AGIs $75k-100k, 346.8% for AGIs $100k-200k, 4387.9% for AGIs over 200k)
Taxes paid: $8,635 (reported on 19.1% of returns)
59106:
$8,635
State:
$7,689
(% of AGI for various income ranges: 20.2% for AGIs below $25k, 44.6% for AGIs $25k-50k, 136.6% for AGIs $50k-75k, 262.4% for AGIs $75k-100k, 471.4% for AGIs $100k-200k, 1699.0% for AGIs over 200k)
Earned income credit: $1,732 (reported on 5.9% of returns)
Here:
$1,732
State:
$2,035
(% of AGI for various income ranges: 41.9% for AGIs below $25k, 34.2% for AGIs $25k-50k)
Percentage of individuals using paid preparers for their 2020 taxes: 95.4%
Here:
95%
State:
94%
(% for various income ranges: 92.9% for AGIs below $25k, 95.7% for AGIs $25k-50k, 96.6% for AGIs $50k-75k, 96.2% for AGIs $75k-100k, 95.9% for AGIs $100k-200k, 97.1% for AGIs over 200k)
Averages for the 2012 tax year for zip code 59106, filed in 2013:
Average Adjusted Gross Income (AGI) in 2012: $122,962 (Individual Income Tax Returns)
Here:
$122,962
State:
$53,401
Salary/wage: $81,787 (reported on 84.5% of returns)
Here:
$81,787
State:
$40,976
(% of AGI for various income ranges: 76.5% for AGIs below $25k, 72.4% for AGIs $25k-50k, 69.3% for AGIs $50k-75k, 71.9% for AGIs $75k-100k, 71.4% for AGIs $100k-200k, 44.3% for AGIs over 200k)
Taxable interest for individuals: $3,116 (reported on 49.8% of returns)
This zip code:
$3,116
Montana:
$1,689
(% of AGI for various income ranges: 2.3% for AGIs below $25k, 2.2% for AGIs $25k-50k, 1.3% for AGIs $50k-75k, 0.9% for AGIs $75k-100k, 0.8% for AGIs $100k-200k, 1.4% for AGIs over 200k)
Ordinary dividends: $11,343 (reported on 34.4% of returns)
Here:
$11,343
State:
$5,585
(% of AGI for various income ranges: 3.1% for AGIs below $25k, 1.8% for AGIs $25k-50k, 2.3% for AGIs $50k-75k, 1.5% for AGIs $75k-100k, 2.0% for AGIs $100k-200k, 4.1% for AGIs over 200k)
Net capital gain/loss in AGI: +$33,351 (reported on 31.2% of returns)
Here:
+$33,351
State:
+$14,401
(% of AGI for various income ranges: 0.8% for AGIs below $25k, 1.5% for AGIs $25k-50k, 2.3% for AGIs $50k-75k, 1.4% for AGIs $75k-100k, 2.0% for AGIs $100k-200k, 13.6% for AGIs over 200k)
Profit/loss from business: +$23,012 (reported on 17.6% of returns)
Here:
+$23,012
State:
+$10,980
(% of AGI for various income ranges: 5.8% for AGIs below $25k, 4.6% for AGIs $25k-50k, 4.1% for AGIs $50k-75k, 4.0% for AGIs $75k-100k, 3.4% for AGIs $100k-200k, 2.8% for AGIs over 200k)
Taxable individual retirement arrangement distribution: $21,657 (reported on 12.0% of returns)
59106:
$21,657
Montana:
$13,434
(% of AGI for various income ranges: 2.9% for AGIs below $25k, 2.9% for AGIs $25k-50k, 3.0% for AGIs $50k-75k, 3.2% for AGIs $75k-100k, 2.9% for AGIs $100k-200k, 1.4% for AGIs over 200k)
Self-employment retirement plans: $23,580 (reported on 1.5% of returns)
59106:
$23,580
Montana:
$18,233
(% of AGI for various income ranges: 0.4% for AGIs $25k-50k, 0.3% for AGIs $100k-200k, 0.3% for AGIs over 200k)
Total itemized deductions: $33,227 (17% of AGI, reported on 54.4% of returns)
Here:
$33,227
State:
$21,750
Here:
16.7% of AGI
State:
20.5% of AGI
(% of AGI for various income ranges: 16.5% for AGIs below $25k, 15.6% for AGIs $25k-50k, 17.1% for AGIs $50k-75k, 16.6% for AGIs $75k-100k, 16.7% for AGIs $100k-200k, 13.2% for AGIs over 200k)
Charity contributions: $7,641 (reported on 46.8% of returns)
Here:
$7,641
State:
$3,989
(% of AGI for various income ranges: 1.1% for AGIs below $25k, 1.6% for AGIs $25k-50k, 2.1% for AGIs $50k-75k, 2.3% for AGIs $75k-100k, 2.7% for AGIs $100k-200k, 3.4% for AGIs over 200k)
Taxes paid: $14,418 (reported on 53.8% of returns)
59106:
$14,418
State:
$7,640
(% of AGI for various income ranges: 2.3% for AGIs below $25k, 3.7% for AGIs $25k-50k, 5.1% for AGIs $50k-75k, 5.6% for AGIs $75k-100k, 7.0% for AGIs $100k-200k, 6.7% for AGIs over 200k)
Earned income credit: $2,038 (reported on 6.2% of returns)
Here:
$2,038
State:
$2,015
(% of AGI for various income ranges: 3.2% for AGIs below $25k, 0.6% for AGIs $25k-50k)
Percentage of individuals using paid preparers for their 2012 taxes: 64.3%
Here:
64%
State:
57%
(% for various income ranges: 48.4% for AGIs below $25k, 59.2% for AGIs $25k-50k, 67.5% for AGIs $50k-75k, 69.6% for AGIs $75k-100k, 72.1% for AGIs $100k-200k, 84.9% for AGIs over 200k)
Averages for the 2004 tax year for zip code 59106, filed in 2005:
Average Adjusted Gross Income (AGI) in 2004: $83,934 (Individual Income Tax Returns)
Here:
$83,934
State:
$37,845
Salary/wage: $62,126 (reported on 84.7% of returns)
Here:
$62,126
State:
$31,190
(% of AGI for various income ranges: 131.0% for AGIs below $10k, 71.2% for AGIs $10k-25k, 71.6% for AGIs $25k-50k, 76.3% for AGIs $50k-75k, 75.3% for AGIs $75k-100k, 56.4% for AGIs over 100k)
Taxable interest for individuals: $2,637 (reported on 62.0% of returns)
This zip code:
$2,637
Montana:
$1,879
(% of AGI for various income ranges: 12.4% for AGIs below $10k, 3.8% for AGIs $10k-25k, 2.9% for AGIs $25k-50k, 1.6% for AGIs $50k-75k, 1.6% for AGIs $75k-100k, 1.8% for AGIs over 100k)
Taxable dividends: $6,376 (reported on 43.1% of returns)
Here:
$6,376
State:
$3,070
(% of AGI for various income ranges: 9.0% for AGIs below $10k, 2.4% for AGIs $10k-25k, 1.8% for AGIs $25k-50k, 1.6% for AGIs $50k-75k, 1.5% for AGIs $75k-100k, 4.0% for AGIs over 100k)
Net capital gain/loss: +$16,748 (reported on 39.2% of returns)
Here:
+$16,748
State:
+$10,237
(% of AGI for various income ranges: -4.3% for AGIs below $10k, 2.4% for AGIs $10k-25k, 1.3% for AGIs $25k-50k, 3.1% for AGIs $50k-75k, 2.9% for AGIs $75k-100k, 10.4% for AGIs over 100k)
Profit/loss from business: +$20,868 (reported on 20.6% of returns)
Here:
+$20,868
State:
+$8,849
(% of AGI for various income ranges: 0.1% for AGIs below $10k, 6.4% for AGIs $10k-25k, 7.3% for AGIs $25k-50k, 3.2% for AGIs $50k-75k, 6.2% for AGIs $75k-100k, 5.0% for AGIs over 100k)
IRA payment deduction: $3,712 (reported on 4.2% of returns)
59106:
$3,712
Montana:
$2,958
(% of AGI for various income ranges: 0.5% for AGIs $10k-25k, 0.7% for AGIs $25k-50k, 0.4% for AGIs $50k-75k, 0.3% for AGIs $75k-100k, 0.1% for AGIs over 100k)
Self-employed pension: $18,355 (reported on 2.8% of returns)
Here:
$18,355
Montana:
$13,795
(% of AGI for various income ranges: 0.2% for AGIs $50k-75k, 0.6% for AGIs $75k-100k, 0.8% for AGIs over 100k)
Total itemized deductions: $25,706 (19% of AGI, reported on 53.5% of returns)
Here:
$25,706
State:
$17,258
Here:
18.6% of AGI
State:
23.1% of AGI
(% of AGI for various income ranges: 28.5% for AGIs below $10k, 17.9% for AGIs $10k-25k, 18.8% for AGIs $25k-50k, 19.7% for AGIs $50k-75k, 18.8% for AGIs $75k-100k, 15.0% for AGIs over 100k)
Charity contributions deductions: $5,337 (4% of AGI, reported on 48.7% of returns)
Here:
$5,337
State:
$2,921
Here:
3.7% of AGI
State:
3.7% of AGI
(% of AGI for various income ranges: 1.1% for AGIs below $10k, 1.6% for AGIs $10k-25k, 2.5% for AGIs $25k-50k, 2.7% for AGIs $50k-75k, 2.7% for AGIs $75k-100k, 3.4% for AGIs over 100k)
Total tax: $16,774 (reported on 79.8% of returns)
59106:
$16,774
State:
$5,485
(% of AGI for various income ranges: 3.2% for AGIs below $10k, 4.9% for AGIs $10k-25k, 6.8% for AGIs $25k-50k, 7.8% for AGIs $50k-75k, 9.7% for AGIs $75k-100k, 19.8% for AGIs over 100k)
Earned income credit: $1,571 (reported on 6.0% of returns)
Here:
$1,571
State:
$1,604
Percentage of individuals using paid preparers for their 2004 taxes: 67.6%
Here:
68%
State:
63%
(% for various income ranges: 54.1% for AGIs below $10k, 62.9% for AGIs $10k-25k, 69.3% for AGIs $25k-50k, 72.2% for AGIs $50k-75k, 68.8% for AGIs $75k-100k, 78.7% for AGIs over 100k)
Likely homosexual households (counted as self-reported same-sex unmarried-partner households)
Lesbian couples: 0.0% of all households
Gay men: 0.1% of all households
Household received Food Stamps/SNAP in the past 12 months: 203 Household did not receive Food Stamps/SNAP in the past 12 months: 7,656
Women who had a birth in the past 12 months: 280 (234 now married, 48 unmarried) Women who did not have a birth in the past 12 months: 4,218 (2,552 now married, 1,665 unmarried)
Housing units in zip code 59106 with a mortgage: 3,510 (429 second mortgage, 289 both second mortgage and home equity loan) Houses without a mortgage: 180
Median monthly owner costs for units with a mortgage: $2,232 Median monthly owner costs for units without a mortgage: $748
Residents with income below the poverty level in 2022:
This zip code:
3.9%
Whole state:
12.1%
Residents with income below 50% of the poverty level in 2022:
This zip code:
1.8%
Whole state:
6.3%
Median number of rooms in houses and condos:
Here:
7.6
State:
6.4
Median number of rooms in apartments:
Here:
3.0
State:
4.2
Notable locations in this zip code not listed on our city pages
Creeks: South Fork Fivemile Creek (A), Cove Creek (B), Dry Creek (C), Dusty Creek (D), North Fork Alkali Creek (E), North Fork Fivemile Creek (F), South Fork Alkali Creek (G). Display/hide their locations on the map
In group quarters: 233 (-1 institutionalized population)
Size of family households: 2,443 2-persons, 1,297 3-persons, 1,119 4-persons, 439 5-persons, 225 6-persons, 126 7-or-more-persons
Size of nonfamily households: 1,830 1-person, 286 2-persons, 41 5-persons
4,365 married couples with children.
466 single-parent households (370 men, 96 women).
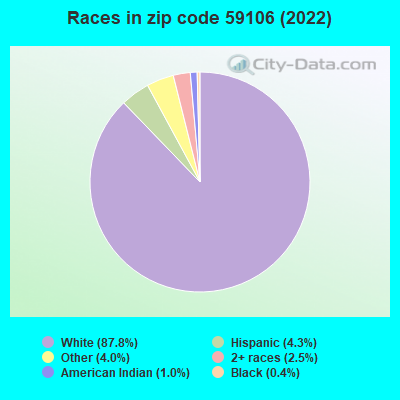
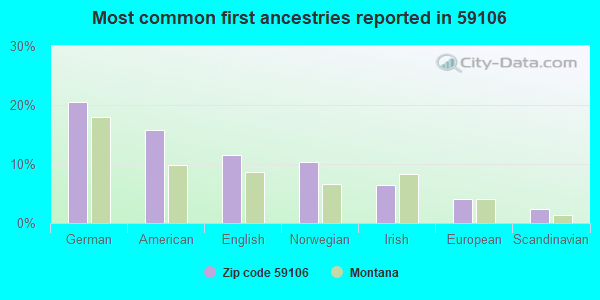
95.4% of residents of 59106 zip code speak English at home.
1.5% of residents speak Spanish at home (75% very well, 9% well, 15% not well).
4.2% of residents speak other Indo-European language at home (17% very well, 83% well).
0.3% of residents speak other language at home (5% very well, 95% well).
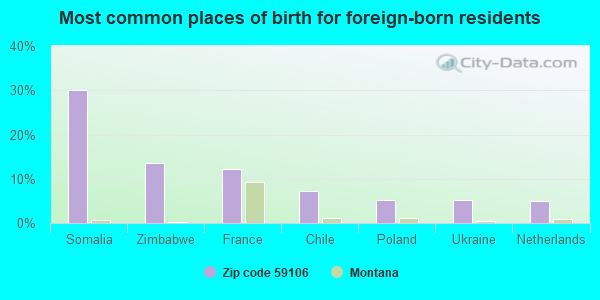
Foreign born population: 427 (2.2%) (76.8% of them are naturalized citizens)
Major facilities with environmental interests located in this zip code:
ELDER GROVE 7-8 (1532 SOUTH 64 STREET W in BILLINGS, MT)
(National Center for Education Statistics) - STATE ID-1791 Organizations: ELDER GROVE ELEM (SCHOOL DISTRICT)
KOCH MATERIALS CO. BILLINGS (7315 MOSSMAIN LN. in BILLINGS, MT)
Conditionally Exempt Small Quantity Generators, less than 100 kg/month of hazardous waste (Resource Conservation and Recovery Act (tracking hazardous waste)) TRI REPORTER (Tracking of toxic chemicals releasing facilities) Business SIC classification: ASPHALT PAVING MIXTURES AND BLOCKS Organizations: KOCH MATERIALS COMPANY (CONTACT/OPERATOR)
, SEMMATERIALS LP (CONTACT/OPERATOR)
Alternative names: KOCH MATERIALS COMPANY
JTL GROUP INCORPORATED (1202 SHILOH ROAD in BILLINGS, MT)
AIR SYNTHETIC MINOR (AIRS/AFS) CRITERIA AND HAZARDOUS AIR POLLUTANT INVENTORY (Inventory of air pollution sources) Conditionally Exempt Small Quantity Generators, less than 100 kg/month of hazardous waste (Resource Conservation and Recovery Act (tracking hazardous waste)) Business SIC classification: ASPHALT PAVING MIXTURES AND BLOCKS Organizations: MONTANA DAKOTA UTILITIES CO (CONTACT/OWNER)
Alternative names: JTL GROUP INC BILLINGS
MOBLEY/FISHER PIT (7105 LAUREL AIRPORT RD in BILLINGS, MT)
National Pollutant Discharge Elimination System NON-MAJOR (Tracking pollutant discharge elimination systems) - permit Business SIC classification: CONSTRUCTION SAND AND GRAVEL Organizations: FISHER SAND AND GRAVEL (CONTACT/OWNER)
Alternative names: FISHER SAND AND GRAVEL, OZARK CENTRE PARK
DARREN MILLER (2007 S 72ND ROAD in BILLINGS, MT)
National Pollutant Discharge Elimination System NON-MAJOR (Tracking pollutant discharge elimination systems) - permit Business SIC classification: BEEF CATTLE FEEDLOTS
ED KRAFT/LITTLE VALLEY RANCH (7428 NIEBAUER RD. in BILLINGS, MT)
National Pollutant Discharge Elimination System NON-MAJOR (Tracking pollutant discharge elimination systems) - permit Business SIC classification: BEEF CATTLE FEEDLOTS
ELDER GROVE SCHOOL (1532 S 64TH W in BILLINGS, MT)
(Geographic Names Information System) ENFORCEMENT/COMPLIANCE ACTIVITY (Integrated Compliance Information System) STATE MASTER (Montana air and water quality tracking) Alternative names: ELDER GROVE SCHOOL DISTRICT 8
FLYING BOX RANCH (741 ALLENDALE ROAD in BILLINGS, MT)
National Pollutant Discharge Elimination System NON-MAJOR (Tracking pollutant discharge elimination systems) - permit Business SIC classification: BEEF CATTLE FEEDLOTS
GREG & GENE MILLER (5815 KING AVE W. in BILLINGS, MT)
National Pollutant Discharge Elimination System NON-MAJOR (Tracking pollutant discharge elimination systems) - permit Business SIC classification: BEEF CATTLE FEEDLOTS
LOREN & TANCY FRANK (8522 DANFORD RANCH in BILLINGS, MT)
National Pollutant Discharge Elimination System NON-MAJOR (Tracking pollutant discharge elimination systems) - permit Business SIC classification: BEEF CATTLE FEEDLOTS
HYBRITECH SEED INTERNATIONAL INC (6875 KING AVE W in BILLINGS, MT)
Conditionally Exempt Small Quantity Generators, less than 100 kg/month of hazardous waste (Resource Conservation and Recovery Act (tracking hazardous waste)) Organizations: MONSANTO COMPANY (CONTACT/OWNER)
BILLINGS CHRISTIAN SCHOOL (4525 GRAND AVENUE in BILLINGS, MT)
ENFORCEMENT/COMPLIANCE ACTIVITY (Integrated Compliance Information System)
ELK RIVER CONCRETE PRODUCTS COMPANY OF MONTANA (4240 NEIBAUER ROAD in BILLINGS, MT)
COMPLIANCE ACTIVITY (Tracking inspections of insecticide, fungicide, and rodenticide, and toxic substances)
Housing units lacking complete plumbing facilities: 1.7% Housing units lacking complete kitchen facilities: 2.5%
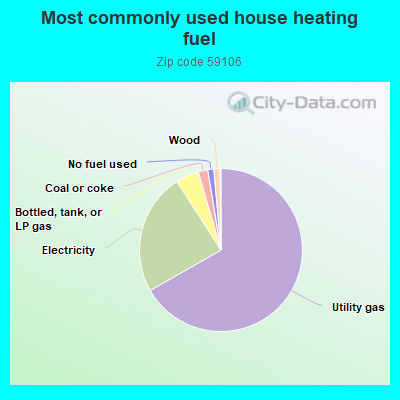
66.8%Utility gas
24.2%Electricity
4.6%Bottled, tank, or LP gas
1.9%Coal or coke
1.2%No fuel used
1.2%Wood
Population in 1990: 5,623. Population change in the 1990s: +2,386 (+42.4%).
Place of birth for U.S.-born residents:
This state: 9,798
Northeast: 592
Midwest: 3,242
South: 1,603
West: 3,769
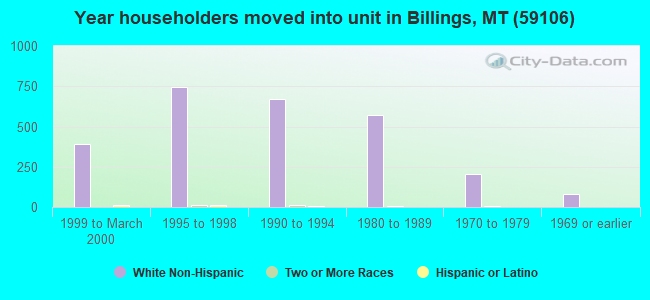
58% of the 59106 zip code residents lived in the same house 5 years ago. Out of people who lived in different houses, 59% lived in this county. Out of people who lived in different counties, 50% lived in Montana.
85% of the 59106 zip code residents lived in the same house 1 year ago. Out of people who lived in different houses, 45% moved from this county. Out of people who lived in different houses, 16% moved from different county within same state. Out of people who lived in different houses, 38% moved from different state.
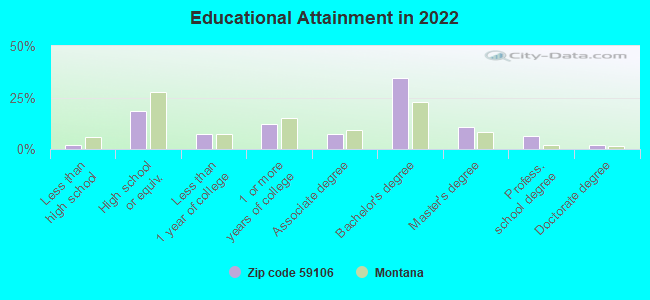
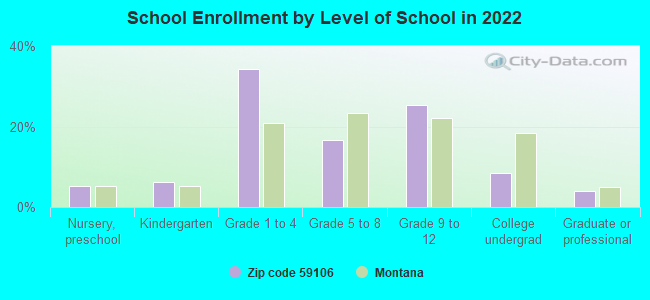
Private vs. public school enrollment:
Students in private schools in grades 1 to 8 (elementary and middle school): 831
Here:
33.8%
Montana:
15.3%
Students in private schools in grades 9 to 12 (high school): 167
Here:
14.3%
Montana:
12.2%
Students in private undergraduate colleges: 15
Here:
4.0%
Montana:
15.0%
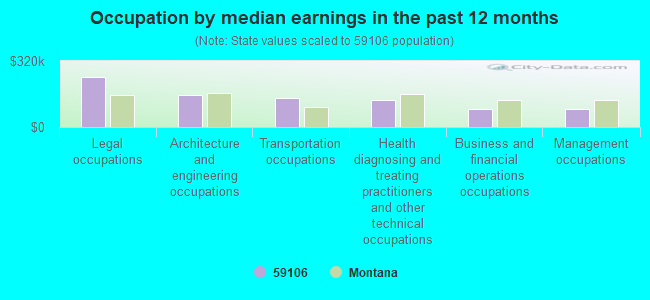
Occupation by median earnings in the past 12 months ($)
240,181Legal occupations
153,287Architecture and engineering occupations
140,495Transportation occupations
133,291Health diagnosing and treating practitioners and other technical occupations
89,546Business and financial operations occupations
86,072Management occupations
Companies with federal contracts located in this zip code:
THE SCIENCE AND CONSERVATION CENTER INCORPORATED (2100 S SCHILOH RD in BILLINGS, MT; small business) 3 employees, $115000 revenue. Nonprofit Organization: $227,868 in 13 contractsfrom 2002 to 2006
Contracts for Animal and Fisheries Studies, Drugs and Biologicals, Other Medical Services, In Vitro Diagnostic Substances, Reagents, Test Kits, and Sets by Geological Survey, Bureau of Land Management, National Institute of Standards and Technology Signed by year:2000: $0; 2001: $0; 2002: $82,000; 2003: -$20,864; 2004: $130,698; 2005: $36,882; 2006: -$848.
Biggest contracts:
$82,000 with Geological Survey for Animal and Fisheries Studies. Signed on 2002-08-15. Completion date: 2003-08-15.
$72,525 with Bureau of Land Management for Drugs and Biologicals. Signed on 2004-08-26. Completion date: 2004-09-30.
$39,475 with Bureau of Land Management for Other Medical Services. Signed on 2004-12-02. Completion date: 2005-09-30.
$36,000, same as above.Signed on 2005-06-06. Completion date: 2005-08-31.
edward d. henderson (7409 Charolais Street in Billings, MT; small business) : $142,645 in 6 contractsfrom 2003 to 2005
Contracts for Legal Services, Expert Witness by Offices, Boards and Divisions (includes Attorney General, Deputy Attorney General, etc.) Signed by year:2000: $0; 2001: $0; 2002: $0; 2003: $84,985; 2004: $0; 2005: $57,660; 2006: $0.
Biggest contracts:
$44,985 with Offices, Boards and Divisions (includes Attorney General, Deputy Attorney General, etc.) for Legal Services. Taking place in DC. Signed on 2003-01-15. Completion date: 2003-12-15.
$31,280 with Offices, Boards and Divisions (includes Attorney General, Deputy Attorney General, etc.) for Expert Witness. Signed on 2005-06-01. Completion date: 2006-05-30.
$26,380 with Offices, Boards and Divisions (includes Attorney General, Deputy Attorney General, etc.) for Expert Witness. Taking place in DC. Signed on 2005-03-15. Completion date: 2006-11-30.
$20,000, same as above.Signed on 2003-11-03. Completion date: 2004-01-30.
ERNEST V. SMITH, M.D. (5134 HAZELNUT AVENU in BILLINGS, MT; small business) : $120,000 in 3 contractsfrom 2003 to 2004
$120,000 with Public Health Service for Personal Services Contracts. Signed on 2004-09-30. Effective on 2004-10-01. Completion date: 2005-09-30.
$0, same as above.Signed on 2003-10-01. Completion date: 2004-09-30.
$0, same as above.Signed on 2003-10-01. Completion date: 2004-09-30.
BLAIR, MARK D (4742 CHEYENNE TRAIL in BILLINGS, MT; small business)
$14,600 with Army for Advertising Services. Signed on 2004-08-31. Completion date: 2005-08-31.
DALE L HUDIBURGH, INC (1730 SOUTH 48TH STREET WES in BILLINGS, MT; small business)
$6,395 with Army for Snow Removal/Salt Service (also spreading aggregate or other snow melting material). Signed on 2002-10-31. Completion date: 2003-09-30.
MEYERCO SPRINKLERS INC (1835 CHELSEA LANE in BILLINGS, MT; small business)
$6,350 with Navy for Maintenance, Repair or Alteration of Real Property -- Miscellaneous Buildings. Signed on 2002-09-10. Completion date: 2002-10-25.
Top industries in this zip code by the number of employees in 2005:
Health Care and Social Assistance: Residential Mental Health and Substance Abuse Facilities (250-499 employees: 1 establishment)
Other Services (except Public Administration): Religious Organizations (100-249: 1, 20-49: 3, 5-9: 1, 1-4: 2)
Construction: Water and Sewer Line and Related Structures Construction (100-249: 1, 10-19: 1)
Construction: New Single-Family Housing Construction (except Operative Builders) (20-49: 1, 5-9: 2, 1-4: 16)
Administrative and Support and Waste Management and Remediation Services: Security Guards and Patrol Services (50-99: 1)
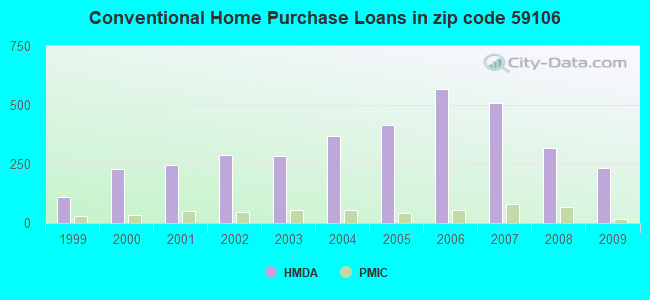
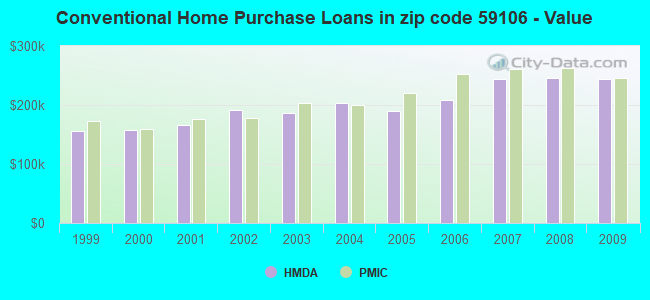
Detailed PMIC statistics for the following Tracts:0014.00
, 0018.01
2002 - 2018 National Fire Incident Reporting System (NFIRS) incidents
Based on the data from the years 2002 - 2018 the average number of fires per year is 27. The highest number of reported fires - 43 took place in 2012, and the least - 12 in 2002. The data has a rising trend.
When looking into fire subcategories, the most reports belonged to: Outside Fires (72.0%), and Structure Fires (14.6%).
Fire incident types reported to NFIRS in Zip Code 59106

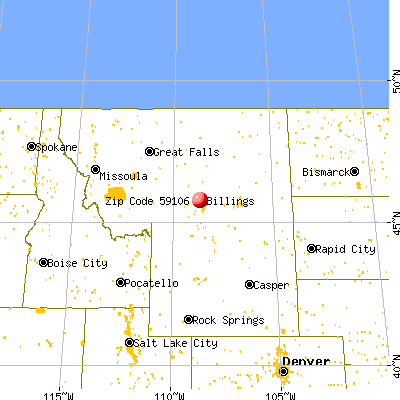


 Nearest zip codes: 59102, 59044, 59002, 59105, 59057, 59015.
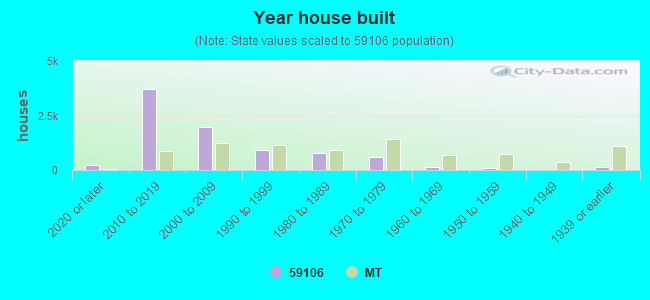


 Based on the data from the years 2002 - 2018 the average number of fires per year is 27. The highest number of reported fires - 43 took place in 2012, and the least - 12 in 2002. The data has a rising trend.
 When looking into fire subcategories, the most reports belonged to: Outside Fires (72.0%), and Structure Fires (14.6%).