Estimated zip code population in 2022: 1,535 Zip code population in 2010: 1,747 Zip code population in 2000: 1,645
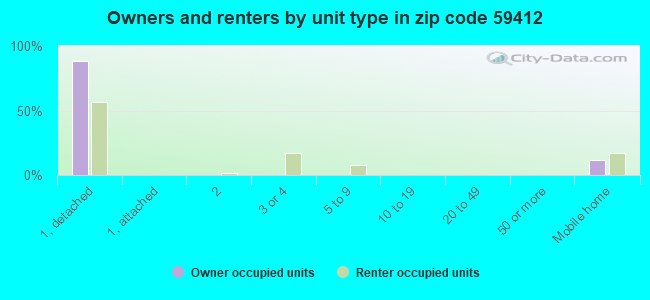
Houses and condos: 824 Renter-occupied apartments: 145
% of renters here:
23%
State:
31%
March 2022 cost of living index in zip code 59412: 87.9 (less than average, U.S. average is 100)
Land area: 384.0 sq. mi. Water area: 0.0 sq. mi.
Population density: 4 people per square mile
(very low).
OSM Map
General Map
Google Map
MSN Map
OSM Map
General Map
Google Map
MSN Map
OSM Map
General Map
Google Map
MSN Map
OSM Map
General Map
Google Map
MSN Map
Please wait while loading the map...
Real estate property taxes paid for housing units in 2022:
This zip code:
0.8% ($2,145)
Montana:
0.7% ($2,498)
Median real estate property taxes paid for housing units with mortgages in 2022: $2,098 (0.8%) Median real estate property taxes paid for housing units with no mortgage in 2022: $2,229 (0.8%)
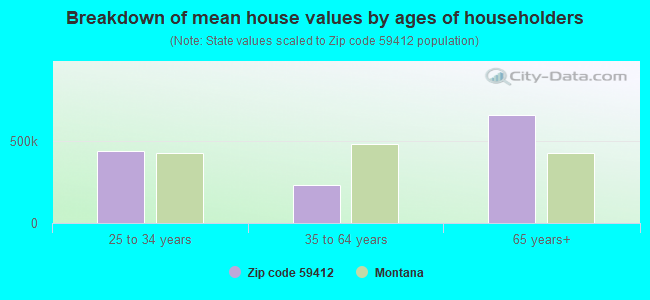
Estimated median house/condo value in 2022: $271,953
59412:
$271,953
Montana:
$366,400
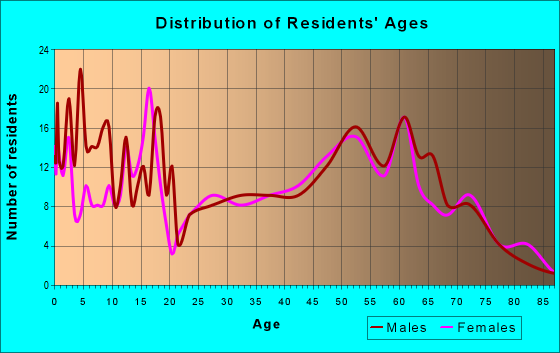
Median resident age:
This zip code:
44.4 years
Montana median age:
40.2 years
Average household size:
This zip code:
2.4 people
Montana:
2.4 people
Averages for the 2020 tax year for zip code 59412, filed in 2021:
Average Adjusted Gross Income (AGI) in 2020: $60,754 (Individual Income Tax Returns)
Here:
$60,754
State:
$70,533
Salary/wage: $53,373 (reported on 76.4% of returns)
Here:
$53,373
State:
$52,258
(% of AGI for various income ranges: 1115.4% for AGIs below $25k, 3770.8% for AGIs $25k-50k, 6554.0% for AGIs $50k-75k, 8686.7% for AGIs $75k-100k, 14772.9% for AGIs $100k-200k)
Taxable interest for individuals: $1,045 (reported on 43.1% of returns)
This zip code:
$1,045
Montana:
$1,928
(% of AGI for various income ranges: 50.8% for AGIs below $25k, 31.7% for AGIs $25k-50k, 278.0% for AGIs $50k-75k, 26.7% for AGIs $75k-100k, 92.9% for AGIs $100k-200k)
Ordinary dividends: $2,835 (reported on 23.6% of returns)
Here:
$2,835
State:
$7,554
(% of AGI for various income ranges: 70.0% for AGIs below $25k, 55.0% for AGIs $25k-50k, 296.0% for AGIs $50k-75k, 88.3% for AGIs $75k-100k, 177.1% for AGIs $100k-200k)
Net capital gain/loss in AGI: +$13,521 (reported on 26.4% of returns)
Here:
+$13,521
State:
+$26,730
(% of AGI for various income ranges: 86.9% for AGIs below $25k, 120.8% for AGIs $25k-50k, 1192.0% for AGIs $50k-75k, 268.3% for AGIs $75k-100k, 2220.0% for AGIs $100k-200k)
Profit/loss from business: +$6,183 (reported on 16.7% of returns)
Here:
+$6,183
State:
+$13,757
(% of AGI for various income ranges: 411.7% for AGIs $25k-50k, 70.0% for AGIs $75k-100k, 294.3% for AGIs $100k-200k)
Taxable individual retirement arrangement distribution: $8,350 (reported on 8.3% of returns)
59412:
$8,350
Montana:
$19,575
(% of AGI for various income ranges: 221.7% for AGIs $25k-50k, 391.7% for AGIs $75k-100k)
Total itemized deductions: $29,400 (reported on 5.6% of returns)
Here:
$29,400
State:
$33,125
(% of AGI for various income ranges: 1680.0% for AGIs $100k-200k)
Charity contributions: $4,733 (reported on 4.2% of returns)
Here:
$4,733
State:
$12,481
(% of AGI for various income ranges: 202.9% for AGIs $100k-200k)
Taxes paid: $7,875 (reported on 5.6% of returns)
59412:
$7,875
State:
$7,689
(% of AGI for various income ranges: 450.0% for AGIs $100k-200k)
Earned income credit: $2,322 (reported on 12.5% of returns)
Here:
$2,322
State:
$2,035
(% of AGI for various income ranges: 93.8% for AGIs below $25k, 72.5% for AGIs $25k-50k)
Percentage of individuals using paid preparers for their 2020 taxes: 93.1%
Here:
93%
State:
94%
(% for various income ranges: 91.3% for AGIs below $25k, 94.4% for AGIs $25k-50k, 90.0% for AGIs $50k-75k, 100.0% for AGIs $75k-100k, 90.9% for AGIs $100k-200k, 100.0% for AGIs over 200k)
Averages for the 2012 tax year for zip code 59412, filed in 2013:
Average Adjusted Gross Income (AGI) in 2012: $44,189 (Individual Income Tax Returns)
Here:
$44,189
State:
$53,401
Salary/wage: $42,845 (reported on 66.3% of returns)
Here:
$42,845
State:
$40,976
(% of AGI for various income ranges: 55.0% for AGIs below $25k, 70.3% for AGIs $25k-50k, 68.9% for AGIs $50k-75k, 72.4% for AGIs $75k-100k, 57.9% for AGIs $100k-200k)
Taxable interest for individuals: $1,273 (reported on 39.8% of returns)
This zip code:
$1,273
Montana:
$1,689
(% of AGI for various income ranges: 2.5% for AGIs below $25k, 1.2% for AGIs $25k-50k, 2.7% for AGIs $50k-75k, 0.2% for AGIs $75k-100k, 0.5% for AGIs $100k-200k)
Ordinary dividends: $4,470 (reported on 32.5% of returns)
Here:
$4,470
State:
$5,585
(% of AGI for various income ranges: 21.6% for AGIs below $25k, 1.0% for AGIs $25k-50k, 2.8% for AGIs $50k-75k, 0.4% for AGIs $75k-100k, 0.5% for AGIs $100k-200k)
Net capital gain/loss in AGI: +$8,153 (reported on 18.1% of returns)
Here:
+$8,153
State:
+$14,401
(% of AGI for various income ranges: 1.5% for AGIs below $25k, 2.6% for AGIs $25k-50k, 5.7% for AGIs $50k-75k, 5.0% for AGIs $100k-200k)
Profit/loss from business: +$10,925 (reported on 14.5% of returns)
Here:
+$10,925
State:
+$10,980
(% of AGI for various income ranges: 3.0% for AGIs below $25k, 6.3% for AGIs $25k-50k, 11.2% for AGIs $75k-100k)
Taxable individual retirement arrangement distribution: $7,643 (reported on 8.4% of returns)
59412:
$7,643
Montana:
$13,434
Total itemized deductions: $18,460 (21% of AGI, reported on 24.1% of returns)
Here:
$18,460
State:
$21,750
Here:
20.9% of AGI
State:
20.5% of AGI
(% of AGI for various income ranges: 8.0% for AGIs below $25k, 8.7% for AGIs $25k-50k, 7.7% for AGIs $50k-75k, 11.6% for AGIs $75k-100k, 11.6% for AGIs $100k-200k)
Charity contributions: $2,600 (reported on 18.1% of returns)
Here:
$2,600
State:
$3,989
(% of AGI for various income ranges: 1.7% for AGIs $25k-50k, 1.1% for AGIs $50k-75k, 1.4% for AGIs $75k-100k, 0.9% for AGIs $100k-200k)
Taxes paid: $5,575 (reported on 24.1% of returns)
59412:
$5,575
State:
$7,640
(% of AGI for various income ranges: 1.9% for AGIs $25k-50k, 1.8% for AGIs $50k-75k, 3.8% for AGIs $75k-100k, 4.6% for AGIs $100k-200k)
Earned income credit: $2,100 (reported on 13.3% of returns)
Here:
$2,100
State:
$2,015
(% of AGI for various income ranges: 3.6% for AGIs below $25k, 1.3% for AGIs $25k-50k)
Percentage of individuals using paid preparers for their 2012 taxes: 65.1%
Here:
65%
State:
57%
(% for various income ranges: 64.1% for AGIs below $25k, 52.9% for AGIs $25k-50k, 70.0% for AGIs $50k-75k, 75.0% for AGIs $75k-100k, 77.8% for AGIs $100k-200k)
Averages for the 2004 tax year for zip code 59412, filed in 2005:
Average Adjusted Gross Income (AGI) in 2004: $29,312 (Individual Income Tax Returns)
Here:
$29,312
State:
$37,845
Salary/wage: $30,242 (reported on 69.5% of returns)
Here:
$30,242
State:
$31,190
(% of AGI for various income ranges: 116.8% for AGIs below $10k, 65.6% for AGIs $10k-25k, 75.5% for AGIs $25k-50k, 73.4% for AGIs $50k-75k, 104.4% for AGIs $75k-100k, 35.5% for AGIs over 100k)
Taxable interest for individuals: $2,017 (reported on 45.0% of returns)
This zip code:
$2,017
Montana:
$1,879
(% of AGI for various income ranges: 17.0% for AGIs below $10k, 3.3% for AGIs $10k-25k, 3.8% for AGIs $25k-50k, 2.1% for AGIs $50k-75k, 1.3% for AGIs $75k-100k, 1.9% for AGIs over 100k)
Taxable dividends: $3,900 (reported on 35.4% of returns)
Here:
$3,900
State:
$3,070
(% of AGI for various income ranges: 79.7% for AGIs below $10k, 9.2% for AGIs $10k-25k, 1.0% for AGIs $25k-50k, 0.9% for AGIs $50k-75k, 1.9% for AGIs $75k-100k)
Net capital gain/loss: +$3,801 (reported on 21.0% of returns)
Here:
+$3,801
State:
+$10,237
(% of AGI for various income ranges: 21.1% for AGIs below $10k, 1.4% for AGIs $10k-25k, 2.0% for AGIs $25k-50k, 1.9% for AGIs $50k-75k, 5.2% for AGIs over 100k)
Profit/loss from business: +$4,014 (reported on 17.6% of returns)
Here:
+$4,014
State:
+$8,849
(% of AGI for various income ranges: 7.1% for AGIs below $10k, 3.1% for AGIs $10k-25k, -0.6% for AGIs $25k-50k, 4.6% for AGIs $50k-75k, 5.8% for AGIs $75k-100k)
IRA payment deduction: $2,750 (reported on 1.5% of returns)
59412:
$2,750
Montana:
$2,958
Total itemized deductions: $15,710 (26% of AGI, reported on 21.4% of returns)
Here:
$15,710
State:
$17,258
Here:
26.0% of AGI
State:
23.1% of AGI
(% of AGI for various income ranges: 10.5% for AGIs $10k-25k, 9.9% for AGIs $25k-50k, 12.8% for AGIs $50k-75k, 18.7% for AGIs $75k-100k, 9.8% for AGIs over 100k)
Charity contributions deductions: $2,072 (3% of AGI, reported on 17.4% of returns)
Here:
$2,072
State:
$2,921
Here:
3.2% of AGI
State:
3.7% of AGI
(% of AGI for various income ranges: 0.8% for AGIs $10k-25k, 1.2% for AGIs $25k-50k, 1.6% for AGIs $50k-75k, 1.9% for AGIs $75k-100k, 1.0% for AGIs over 100k)
Total tax: $3,595 (reported on 72.4% of returns)
59412:
$3,595
State:
$5,485
(% of AGI for various income ranges: 6.4% for AGIs below $10k, 3.7% for AGIs $10k-25k, 6.4% for AGIs $25k-50k, 8.9% for AGIs $50k-75k, 9.8% for AGIs $75k-100k, 18.7% for AGIs over 100k)
Earned income credit: $1,655 (reported on 13.9% of returns)
Here:
$1,655
State:
$1,604
Percentage of individuals using paid preparers for their 2004 taxes: 71.8%
Here:
72%
State:
63%
(% for various income ranges: 76.6% for AGIs below $10k, 68.1% for AGIs $10k-25k, 68.2% for AGIs $25k-50k, 70.8% for AGIs $50k-75k, 71.9% for AGIs $75k-100k, 94.7% for AGIs over 100k)
Household received Food Stamps/SNAP in the past 12 months: 22 Household did not receive Food Stamps/SNAP in the past 12 months: 613
Women who had a birth in the past 12 months: 18 (18 now married, 0 unmarried) Women who did not have a birth in the past 12 months: 274 (135 now married, 138 unmarried)
Housing units in zip code 59412 with a mortgage: 213 (1 second mortgage, 2 home equity loan) Median monthly owner costs for units with a mortgage: $1,513 Median monthly owner costs for units without a mortgage: $515
Residents with income below the poverty level in 2022:
This zip code:
7.8%
Whole state:
12.1%
Residents with income below 50% of the poverty level in 2022:
This zip code:
5.3%
Whole state:
6.3%
Median number of rooms in houses and condos:
Here:
6.1
State:
6.4
Median number of rooms in apartments:
Here:
5.0
State:
4.2
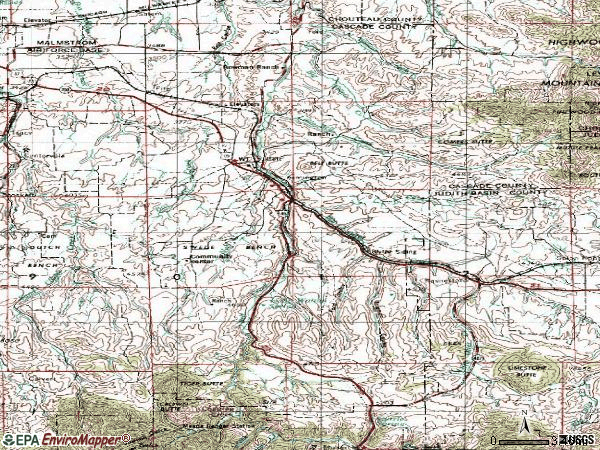
Notable locations in this zip code not listed on our city pages
Notable locations in zip code 59412: Logging Creek (A), Neil Creek Ranch (B), Four Corners (C), Armington (D), Belt (E), Fort Ponderosa RV Park (F), Armington Junction Rest Area (G), Willow Creek Ranch (H), Tiger Butte Community Center (I), Camp Don Bosco (J), Belt Rural Fire District (K), Belt Volunteer Fire Department (L), Belt Public Library (M). Display/hide their locations on the map
Churches in zip code 59412 include: Valley Baptist Church (A), Saint Marks Catholic Church (B), Montclair United Methodist Church (C), The Church of Jesus Christ of Latter Day Saints (D), Belt Community Church (E). Display/hide their locations on the map
Cemeteries: Tiger Butte Cemetery (1), Big Willow Cemetery (2), Pleasant View Cemetery (3), Big Willow Cemetery (4), Goodman Cemetery (5), Lower Belt Cemetery (6), Monarch Cemetery (7). Display/hide their locations on the map
Streams, rivers, and creeks: Beaudry Fork (A), Big Otter Creek (B), Big Willow Creek (C), Cora Creek (D), Tiger Creek (E), Flood Creek (F), Little Belt Creek (G), Middle Willow Creek (H), Neil Creek (I). Display/hide their locations on the map
In group quarters: 18 (-1 institutionalized population)
Size of family households: 291 2-persons, 44 3-persons, 114 4-persons, 24 5-persons
Size of nonfamily households: 139 1-person, 13 2-persons
184 married couples with children.
98 single-parent households (57 men, 41 women).
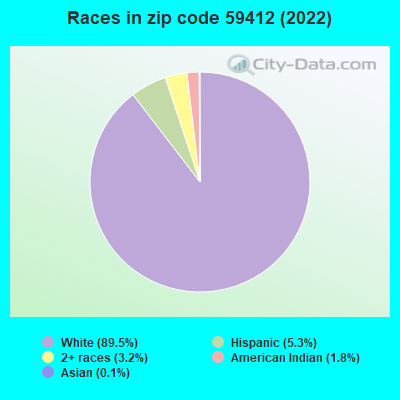
96.6% of residents of 59412 zip code speak English at home.
0.5% of residents speak Spanish at home (100% very well).
3.1% of residents speak other Indo-European language at home (100% very well).
0.1% of residents speak Asian or Pacific Island language at home (100% well).
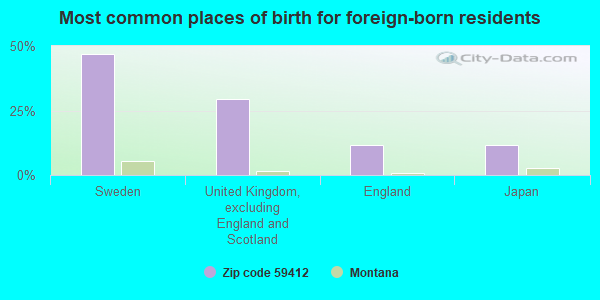
Foreign born population: 17 (1.2%) (61.1% of them are naturalized citizens)
This zip code:
1.2%
Whole state:
2.3%
47%Sweden
29%United Kingdom, excluding England and Scotland
12%England
12%Japan
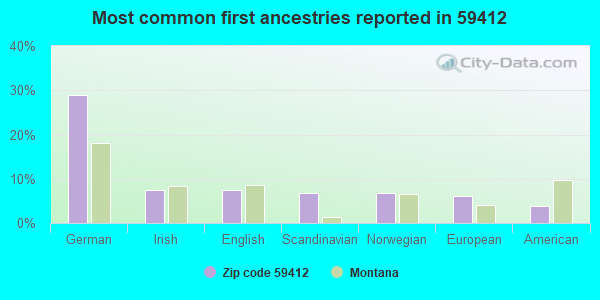
29%German
8%Irish
7%English
7%Scandinavian
7%Norwegian
6%European
4%American
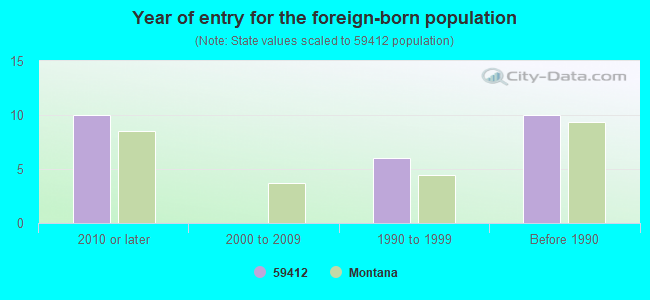
Year of entry for the foreign-born population
102010 or later
02000 to 2009
61990 to 1999
10Before 1990
Facilities with environmental interests located in this zip code:
BELT VALLEY DEVELOPMENT CO., INC (P.O. BOX 283 in BELT, MT)
AIR MINOR (AIRS/AFS) STATE MASTER (Montana air and water quality tracking) - MT-CEDARS-100021, AIR PROGRAM Business SIC classification: CONSTRUCTION SAND AND GRAVEL Organizations: BELT VALLEY DEVELOPMENT CO INC (CONTACT/APPLICANT)
BELT PUBLIC SCHOOLS (#1 CHURCH ST in BELT, MT)
STATE MASTER (Montana air and water quality tracking) - MT-CEDARS-100051, UNDERGROUND STORAGE TANK PROGRAM Conditionally Exempt Small Quantity Generators, less than 100 kg/month of hazardous waste (Resource Conservation and Recovery Act (tracking hazardous waste)) Organizations: BELT PUBLIC SCHOOLS DISTRICT #29 (CONTACT/OWNER)
, BELT PUBLICS SCHOOLS (CONTACT/OWNER)
BELT SCHOOL (1 CHURCH ST in BELT, MT)
ENFORCEMENT/COMPLIANCE ACTIVITY (Integrated Compliance Information System) STATE MASTER (Montana air and water quality tracking) (National Center for Education Statistics) - STATE ID-0168 Business SIC classification: ELEMENTARY AND SECONDARY SCHOOLS Organizations: BELT ELEM (SCHOOL DISTRICT)
Alternative names: Belt School District 29-D
BELT 7-8 (1 CHURCH STREET in BELT, MT)
(National Center for Education Statistics) - STATE ID-1678 Organizations: BELT ELEM (SCHOOL DISTRICT)
BELT HIGH SCHOOL (1 CHURCH STREET in BELT, MT)
(National Center for Education Statistics) - STATE ID-0169 Organizations: BELT H S (SCHOOL DISTRICT)
BELT SCHOOL (DISTRICT # 28 in BELT, MT)
(Integrated Compliance Information System) - ICIS-08-1986-0072, FORMAL ENFORCEMENT ACTION
BELT WWTP (T19N R6E S23 in BELT, MT)
National Pollutant Discharge Elimination System NON-MAJOR (Tracking pollutant discharge elimination systems) - permit Business SIC classification: SEWERAGE SYSTEMS Alternative names: BELT - TOWN OF
GERHART JOHN (6203 HWY 89 in BELT, MT)
(Resource Conservation and Recovery Act (tracking hazardous waste)) Alternative names: JOHN GERHART
LITTLE BELT CREEK RANCH (T19N R7E S16 NW in BELT, MT)
National Pollutant Discharge Elimination System NON-MAJOR (Tracking pollutant discharge elimination systems) - permit Business SIC classification: GENERAL LIVESTOCK, EXCEPT DAIRY AND POULTRY
BELT VALLEY ANIMAL HOSPITAL (233 BELT CREEK ROAD in BELT, MT)
ENFORCEMENT/COMPLIANCE ACTIVITY (Integrated Compliance Information System)
BELT VALLEY COMPUTERS (66 CASTNER STREET in BELT, MT)
ENFORCEMENT/COMPLIANCE ACTIVITY (Integrated Compliance Information System)
EAGLES NEST GARAGE (201 LEWIS in BELT, MT)
ENFORCEMENT/COMPLIANCE ACTIVITY (Integrated Compliance Information System)
HALF MOON BREWERY (7 5TH STREET S in BELT, MT)
ENFORCEMENT/COMPLIANCE ACTIVITY (Integrated Compliance Information System)
Housing units lacking complete plumbing facilities: 2.7% Housing units lacking complete kitchen facilities: 6.8%
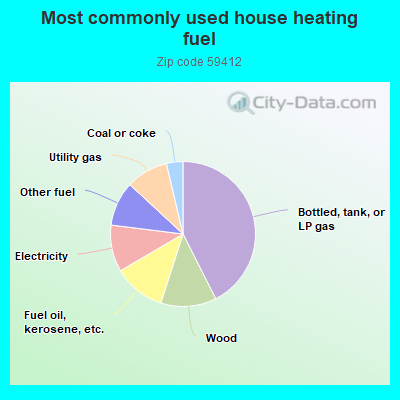
42.9%Bottled, tank, or LP gas
12.5%Wood
11.7%Fuel oil, kerosene, etc.
10.5%Electricity
10.0%Other fuel
9.5%Utility gas
3.7%Coal or coke
Population in 1990: 1,383. Population change in the 1990s: +262 (+18.9%).
Place of birth for U.S.-born residents:
This state: 932
Northeast: 56
Midwest: 158
South: 130
West: 222
64% of the 59412 zip code residents lived in the same house 5 years ago. Out of people who lived in different houses, 53% lived in this county. Out of people who lived in different counties, 50% lived in Montana.
92% of the 59412 zip code residents lived in the same house 1 year ago. Out of people who lived in different houses, 33% moved from this county. Out of people who lived in different houses, 38% moved from different county within same state. Out of people who lived in different houses, 30% moved from different state.
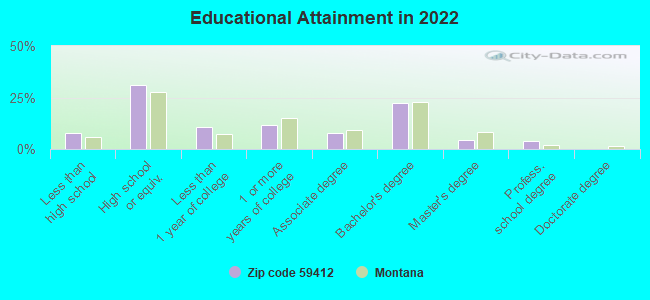
Private vs. public school enrollment:
Students in private schools in grades 1 to 8 (elementary and middle school): 23
Here:
16.8%
Montana:
15.3%
Students in private schools in grades 9 to 12 (high school):
Here:
0.0%
Montana:
12.2%
Students in private undergraduate colleges: 23
Here:
70.7%
Montana:
15.0%
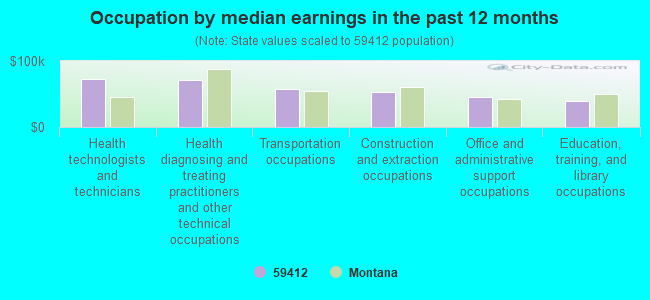
Occupation by median earnings in the past 12 months ($)
72,693Health technologists and technicians
71,234Health diagnosing and treating practitioners and other technical occupations
58,332Transportation occupations
52,881Construction and extraction occupations
46,206Office and administrative support occupations
39,512Education, training, and library occupations
Top industries in this zip code by the number of employees in 2005:
Accommodation and Food Services: Hotels (except Casino Hotels) and Motels (10-19 employees: 1 establishment)
Finance and Insurance: Commercial Banking (10-19: 1)
Accommodation and Food Services: Full-Service Restaurants (5-9: 1, 1-4: 3)
Other Services (except Public Administration): Religious Organizations (5-9: 1, 1-4: 1)
Construction: New Single-Family Housing Construction (except Operative Builders) (1-4: 3)
Accommodation and Food Services: Limited-Service Restaurants (1-4: 2)
Construction: Residential Remodelers (1-4: 2)
People in group quarters in 2010:
148 people in other noninstitutional facilities
Fatal accident statistics in 2014:
Fatal accident count: 2
Vehicles involved in fatal accidents: 2
Fatal accidents caused by drunken drivers: 2
Fatalities: 2
Persons involved in fatal accidents: 2
Pedestrians involved in fatal accidents: 0
Fatal accident statistics in 2013:
Fatal accident count: 2
Vehicles involved in fatal accidents: 4
Fatal accidents caused by drunken drivers: 1
Fatalities: 4
Persons involved in fatal accidents: 6
Pedestrians involved in fatal accidents: 0
Home Mortgage Disclosure Act Aggregated Statistics For Year 2009 (Based on 2 partial tracts)
A) FHA, FSA/RHS & VA Home Purchase Loans
B) Conventional Home Purchase Loans
C) Refinancings
D) Home Improvement Loans
F) Non-occupant Loans on < 5 Family Dwellings (A B C & D)
G) Loans On Manufactured Home Dwelling (A B C & D)
Number
Average Value
Number
Average Value
Number
Average Value
Number
Average Value
Number
Average Value
Number
Average Value
LOANS ORIGINATED
8
$106,291
14
$161,079
84
$176,454
8
$93,444
9
$162,777
9
$98,408
APPLICATIONS APPROVED, NOT ACCEPTED
1
$119,790
2
$313,880
7
$157,479
0
$0
1
$74,620
2
$116,520
APPLICATIONS DENIED
1
$58,910
5
$115,602
22
$210,870
3
$78,117
4
$150,722
4
$81,825
APPLICATIONS WITHDRAWN
0
$0
2
$221,255
14
$151,727
3
$32,730
1
$39,280
1
$6,550
FILES CLOSED FOR INCOMPLETENESS
0
$0
1
$58,910
1
$276,900
0
$0
0
$0
0
$0
Aggregated Statistics For Year 2008 (Based on 2 partial tracts)
A) FHA, FSA/RHS & VA Home Purchase Loans
B) Conventional Home Purchase Loans
C) Refinancings
D) Home Improvement Loans
F) Non-occupant Loans on < 5 Family Dwellings (A B C & D)
G) Loans On Manufactured Home Dwelling (A B C & D)
Number
Average Value
Number
Average Value
Number
Average Value
Number
Average Value
Number
Average Value
Number
Average Value
LOANS ORIGINATED
7
$120,353
25
$172,500
46
$174,920
9
$80,079
6
$131,247
9
$97,827
APPLICATIONS APPROVED, NOT ACCEPTED
0
$0
1
$202,930
7
$211,623
2
$112,590
0
$0
0
$0
APPLICATIONS DENIED
3
$87,717
3
$73,533
17
$182,941
9
$59,569
4
$111,445
5
$82,742
APPLICATIONS WITHDRAWN
1
$180,010
1
$79,860
9
$198,417
2
$101,790
0
$0
1
$77,240
FILES CLOSED FOR INCOMPLETENESS
0
$0
0
$0
3
$228,673
0
$0
0
$0
0
$0
Aggregated Statistics For Year 2007 (Based on 2 partial tracts)
A) FHA, FSA/RHS & VA Home Purchase Loans
B) Conventional Home Purchase Loans
C) Refinancings
D) Home Improvement Loans
E) Loans on Dwellings For 5+ Families
F) Non-occupant Loans on < 5 Family Dwellings (A B C & D)
G) Loans On Manufactured Home Dwelling (A B C & D)
Number
Average Value
Number
Average Value
Number
Average Value
Number
Average Value
Number
Average Value
Number
Average Value
Number
Average Value
LOANS ORIGINATED
3
$77,680
26
$187,442
44
$138,002
14
$82,994
1
$173,470
7
$176,836
10
$75,410
APPLICATIONS APPROVED, NOT ACCEPTED
0
$0
4
$236,965
5
$112,592
1
$52,370
0
$0
4
$68,732
0
$0
APPLICATIONS DENIED
1
$77,900
6
$288,570
35
$158,133
5
$105,128
0
$0
1
$164,300
1
$59,570
APPLICATIONS WITHDRAWN
1
$202,930
3
$140,520
15
$131,138
1
$4,580
0
$0
1
$193,110
1
$119,790
FILES CLOSED FOR INCOMPLETENESS
0
$0
0
$0
4
$111,445
0
$0
0
$0
1
$106,050
1
$7,200
Aggregated Statistics For Year 2006 (Based on 2 partial tracts)
A) FHA, FSA/RHS & VA Home Purchase Loans
B) Conventional Home Purchase Loans
C) Refinancings
D) Home Improvement Loans
F) Non-occupant Loans on < 5 Family Dwellings (A B C & D)
G) Loans On Manufactured Home Dwelling (A B C & D)
Number
Average Value
Number
Average Value
Number
Average Value
Number
Average Value
Number
Average Value
Number
Average Value
LOANS ORIGINATED
7
$157,946
35
$114,667
43
$132,001
14
$61,860
12
$87,552
12
$62,351
APPLICATIONS APPROVED, NOT ACCEPTED
0
$0
2
$104,080
13
$93,910
1
$26,840
1
$65,460
1
$46,480
APPLICATIONS DENIED
1
$214,710
4
$97,045
34
$131,498
11
$58,378
2
$114,230
3
$96,443
APPLICATIONS WITHDRAWN
1
$101,460
4
$109,810
11
$101,642
3
$62,407
0
$0
3
$55,640
FILES CLOSED FOR INCOMPLETENESS
0
$0
1
$32,730
5
$157,234
1
$81,820
0
$0
0
$0
Aggregated Statistics For Year 2005 (Based on 2 partial tracts)
A) FHA, FSA/RHS & VA Home Purchase Loans
B) Conventional Home Purchase Loans
C) Refinancings
D) Home Improvement Loans
F) Non-occupant Loans on < 5 Family Dwellings (A B C & D)
G) Loans On Manufactured Home Dwelling (A B C & D)
Number
Average Value
Number
Average Value
Number
Average Value
Number
Average Value
Number
Average Value
Number
Average Value
LOANS ORIGINATED
9
$98,844
25
$108,926
48
$125,029
9
$22,838
9
$52,296
7
$48,534
APPLICATIONS APPROVED, NOT ACCEPTED
1
$81,170
5
$130,658
6
$121,428
1
$7,860
3
$38,183
0
$0
APPLICATIONS DENIED
1
$65,460
9
$98,553
32
$101,381
5
$25,922
5
$68,602
6
$45,603
APPLICATIONS WITHDRAWN
1
$74,620
3
$87,497
14
$134,520
0
$0
0
$0
1
$36,000
FILES CLOSED FOR INCOMPLETENESS
0
$0
1
$43,200
5
$119,268
1
$26,840
1
$43,200
0
$0
Aggregated Statistics For Year 2004 (Based on 2 partial tracts)
A) FHA, FSA/RHS & VA Home Purchase Loans
B) Conventional Home Purchase Loans
C) Refinancings
D) Home Improvement Loans
F) Non-occupant Loans on < 5 Family Dwellings (A B C & D)
G) Loans On Manufactured Home Dwelling (A B C & D)
Number
Average Value
Number
Average Value
Number
Average Value
Number
Average Value
Number
Average Value
Number
Average Value
LOANS ORIGINATED
8
$105,145
29
$114,036
46
$129,952
6
$23,457
12
$71,733
10
$76,195
APPLICATIONS APPROVED, NOT ACCEPTED
1
$116,520
2
$109,320
10
$162,603
3
$23,347
0
$0
1
$90,330
APPLICATIONS DENIED
0
$0
5
$120,708
35
$105,596
5
$41,632
1
$237,620
3
$53,240
APPLICATIONS WITHDRAWN
1
$49,090
3
$81,170
22
$132,616
1
$26,180
3
$96,227
0
$0
FILES CLOSED FOR INCOMPLETENESS
0
$0
0
$0
3
$102,337
0
$0
1
$46,480
0
$0
Aggregated Statistics For Year 2003 (Based on 2 partial tracts)
A) FHA, FSA/RHS & VA Home Purchase Loans
B) Conventional Home Purchase Loans
C) Refinancings
D) Home Improvement Loans
F) Non-occupant Loans on < 5 Family Dwellings (A B C & D)
Number
Average Value
Number
Average Value
Number
Average Value
Number
Average Value
Number
Average Value
LOANS ORIGINATED
4
$126,665
22
$113,156
107
$119,841
7
$23,191
7
$94,823
APPLICATIONS APPROVED, NOT ACCEPTED
0
$0
2
$139,100
9
$145,612
1
$26,180
1
$174,120
APPLICATIONS DENIED
1
$78,550
3
$128,520
33
$91,763
1
$36,660
1
$62,190
APPLICATIONS WITHDRAWN
1
$149,250
5
$69,126
26
$100,960
0
$0
3
$68,297
FILES CLOSED FOR INCOMPLETENESS
0
$0
0
$0
3
$142,047
1
$62,190
0
$0
Aggregated Statistics For Year 2002 (Based on 2 partial tracts)
A) FHA, FSA/RHS & VA Home Purchase Loans
B) Conventional Home Purchase Loans
C) Refinancings
D) Home Improvement Loans
E) Loans on Dwellings For 5+ Families
F) Non-occupant Loans on < 5 Family Dwellings (A B C & D)
Number
Average Value
Number
Average Value
Number
Average Value
Number
Average Value
Number
Average Value
Number
Average Value
LOANS ORIGINATED
3
$58,260
16
$99,949
62
$103,459
8
$45,822
1
$229,110
9
$66,260
APPLICATIONS APPROVED, NOT ACCEPTED
2
$73,645
1
$212,740
12
$136,593
3
$25,530
0
$0
1
$126,340
APPLICATIONS DENIED
0
$0
10
$68,275
25
$94,315
3
$22,257
0
$0
1
$61,530
APPLICATIONS WITHDRAWN
0
$0
2
$72,335
12
$122,082
0
$0
0
$0
1
$23,570
FILES CLOSED FOR INCOMPLETENESS
0
$0
1
$21,600
1
$130,920
0
$0
0
$0
0
$0
Aggregated Statistics For Year 2001 (Based on 2 partial tracts)
A) FHA, FSA/RHS & VA Home Purchase Loans
B) Conventional Home Purchase Loans
C) Refinancings
D) Home Improvement Loans
F) Non-occupant Loans on < 5 Family Dwellings (A B C & D)
Number
Average Value
Number
Average Value
Number
Average Value
Number
Average Value
Number
Average Value
LOANS ORIGINATED
5
$69,388
17
$85,560
75
$85,622
7
$22,163
8
$80,516
APPLICATIONS APPROVED, NOT ACCEPTED
0
$0
5
$67,292
5
$37,050
0
$0
0
$0
APPLICATIONS DENIED
1
$33,380
7
$104,643
20
$60,420
5
$9,558
1
$52,370
APPLICATIONS WITHDRAWN
1
$41,890
4
$71,515
11
$77,778
1
$45,820
1
$28,150
FILES CLOSED FOR INCOMPLETENESS
0
$0
2
$37,640
5
$109,580
2
$14,075
0
$0
Aggregated Statistics For Year 2000 (Based on 2 partial tracts)
A) FHA, FSA/RHS & VA Home Purchase Loans
B) Conventional Home Purchase Loans
C) Refinancings
D) Home Improvement Loans
F) Non-occupant Loans on < 5 Family Dwellings (A B C & D)
Number
Average Value
Number
Average Value
Number
Average Value
Number
Average Value
Number
Average Value
LOANS ORIGINATED
4
$53,350
22
$86,169
24
$74,488
10
$15,579
3
$64,370
APPLICATIONS APPROVED, NOT ACCEPTED
0
$0
6
$44,622
3
$36,220
1
$15,060
1
$20,950
APPLICATIONS DENIED
0
$0
18
$46,731
23
$56,125
6
$18,765
1
$15,060
APPLICATIONS WITHDRAWN
0
$0
1
$179,360
10
$62,318
1
$218,640
1
$125,030
FILES CLOSED FOR INCOMPLETENESS
0
$0
1
$133,540
1
$49,750
0
$0
0
$0
Aggregated Statistics For Year 1999 (Based on 1 partial tract)
A) FHA, FSA/RHS & VA Home Purchase Loans
B) Conventional Home Purchase Loans
C) Refinancings
D) Home Improvement Loans
F) Non-occupant Loans on < 5 Family Dwellings (A B C & D)
Detailed PMIC statistics for the following Tracts:0106.00
2002 - 2018 National Fire Incident Reporting System (NFIRS) incidents
Based on the data from the years 2002 - 2018 the average number of fire incidents per year is 12. The highest number of fire incidents - 28 took place in 2012, and the least - 2 in 2016. The data has a growing trend.
When looking into fire subcategories, the most reports belonged to: Outside Fires (66.5%), and Structure Fires (18.8%).
Fire incident types reported to NFIRS in Zip Code 59412


 Nearest zip codes: 59469, 59463, 59450, 59472, 59447, 59480.


 Based on the data from the years 2002 - 2018 the average number of fire incidents per year is 12. The highest number of fire incidents - 28 took place in 2012, and the least - 2 in 2016. The data has a growing trend.
 When looking into fire subcategories, the most reports belonged to: Outside Fires (66.5%), and Structure Fires (18.8%).