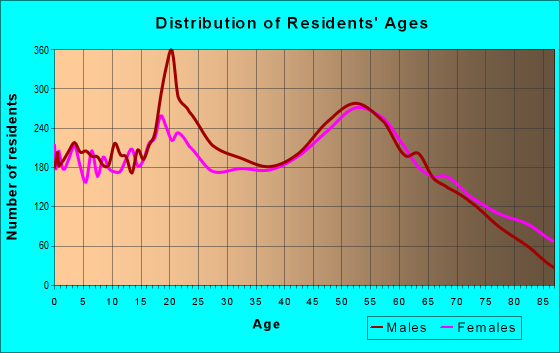
Estimated zip code population in 2022: 34,955 Zip code population in 2010: 33,147 Zip code population in 2000: 33,654
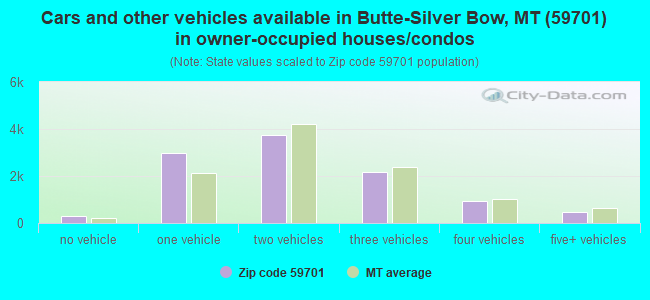
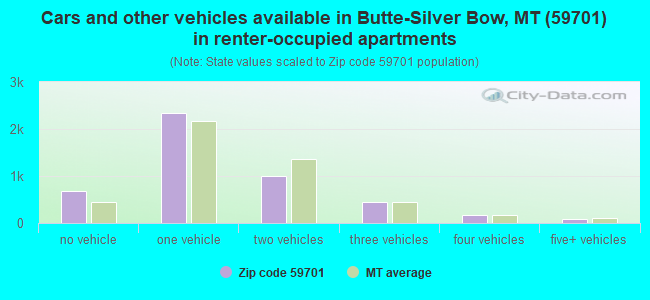
Houses and condos: 17,217 Renter-occupied apartments: 4,724
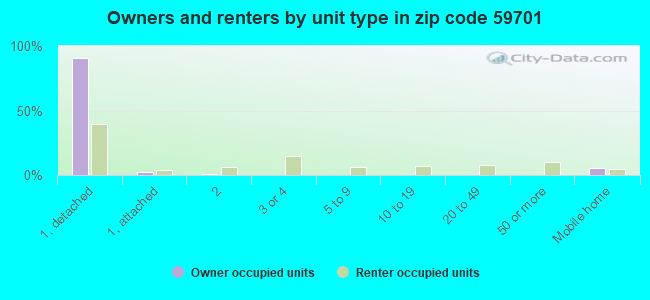
% of renters here:
31%
State:
31%
March 2022 cost of living index in zip code 59701: 85.8 (less than average, U.S. average is 100)
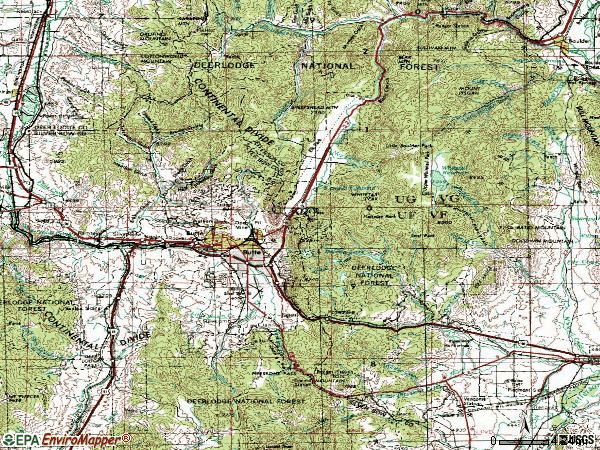
Land area: 452.2 sq. mi. Water area: 0.8 sq. mi.
Population density: 77 people per square mile
(very low).
OSM Map
General Map
Google Map
MSN Map
OSM Map
General Map
Google Map
MSN Map
OSM Map
General Map
Google Map
MSN Map
OSM Map
General Map
Google Map
MSN Map
Please wait while loading the map...
Real estate property taxes paid for housing units in 2022:
This zip code:
1.0% ($2,226)
Montana:
0.7% ($2,498)
Median real estate property taxes paid for housing units with mortgages in 2022: $2,279 (0.9%) Median real estate property taxes paid for housing units with no mortgage in 2022: $2,176 (1.1%)
Averages for the 2020 tax year for zip code 59701, filed in 2021:
Average Adjusted Gross Income (AGI) in 2020: $58,531 (Individual Income Tax Returns)
Here:
$58,531
State:
$70,533
Salary/wage: $47,484 (reported on 81.8% of returns)
Here:
$47,484
State:
$52,258
(% of AGI for various income ranges: 1260.3% for AGIs below $25k, 3490.8% for AGIs $25k-50k, 6113.4% for AGIs $50k-75k, 8743.2% for AGIs $75k-100k, 17048.5% for AGIs $100k-200k, 65407.7% for AGIs over 200k)
Taxable interest for individuals: $1,573 (reported on 29.3% of returns)
This zip code:
$1,573
Montana:
$1,928
(% of AGI for various income ranges: 14.4% for AGIs below $25k, 16.6% for AGIs $25k-50k, 35.7% for AGIs $50k-75k, 99.7% for AGIs $75k-100k, 134.6% for AGIs $100k-200k, 2479.2% for AGIs over 200k)
Ordinary dividends: $4,731 (reported on 18.6% of returns)
Here:
$4,731
State:
$7,554
(% of AGI for various income ranges: 22.2% for AGIs below $25k, 36.6% for AGIs $25k-50k, 79.8% for AGIs $50k-75k, 185.2% for AGIs $75k-100k, 299.6% for AGIs $100k-200k, 4259.2% for AGIs over 200k)
Net capital gain/loss in AGI: +$13,872 (reported on 16.2% of returns)
Here:
+$13,872
State:
+$26,730
(% of AGI for various income ranges: 9.0% for AGIs below $25k, 36.4% for AGIs $25k-50k, 93.7% for AGIs $50k-75k, 192.4% for AGIs $75k-100k, 649.0% for AGIs $100k-200k, 18109.2% for AGIs over 200k)
Profit/loss from business: +$11,435 (reported on 11.2% of returns)
Here:
+$11,435
State:
+$13,757
(% of AGI for various income ranges: 50.8% for AGIs below $25k, 79.8% for AGIs $25k-50k, 119.9% for AGIs $50k-75k, 245.1% for AGIs $75k-100k, 510.9% for AGIs $100k-200k, 4508.5% for AGIs over 200k)
Taxable individual retirement arrangement distribution: $18,641 (reported on 10.1% of returns)
59701:
$18,641
Montana:
$19,575
(% of AGI for various income ranges: 61.2% for AGIs below $25k, 100.8% for AGIs $25k-50k, 251.7% for AGIs $50k-75k, 490.6% for AGIs $75k-100k, 900.9% for AGIs $100k-200k, 4196.9% for AGIs over 200k)
Self-employed (Keogh) retirement plans: $20,275 (reported on 0.3% of returns)
59701:
$20,275
Montana:
$23,886
(% of AGI for various income ranges: 72.4% for AGIs $100k-200k)
Total itemized deductions: $29,958 (reported on 4.9% of returns)
Here:
$29,958
State:
$33,125
(% of AGI for various income ranges: 39.5% for AGIs below $25k, 65.5% for AGIs $25k-50k, 219.5% for AGIs $50k-75k, 329.3% for AGIs $75k-100k, 545.2% for AGIs $100k-200k, 5381.5% for AGIs over 200k)
Charity contributions: $8,641 (reported on 3.8% of returns)
Here:
$8,641
State:
$12,481
(% of AGI for various income ranges: 2.1% for AGIs below $25k, 7.2% for AGIs $25k-50k, 24.1% for AGIs $50k-75k, 49.3% for AGIs $75k-100k, 126.2% for AGIs $100k-200k, 2072.3% for AGIs over 200k)
Taxes paid: $7,243 (reported on 4.8% of returns)
59701:
$7,243
State:
$7,689
(% of AGI for various income ranges: 4.2% for AGIs below $25k, 10.7% for AGIs $25k-50k, 56.3% for AGIs $50k-75k, 95.1% for AGIs $75k-100k, 179.7% for AGIs $100k-200k, 965.4% for AGIs over 200k)
Earned income credit: $1,952 (reported on 15.3% of returns)
Here:
$1,952
State:
$2,035
(% of AGI for various income ranges: 73.3% for AGIs below $25k, 58.4% for AGIs $25k-50k, 1.5% for AGIs $50k-75k)
Percentage of individuals using paid preparers for their 2020 taxes: 94.9%
Here:
95%
State:
94%
(% for various income ranges: 94.1% for AGIs below $25k, 95.2% for AGIs $25k-50k, 96.0% for AGIs $50k-75k, 94.4% for AGIs $75k-100k, 95.5% for AGIs $100k-200k, 95.7% for AGIs over 200k)
Averages for the 2012 tax year for zip code 59701, filed in 2013:
Average Adjusted Gross Income (AGI) in 2012: $50,419 (Individual Income Tax Returns)
Here:
$50,419
State:
$53,401
Salary/wage: $39,823 (reported on 84.1% of returns)
Here:
$39,823
State:
$40,976
(% of AGI for various income ranges: 77.3% for AGIs below $25k, 75.4% for AGIs $25k-50k, 74.0% for AGIs $50k-75k, 75.8% for AGIs $75k-100k, 77.0% for AGIs $100k-200k, 28.5% for AGIs over 200k)
Taxable interest for individuals: $1,957 (reported on 35.5% of returns)
This zip code:
$1,957
Montana:
$1,689
(% of AGI for various income ranges: 1.4% for AGIs below $25k, 0.7% for AGIs $25k-50k, 0.8% for AGIs $50k-75k, 0.6% for AGIs $75k-100k, 0.7% for AGIs $100k-200k, 3.7% for AGIs over 200k)
Ordinary dividends: $5,233 (reported on 20.1% of returns)
Here:
$5,233
State:
$5,585
(% of AGI for various income ranges: 1.6% for AGIs below $25k, 1.0% for AGIs $25k-50k, 1.2% for AGIs $50k-75k, 1.3% for AGIs $75k-100k, 1.4% for AGIs $100k-200k, 5.3% for AGIs over 200k)
Net capital gain/loss in AGI: +$4,732 (reported on 15.4% of returns)
Here:
+$4,732
State:
+$14,401
(% of AGI for various income ranges: 0.2% for AGIs $25k-50k, 0.4% for AGIs $50k-75k, 0.8% for AGIs $75k-100k, 2.0% for AGIs $100k-200k, 3.9% for AGIs over 200k)
Profit/loss from business: +$9,535 (reported on 12.0% of returns)
Here:
+$9,535
State:
+$10,980
(% of AGI for various income ranges: 3.0% for AGIs below $25k, 1.9% for AGIs $25k-50k, 1.7% for AGIs $50k-75k, 1.6% for AGIs $75k-100k, 2.7% for AGIs $100k-200k, 2.6% for AGIs over 200k)
Taxable individual retirement arrangement distribution: $12,538 (reported on 10.4% of returns)
59701:
$12,538
Montana:
$13,434
(% of AGI for various income ranges: 3.1% for AGIs below $25k, 2.4% for AGIs $25k-50k, 2.4% for AGIs $50k-75k, 3.0% for AGIs $75k-100k, 2.7% for AGIs $100k-200k, 2.2% for AGIs over 200k)
Self-employment retirement plans: $17,650 (reported on 0.4% of returns)
59701:
$17,650
Montana:
$18,233
Total itemized deductions: $20,332 (19% of AGI, reported on 27.2% of returns)
Here:
$20,332
State:
$21,750
Here:
18.9% of AGI
State:
20.5% of AGI
(% of AGI for various income ranges: 7.6% for AGIs below $25k, 8.5% for AGIs $25k-50k, 10.9% for AGIs $50k-75k, 11.0% for AGIs $75k-100k, 14.0% for AGIs $100k-200k, 11.5% for AGIs over 200k)
Charity contributions: $3,105 (reported on 22.0% of returns)
Here:
$3,105
State:
$3,989
(% of AGI for various income ranges: 0.5% for AGIs below $25k, 0.8% for AGIs $25k-50k, 1.1% for AGIs $50k-75k, 1.2% for AGIs $75k-100k, 1.8% for AGIs $100k-200k, 2.0% for AGIs over 200k)
Taxes paid: $7,931 (reported on 27.0% of returns)
59701:
$7,931
State:
$7,640
(% of AGI for various income ranges: 1.1% for AGIs below $25k, 2.2% for AGIs $25k-50k, 3.4% for AGIs $50k-75k, 4.2% for AGIs $75k-100k, 5.9% for AGIs $100k-200k, 6.5% for AGIs over 200k)
Earned income credit: $2,007 (reported on 19.3% of returns)
Here:
$2,007
State:
$2,015
(% of AGI for various income ranges: 5.6% for AGIs below $25k, 1.0% for AGIs $25k-50k)
Percentage of individuals using paid preparers for their 2012 taxes: 50.1%
Here:
50%
State:
57%
(% for various income ranges: 41.1% for AGIs below $25k, 51.3% for AGIs $25k-50k, 58.9% for AGIs $50k-75k, 61.7% for AGIs $75k-100k, 62.9% for AGIs $100k-200k, 87.5% for AGIs over 200k)
Averages for the 2004 tax year for zip code 59701, filed in 2005:
Average Adjusted Gross Income (AGI) in 2004: $37,328 (Individual Income Tax Returns)
Here:
$37,328
State:
$37,845
Salary/wage: $31,803 (reported on 83.0% of returns)
Here:
$31,803
State:
$31,190
(% of AGI for various income ranges: 97.9% for AGIs below $10k, 73.0% for AGIs $10k-25k, 77.3% for AGIs $25k-50k, 79.2% for AGIs $50k-75k, 81.4% for AGIs $75k-100k, 48.7% for AGIs over 100k)
Taxable interest for individuals: $2,182 (reported on 49.1% of returns)
This zip code:
$2,182
Montana:
$1,879
(% of AGI for various income ranges: 7.9% for AGIs below $10k, 2.7% for AGIs $10k-25k, 1.9% for AGIs $25k-50k, 1.5% for AGIs $50k-75k, 1.0% for AGIs $75k-100k, 5.4% for AGIs over 100k)
Taxable dividends: $3,765 (reported on 26.0% of returns)
Here:
$3,765
State:
$3,070
(% of AGI for various income ranges: 4.8% for AGIs below $10k, 1.8% for AGIs $10k-25k, 1.4% for AGIs $25k-50k, 1.1% for AGIs $50k-75k, 1.1% for AGIs $75k-100k, 5.9% for AGIs over 100k)
Net capital gain/loss: +$2,494 (reported on 21.4% of returns)
Here:
+$2,494
State:
+$10,237
(% of AGI for various income ranges: -3.7% for AGIs below $10k, -0.2% for AGIs $10k-25k, 0.4% for AGIs $25k-50k, 0.7% for AGIs $50k-75k, 0.9% for AGIs $75k-100k, 4.5% for AGIs over 100k)
Profit/loss from business: +$7,054 (reported on 12.6% of returns)
Here:
+$7,054
State:
+$8,849
(% of AGI for various income ranges: 2.6% for AGIs below $10k, 2.3% for AGIs $10k-25k, 1.8% for AGIs $25k-50k, 1.4% for AGIs $50k-75k, 2.0% for AGIs $75k-100k, 3.9% for AGIs over 100k)
IRA payment deduction: $2,757 (reported on 2.8% of returns)
59701:
$2,757
Montana:
$2,958
(% of AGI for various income ranges: 0.3% for AGIs below $10k, 0.2% for AGIs $10k-25k, 0.4% for AGIs $25k-50k, 0.2% for AGIs $50k-75k, 0.2% for AGIs $75k-100k, 0.1% for AGIs over 100k)
Self-employed pension: $13,333 (reported on 0.6% of returns)
Here:
$13,333
Montana:
$13,795
(% of AGI for various income ranges: 0.1% for AGIs $10k-25k, 0.1% for AGIs $50k-75k, 0.2% for AGIs $75k-100k, 0.6% for AGIs over 100k)
Total itemized deductions: $15,802 (21% of AGI, reported on 28.5% of returns)
Here:
$15,802
State:
$17,258
Here:
21.0% of AGI
State:
23.1% of AGI
(% of AGI for various income ranges: 10.6% for AGIs below $10k, 9.1% for AGIs $10k-25k, 11.4% for AGIs $25k-50k, 12.1% for AGIs $50k-75k, 13.7% for AGIs $75k-100k, 13.3% for AGIs over 100k)
Charity contributions deductions: $2,340 (3% of AGI, reported on 25.6% of returns)
Here:
$2,340
State:
$2,921
Here:
3.0% of AGI
State:
3.7% of AGI
(% of AGI for various income ranges: 0.8% for AGIs below $10k, 0.9% for AGIs $10k-25k, 1.2% for AGIs $25k-50k, 1.3% for AGIs $50k-75k, 2.0% for AGIs $75k-100k, 2.4% for AGIs over 100k)
Total tax: $5,539 (reported on 71.3% of returns)
59701:
$5,539
State:
$5,485
(% of AGI for various income ranges: 2.2% for AGIs below $10k, 3.7% for AGIs $10k-25k, 6.6% for AGIs $25k-50k, 8.4% for AGIs $50k-75k, 10.4% for AGIs $75k-100k, 20.1% for AGIs over 100k)
Earned income credit: $1,524 (reported on 16.9% of returns)
Here:
$1,524
State:
$1,604
Percentage of individuals using paid preparers for their 2004 taxes: 60.1%
Here:
60%
State:
63%
(% for various income ranges: 51.4% for AGIs below $10k, 59.0% for AGIs $10k-25k, 64.3% for AGIs $25k-50k, 66.8% for AGIs $50k-75k, 61.4% for AGIs $75k-100k, 72.4% for AGIs over 100k)
Likely homosexual households (counted as self-reported same-sex unmarried-partner households)
Lesbian couples: 0.2% of all households
Gay men: 0.0% of all households
Household received Food Stamps/SNAP in the past 12 months: 1,781 Household did not receive Food Stamps/SNAP in the past 12 months: 13,428
Women who had a birth in the past 12 months: 260 (173 now married, 83 unmarried) Women who did not have a birth in the past 12 months: 7,105 (2,991 now married, 4,114 unmarried)
Housing units in zip code 59701 with a mortgage: 5,725 (538 second mortgage, 31 home equity loan, 376 both second mortgage and home equity loan) Houses without a mortgage: 185
Median monthly owner costs for units with a mortgage: $1,190 Median monthly owner costs for units without a mortgage: $477
Residents with income below the poverty level in 2022:
This zip code:
16.1%
Whole state:
12.1%
Residents with income below 50% of the poverty level in 2022:
This zip code:
7.3%
Whole state:
6.3%
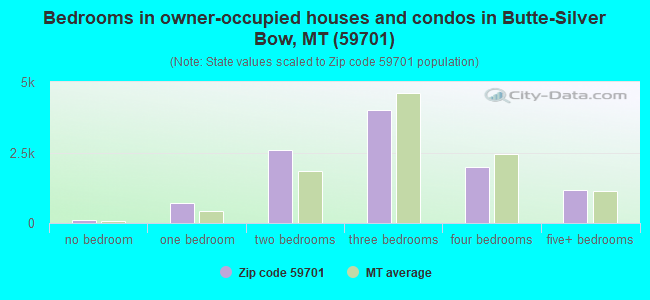
Median number of rooms in houses and condos:
Here:
6.2
State:
6.4
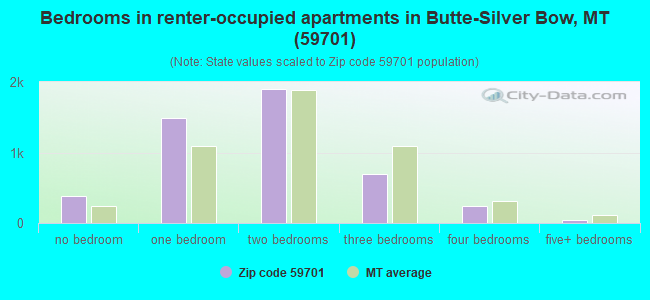
Median number of rooms in apartments:
Here:
4.1
State:
4.2
Notable locations in this zip code not listed on our city pages
Notable locations in zip code 59701: Lockhart Ranch (A), Lowland Campground (B), McAllister Ranch (C), Butte Country Club (D), Butte Gun Club (E), Rocker Water Supply (F), Tunnel Number 5 (G), Basin Creek Park (H), Homestake (I), Roosevelt Campground (J), Shamrock Campground (K), Suicide Cabin (L), Konda Ranch (M), Elk Park Fire Hall (N), Elk Park Campground (O), Finn Cabins (P), Four Corners (Q), Gillespie Ranch (R), Camp Castlerock (S), Highland View Golf Course (T). Display/hide their locations on the map
Churches in zip code 59701 include: Church of God of Prophecy (A), Holy Trinity Serbian Orthodox Church (B), Worldwide Church of God (C), Seventh Day Adventist Church (D), Salvation Army Church (E), United Pentecostal Church of Butte (F), Kingdom Hall of Jehovahs Witnesses (G), Holy Spirit Catholic Church (H), Butte Rescue Mission (I). Display/hide their locations on the map
Cemeteries: B'Nai Israel Cemetery (1), Mount Moriah Cemetery (2), Mountain View Cemetery (3), Saint Patrick Cemetery (4), Holy Cross Cemetery (5). Display/hide their locations on the map
Lakes and reservoirs: Ice Pond (A), Moulton Reservoir Number 2 (B), Upper Reservoir (C), Basin Creek Reservoir (D), B and B Fishpond (E), Columbia Gardens Water Supply (F), West Side Reservoir (G), Moulton Distribution Reservoir (H). Display/hide their locations on the map
Streams, rivers, and creeks: Basin Creek (A), Blacktail Creek (B), Bull Run Creek (C), Canada Creek (D), Sheep Creek (E), South Fork Boulder River (F), Standby Creek (G), Tanner Creek (H), Ruby Creek (I). Display/hide their locations on the map
Parks in zip code 59701 include: Stodden Park (1), Chester Steele Park (2), Thompson Park (3), Copper King National Mansion Historic Place (4), Marcus Daly Statue (5), Leonard Field (6), Alumni Field (7), Soccer/Intramural Field (8), Meaderville Historical Marker (9). Display/hide their locations on the map
Tourist attractions (not listed on the city page) : Copper King Mansion Bed & Breakfast (Museums; 219 West Granite Street) (1), Butte Silver Bow Arts Foundation (Museums; 321 West Broadway Street) (2), MAI Wah Society Inc (Museums; 17 West Mercury Street) (3), World Museum of Mining (155 Museum Way) (4), Renewable Technologies Inc (Cultural Attractions- Events- & Facilities; Metal Bank Building) (5), Bugni Investigation (Tours & Charters; 3460 Street Ann Street) (6). Display/hide their approximate locations on the map
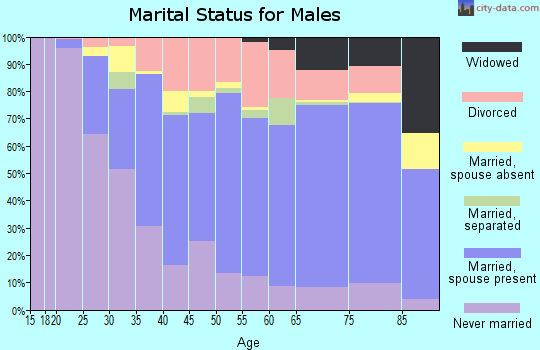
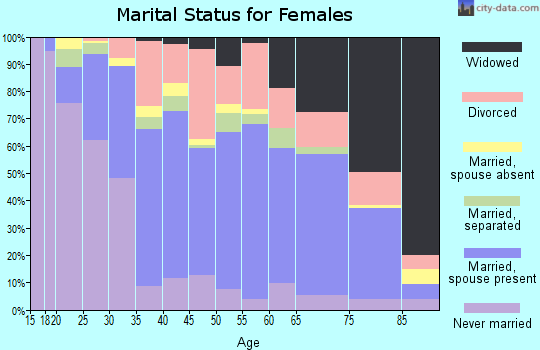
4,047 married couples with children.
2,079 single-parent households (1,037 men, 1,042 women).
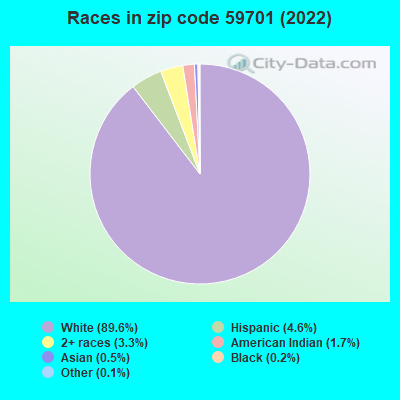
97.0% of residents of 59701 zip code speak English at home.
1.3% of residents speak Spanish at home (5% very well, 46% well, 49% not well).
0.8% of residents speak other Indo-European language at home (86% very well, 14% well).
0.2% of residents speak Asian or Pacific Island language at home (30% very well, 12% well, 58% not well).
0.8% of residents speak other language at home (30% very well, 70% well).
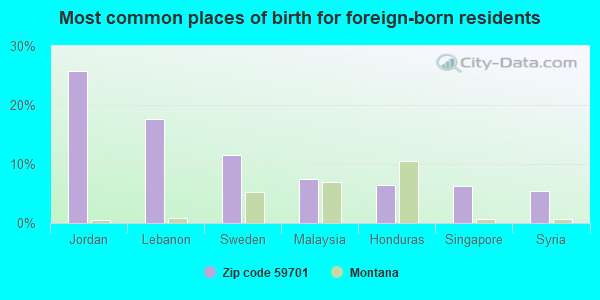
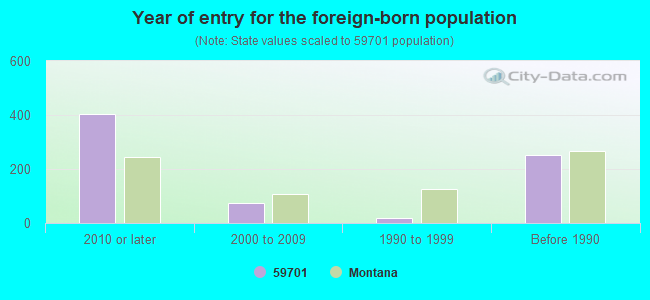
Foreign born population: 534 (1.5%) (49.7% of them are naturalized citizens)
Major facilities with environmental interests located in this zip code:
MONTANA RESOURCES (600 SHIELDS AVE. in BUTTE, MT)
AIR MINOR (AIRS/AFS) (Integrated Compliance Information System) - ICIS-08-1994-0271, FORMAL ENFORCEMENT ACTION, ICIS-08-2000-0029, ICIS-08-2003-0191, ENFORCEMENT/COMPLIANCE ACTIVITY (Integrated Compliance Information System) - ICIS-08-1994-0271, FORMAL ENFORCEMENT ACTION, ICIS-08-2000-0029, ICIS-08-2003-0191, ENFORCEMENT/COMPLIANCE ACTIVITY STATE MASTER (Montana air and water quality tracking) - MT-CEDARS-100021, AIR PROGRAM STATE MASTER (Montana air and water quality tracking) STATE MASTER (Montana air and water quality tracking) - MT-CEDARS-100051, UNDERGROUND STORAGE TANK PROGRAM COMPLIANCE ACTIVITY (Tracking inspections of insecticide, fungicide, and rodenticide, and toxic substances) CRITERIA AND HAZARDOUS AIR POLLUTANT INVENTORY (Inventory of air pollution sources) National Pollutant Discharge Elimination System MAJOR (Tracking pollutant discharge elimination systems) - permit (Resource Conservation and Recovery Act (tracking hazardous waste)) TRI REPORTER (Tracking of toxic chemicals releasing facilities) Business SIC classification: COPPER ORES; FERROALLOY ORES, EXCEPT VANADIUM Business NAICS classification: COPPER ORE AND NICKEL ORE MINING. Alternative names: BERKELY & CONTINENTAL PIT, BUTTE MONTANA RESOURCES, MONTANA RESOURCES (47-13549)
CANADIAN MONTANA GAS COMPANY LIMITED (40 EAST BROADWAY STREET in BUTTE, MT)
AIR MINOR (AIRS/AFS) (Integrated Compliance Information System) - ICIS-08-1997-0222, FORMAL ENFORCEMENT ACTION, ICIS-08-1991-0087, ICIS-08-1991-0088, ICIS-08-1998-0151, ENFORCEMENT/COMPLIANCE ACTIVITY (Integrated Compliance Information System) - ICIS-08-2003-0216, FORMAL ENFORCEMENT ACTION (Integrated Compliance Information System) - ICIS-08-2003-0216, FORMAL ENFORCEMENT ACTION COMPLIANCE ACTIVITY (Tracking inspections of insecticide, fungicide, and rodenticide, and toxic substances) CRITERIA AND HAZARDOUS AIR POLLUTANT INVENTORY (Inventory of air pollution sources) Conditionally Exempt Small Quantity Generators, less than 100 kg/month of hazardous waste (Resource Conservation and Recovery Act (tracking hazardous waste)) - notification Business SIC classification: CRUDE PETROLEUM AND NATURAL GAS; ELECTRIC SERVICES; NATURAL GAS TRANSMISSION; NATURAL GAS TRANSMISSION AND DISTRIBUTION Business NAICS classification: ELECTRIC POWER DISTRIBUTION. Organizations: NORTHWESTERN ENERGY LLC (CONTACT/OPERATOR)
, NORTHWESTERN CORP GENERAL OFFICES (CONTACT/OWNER)
Alternative names: BIG SANDY, MT POWER COMPANY (BUTTE), MONTANA POWER COMPANY, CUT BANK GAS, MONTANA POWER CO - GENERAL OFFICES, THE MONTANA POWER LLC GENERAL OFFICES, NORTHWESTERN ENERGY, NORTHWESTERN ENERGY - BIG SANDY #100, NORTHWESTERN (FORMERLY:MT POWER COMPANY (BUTTE))
GILMAN EXCAVATING INCORPORATED (3105 KOSSUTH in BUTTE, MT)
AIR SYNTHETIC MINOR (AIRS/AFS) STATE MASTER (Montana air and water quality tracking) - MT-CEDARS-100021, AIR PROGRAM STATE MASTER (Montana air and water quality tracking) - MT-CEDARS-100002, MINERAL EXPLORATION Business SIC classification: ASPHALT PAVING MIXTURES AND BLOCKS Alternative names: MADISON GILMAN EXCAVATING 25-N/A
BUTTE-SILVER BOW GOVERNMENT - METRO SEWER PLANT (800 CENTENNIAL AVENUE in BUTTE, MT)
ENFORCEMENT/COMPLIANCE ACTIVITY (Integrated Compliance Information System) - ICIS-08-1974-0001, FORMAL ENFORCEMENT ACTION, ICIS-08-1991-0121, (Integrated Compliance Information System) - ICIS-08-1974-0001, FORMAL ENFORCEMENT ACTION, ICIS-08-1991-0121, National Pollutant Discharge Elimination System MAJOR (Tracking pollutant discharge elimination systems) - permit National Pollutant Discharge Elimination System NON-MAJOR (Tracking pollutant discharge elimination systems) - permit National Pollutant Discharge Elimination System NON-MAJOR (Tracking pollutant discharge elimination systems) - permit Business SIC classification: SEWERAGE SYSTEMS Organizations: STEVENSVILLE, TOWN OF (CONTACT/OWNER)
, METRO SANIT. & STORM SEWER DIS (CONTACT/OWNER)
Alternative names: BUTTE-SILVER BOW, CITY&COUNTY, BUTTE SILVER BOW CITY COUNTY, BUTTE-SILVER BOW WASTE WATER TREANTMENT PLANT (WWTP), BUTTE-SILVER BOW WWTP, BUTTE/SILVER BOWM CITY&COUNTY, SILVER BOW METRO SD 1, STEVENSVILLE, TOWN OF
MONTANA POLE & TREATING PLANT (202 W GREENWOOD in BUTTE, MT)
SUPERFUND NPL (Superfund database) (Integrated Compliance Information System) - ICIS-08-1991-0065, FORMAL ENFORCEMENT ACTION (Resource Conservation and Recovery Act (tracking hazardous waste)) HAZARDOUS WASTE BIENNIAL REPORTER (Resource Conservation and Recovery Act (tracking hazardous waste)) Large Quantity Generators, more that 1000 kg of hazardous waste/month (Resource Conservation and Recovery Act (tracking hazardous waste)) - notification Business SIC classification: LOGGING; SAWMILLS AND PLANING MILLS, GENERAL; WOOD PRESERVING Business NAICS classification: SAWMILLS.; WOOD PRESERVATION. Organizations: MONTANA DEPT OF ENVIRONMENTAL QUALITY (CONTACT/OPERATOR)
, BURLINGTON NORTHERN RAILROAD (CONTACT/OWNER)
Alternative names: MONTANA POLE AND TREATING, MONTANA POLE AND TREATING PLANT 202, MONTANA POLE AND TREATING PLANT 220
BROOKS HANNA FORD (3547 HARRISON AVE in BUTTE, MT)
STATE MASTER (Montana air and water quality tracking) - MT-CEDARS-100051, UNDERGROUND STORAGE TANK PROGRAM (Resource Conservation and Recovery Act (tracking hazardous waste)) Organizations: PAT LYONS (CONTACT/OWNER)
, BROOKS HANNA FORD INC (CONTACT/OWNER)
, SHAMROCK MOTOR INC (CONTACT/OWNER)
BUTTE CREMATORIES INCORPORATED (2415 S MONTANA STREET in BUTTE, MT)
AIR MINOR (AIRS/AFS) STATE MASTER (Montana air and water quality tracking) - MT-CEDARS-100021, AIR PROGRAM CRITERIA AND HAZARDOUS AIR POLLUTANT INVENTORY (Inventory of air pollution sources) Business SIC classification: FUNERAL SERVICE AND CREMATORIES
ANACONDA COPPER CO BUTTE OPERATIONS (16 E GRANITE in BUTTE, MT)
ENFORCEMENT/COMPLIANCE ACTIVITY (Integrated Compliance Information System) (Integrated Compliance Information System) - ICIS-08-1975-0005, FORMAL ENFORCEMENT ACTION (Resource Conservation and Recovery Act (tracking hazardous waste)) Business SIC classification: COPPER ORES; SECONDARY SMELTING AND REFINING OF NONFERROUS METALS Organizations: MONTANA POWER COMPANY (CONTACT/OWNER)
Alternative names: ENTECH INC, NORTH AMERICAN RESOURCES
GILMAN EXCAVATING (88 CR 22 X 48 JAW #40915 in 1986 EL JAY 54" CONE #586, MT)
AIR MINOR (AIRS/AFS) STATE MASTER (Montana air and water quality tracking) - MT-CEDARS-100021, AIR PROGRAM Business SIC classification: CONSTRUCTION SAND AND GRAVEL; CONSTRUCTION MACHINERY AND EQUIPMENT Organizations: GILMAN EXCAVATING INC (CONTACT/APPLICANT)
Alternative names: GILMAN EXCAVATING - 777-2545
GILMAN EXCAVATING (80 CEDAR RAPIDS JAW #41152 in 1986 EL JAY CONE #886--15% OPA, MT)
AIR MINOR (AIRS/AFS) STATE MASTER (Montana air and water quality tracking) - MT-CEDARS-100021, AIR PROGRAM Business SIC classification: CONSTRUCTION SAND AND GRAVEL; CONSTRUCTION MACHINERY AND EQUIPMENT Organizations: GILMAN EXCAVATING INC (CONTACT/APPLICANT)
Alternative names: GILMAN EXCAVATING - 777-2544
DELTA AIR LINES - BUTTE (BERT MOONEY AIRPORT in BUTTE, MT)
STATE MASTER (Montana air and water quality tracking) - MT-CEDARS-100051, UNDERGROUND STORAGE TANK PROGRAM (Resource Conservation and Recovery Act (tracking hazardous waste)) Organizations: DELTA AIRLINES (CONTACT/OWNER)
Alternative names: DELTA AIRLINES
FICKLER OIL CO (1021 S MONTANA in BUTTE, MT)
STATE MASTER (Montana air and water quality tracking) - MT-CEDARS-100051, UNDERGROUND STORAGE TANK PROGRAM (Resource Conservation and Recovery Act (tracking hazardous waste)) Organizations: CHEVRON USA/ CHCGO MLWKE STPL & PCFC RR (CONTACT/OWNER)
, TODD FICKLER (CONTACT/OWNER)
Alternative names: FICKLER OIL S MONTANA
MAGNUM CONTAINER AND RECYCLING (NE1/4, SEC. 20, T3N, R7W in BUTTE, MT)
AIR MINOR (AIRS/AFS) STATE MASTER (Montana air and water quality tracking) - MT-CEDARS-100021, AIR PROGRAM Business SIC classification: INDUSTRIAL SUPPLIES
Housing units lacking complete plumbing facilities: 1.8% Housing units lacking complete kitchen facilities: 2.9%
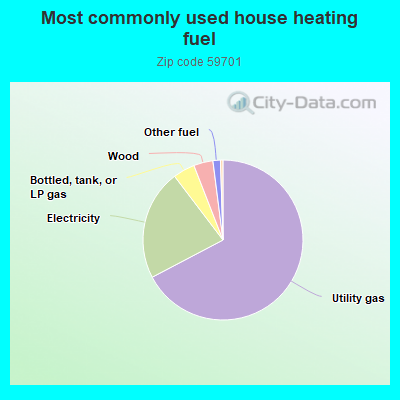
67.1%Utility gas
22.3%Electricity
4.4%Bottled, tank, or LP gas
3.9%Wood
1.5%Other fuel
0.5%Fuel oil, kerosene, etc.
Population in 1990: 33,096. Population change in the 1990s: +558 (+1.7%).
Place of birth for U.S.-born residents:
This state: 23,725
Northeast: 513
Midwest: 2,656
South: 1,782
West: 5,126
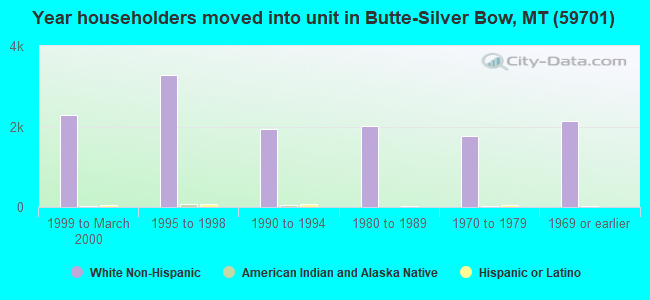
59% of the 59701 zip code residents lived in the same house 5 years ago. Out of people who lived in different houses, 55% lived in this county. Out of people who lived in different counties, 50% lived in Montana.
88% of the 59701 zip code residents lived in the same house 1 year ago. Out of people who lived in different houses, 49% moved from this county. Out of people who lived in different houses, 30% moved from different county within same state. Out of people who lived in different houses, 17% moved from different state. Out of people who lived in different houses, 0% moved from abroad.
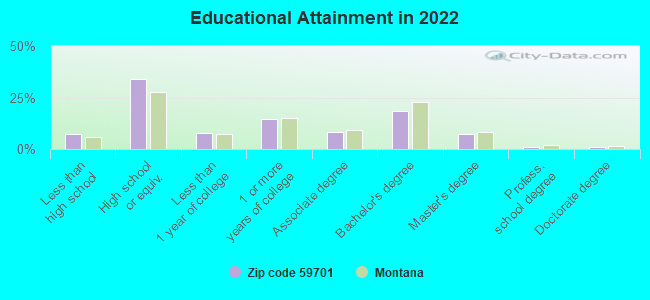
Private vs. public school enrollment:
Students in private schools in grades 1 to 8 (elementary and middle school): 278
Here:
9.2%
Montana:
15.3%
Students in private schools in grades 9 to 12 (high school): 150
Here:
10.2%
Montana:
12.2%
Students in private undergraduate colleges: 109
Here:
5.9%
Montana:
15.0%
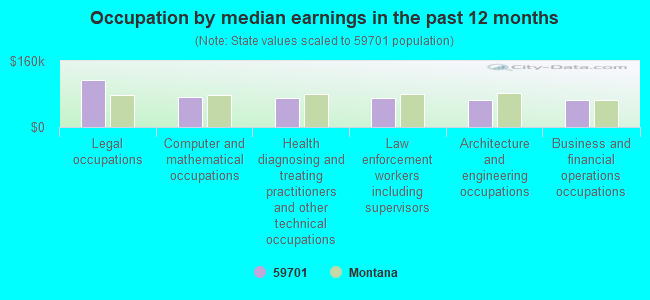
Occupation by median earnings in the past 12 months ($)
114,890Legal occupations
72,184Computer and mathematical occupations
70,463Health diagnosing and treating practitioners and other technical occupations
69,897Law enforcement workers including supervisors
66,194Architecture and engineering occupations
65,670Business and financial operations occupations
Companies with biggest federal contracts located in this zip code (BUTTE, MT):
MSE TECHNOLOGY APPLICATIONS, I (200 TECHNOLOGY WAY; small business) : $131,267,041 in 210 contractsfrom 1999 to 2006
Contracts for Miscellaneous Engines and Components, Environmental Sciences -- Basic Research (R&D), Other Defense -- Operational Systems Development (R&D), Specialized Ammunition Handling Servicing Equipment, and moreby Army, ENERGY, Department of, Air Force, Navy, and others Signed by year:2000: $15,282,340; 2001: $23,915,887; 2002: $20,227,653; 2003: $16,673,519; 2004: $12,934,209; 2005: $23,178,539; 2006: $10,482,894.
Biggest contracts:
$9,737,000 with Army for Miscellaneous Engines and Components. Signed on 2004-07-26. Completion date: 2009-12-30.
$9,381,112, same as above.Signed on 2005-03-30. Completion date: 2006-06-30.
$6,303,000 with ENERGY, Department of for Environmental Sciences -- Basic Research (R&D). Signed on 1999-12-15. Completion date: 2001-09-15.
$5,325,000, same as above.Signed on 2001-06-15. Completion date: 2004-09-15.
MONTANA POWER COMPANY INC (40 E BROADWAY ST; small business) : $11,349,034 in 123 contractsfrom 1999 to 2006
Contracts for Electric Services, Construction of Structures and Facilities -- Other Utilities by Air Force, Department of Veterans Affairs, Army Signed by year:2000: $2,752,490; 2001: $2,845,422; 2002: $850,318; 2003: $0; 2004: $945,585; 2005: $3,226,674; 2006: -$2,969.
Biggest contracts:
$252,044 with Air Force for Electric Services. Signed on 2005-09-06. Completion date: 2005-09-06.
$241,349, same as above.Signed on 2005-06-13. Completion date: 2005-06-13.
$232,185, same as above.Signed on 2005-03-03. Completion date: 2005-03-04.
$231,022, same as above.Signed on 2005-02-01. Completion date: 2005-02-02.
PIONEER TECHNICAL SERVICES, IN (63 1/2 WEST BROADWAY; small business) : $1,269,332 in 38 contractsfrom 2000 to 2006
Contracts for Other Environmental Services, Studies, and Analytical Support, Architect - Engineer Services (including landscaping, interior layout, and designing), Other Architect and Engineering Services by U.S. Army Corps of Engineers - civil program financing only, Army, Forest Service (disused code: now 12C2), Forest Service, and others Signed by year:2000: $138,892; 2001: $54,748; 2002: $315,332; 2003: $34,257; 2004: $193,845; 2005: $307,112; 2006: $225,146.
Biggest contracts:
$216,743 with U.S. Army Corps of Engineers - civil program financing only for Other Environmental Services, Studies, and Analytical Support. Signed on 2002-02-02. Completion date: 2002-10-24.
$117,451 with Army for Architect - Engineer Services (including landscaping, interior layout, and designing). Signed on 2006-05-11. Completion date: 2007-03-30.
$95,024, same as above.Signed on 2005-06-10. Completion date: 2005-11-30.
$92,495 with Army for Other Environmental Services, Studies, and Analytical Support. Signed on 2004-10-13. Completion date: 2005-03-31.
CENTER FOR INNOVATION, INC (305 WEST MERCURY, ROOM 303; small business) : $1,104,080 in 10 contractsfrom 2003 to 2006
Contracts for Other Research and Development -- Basic Research (R&D), Maintenance, Repair or Alteration of Real Property -- Fuel Storage Buildings by Army Signed by year:2000: $0; 2001: $0; 2002: $0; 2003: $219,040; 2004: $502,591; 2005: $486,511; 2006: -$104,062.
Biggest contracts:
$384,187 with Army for Other Research and Development -- Basic Research (R&D). Signed on 2004-08-27. Completion date: 2005-08-29.
$365,769, same as above.Signed on 2005-09-29. Completion date: 2005-08-29.
$120,742 with Army for Maintenance, Repair or Alteration of Real Property -- Fuel Storage Buildings. Taking place in NC. Signed on 2005-12-12. Completion date: 2004-12-31.
$119,074, same as above.Signed on 2003-12-12. Completion date: 2004-12-31.
SYNESIS7 (65 EAST BROADWAY, SUITE 30; small business) : $765,631 in 2 contractsin 2003
$765,631 with Navy for Other ADP and Telecommunications Services (includes data storage on tapes, compact disks, etc.). Signed on 2003-09-25. Completion date: 2004-11-30.
$0, same as above.Signed on 2003-09-25. Completion date: 2004-11-30.
FINLEN COMPLEX INC (100 EAST BROADWAY; small business) : $298,619 in 8 contractsfrom 1999 to 2002
Contracts for Lodging - Hotel/Motel, Lease or Rental of Facilities -- Office Buildings by Army, Public Buildings Service Signed by year:2000: $193,878; 2001: $2,211; 2002: $9,650; 2003: $0; 2004: $0; 2005: $0; 2006: $0.
Biggest contracts:
$92,880 with Army for Lodging - Hotel/Motel. Signed on 1999-10-06. Completion date: 2000-09-30.
$58,810, same as above.Signed on 2000-10-20. Completion date: 2000-12-31.
$53,068, same as above.Signed on 2000-07-13. Completion date: 2000-09-30.
$41,000 with Public Buildings Service for Lease or Rental of Facilities -- Office Buildings. Signed on 2000-03-15. Completion date: 2000-03-15.
TETRAGENICS COMPANY (130 NORTH MAIN ST) : $250,066 in 4 contractsfrom 2000 to 2003
$235,900 with U.S. Army Corps of Engineers - civil program financing only for Miscellaneous Communication Equipment. Taking place in TN. Signed on 2000-11-06. Completion date: 2001-05-01.
$12,000 with U.S. Army Corps of Engineers - civil program financing only for Miscellaneous Communication Equipment. Signed on 2002-08-22. Completion date: 2002-09-30.
$4,445, same as above.Signed on 2002-09-23. Completion date: 2002-10-31.
-$2,279, same as above.Signed on 2003-03-13. Completion date: 2002-09-30.
GOLD RUSH CASINO, INC (22 W GALENA; small business) : $177,454 in 4 contractsfrom 1999 to 2001
$74,831 with Army for Food Services. Signed on 1999-10-06. Completion date: 2000-09-30.
$40,654, same as above.Signed on 2000-10-20. Completion date: 2000-12-31.
$34,164, same as above.Signed on 2000-07-13. Completion date: 1997-10-01.
$27,805, same as above.Signed on 2001-01-04. Completion date: 2001-03-31.
PEAK (65 E BRAODWAY; small business) : $70,844 in 3 contractsin 2006
$27,096 with Air Force for Training/Curriculum Development. Signed on 2006-04-07. Completion date: 2006-04-21.
$25,198 with Air Force for Other Education and Training Services. Signed on 2006-01-25. Completion date: 2006-01-26.
$18,550 with U.S. Special Operations Command for Other Education and Training Services. Taking place in NC. Signed on 2006-01-30. Completion date: 2006-02-18.
TUCKER TRANSPORATION INC (445 CENTENNIAL AVE; small business)
$27,601 with Army for Passenger Motor Charter Service. Signed on 2002-12-06. Completion date: 2003-08-31.
Top industries in this zip code by the number of employees in 2005:
Health Care and Social Assistance: General Medical and Surgical Hospitals (500-999 employees: 1 establishment)
Utilities: Electric Power Distribution (250-499: 1, 100-249: 1, 20-49: 1)
Health Care and Social Assistance: Other Individual and Family Services (250-499: 1, 10-19: 3, 5-9: 1, 1-4: 2)
Health Care and Social Assistance: Offices of Physicians (except Mental Health Specialists) (100-249: 1, 50-99: 1, 20-49: 1, 10-19: 4, 5-9: 6, 1-4: 19)
Mining: Copper Ore and Nickel Ore Mining (250-499: 1)
Health Care and Social Assistance: Psychiatric and Substance Abuse Hospitals (250-499: 1)
People in group quarters in 2010:
286 people in college/university student housing
276 people in nursing facilities/skilled-nursing facilities
202 people in correctional residential facilities
64 people in local jails and other municipal confinement facilities
58 people in residential treatment centers for juveniles (non-correctional)
58 people in group homes intended for adults
17 people in emergency and transitional shelters (with sleeping facilities) for people experiencing homelessness
17 people in residential treatment centers for adults
10 people in group homes for juveniles (non-correctional)
10 people in other noninstitutional facilities
People in group quarters in 2000:
397 people in nursing homes
196 people in college dormitories (includes college quarters off campus)
195 people in halfway houses
72 people in other noninstitutional group quarters
68 people in local jails and other confinement facilities (including police lockups)
52 people in homes for abused, dependent, and neglected children
41 people in homes or halfway houses for drug/alcohol abuse
38 people in homes for the mentally retarded
18 people in other group homes
8 people in homes for the mentally ill
4 people in religious group quarters
3 people in schools, hospitals, or wards for the intellectually disabled
Fatal accident statistics in 2014:
Fatal accident count: 5
Vehicles involved in fatal accidents: 5
Fatal accidents caused by drunken drivers: 2
Fatalities: 5
Persons involved in fatal accidents: 7
Pedestrians involved in fatal accidents: 0
Fatal accident statistics in 2013:
Fatal accident count: 5
Vehicles involved in fatal accidents: 6
Fatal accidents caused by drunken drivers: 2
Fatalities: 6
Persons involved in fatal accidents: 16
Pedestrians involved in fatal accidents: 2
2002 - 2018 National Fire Incident Reporting System (NFIRS) incidents
Based on the data from the years 2002 - 2018 the average number of fires per year is 121. The highest number of reported fire incidents - 229 took place in 2012, and the least - 27 in 2010. The data has a rising trend.
When looking into fire subcategories, the most incidents belonged to: Outside Fires (51.7%), and Structure Fires (32.4%).
Fire incident types reported to NFIRS in Zip Code 59701
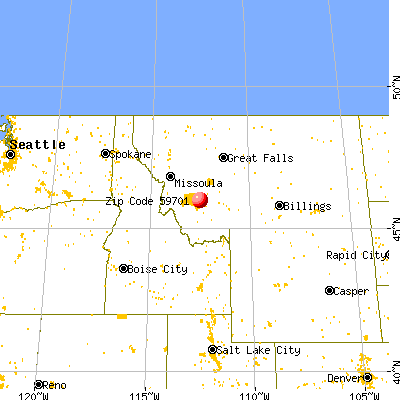


 Nearest zip codes: 59703, 59748, 59631, 59750, 59751, 59759.
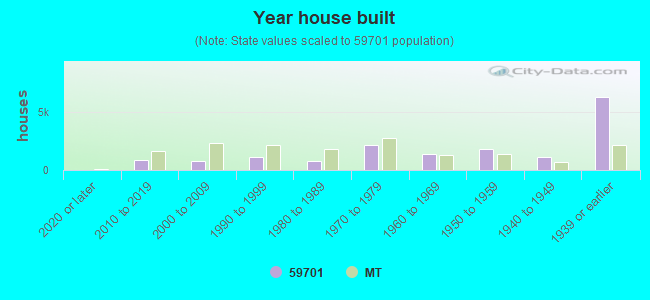


 Based on the data from the years 2002 - 2018 the average number of fires per year is 121. The highest number of reported fire incidents - 229 took place in 2012, and the least - 27 in 2010. The data has a rising trend.
 When looking into fire subcategories, the most incidents belonged to: Outside Fires (51.7%), and Structure Fires (32.4%).