Estimated zip code population in 2022: 63,769 Zip code population in 2010: 63,448 Zip code population in 2000: 60,373
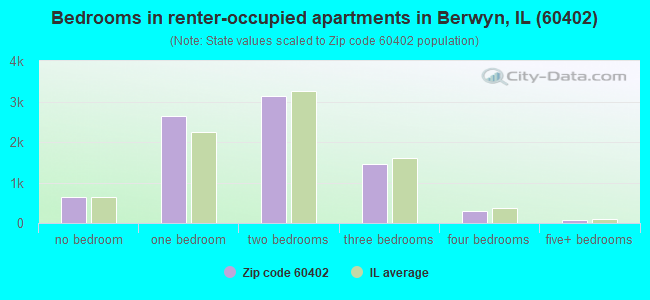
Houses and condos: 24,731 Renter-occupied apartments: 8,216
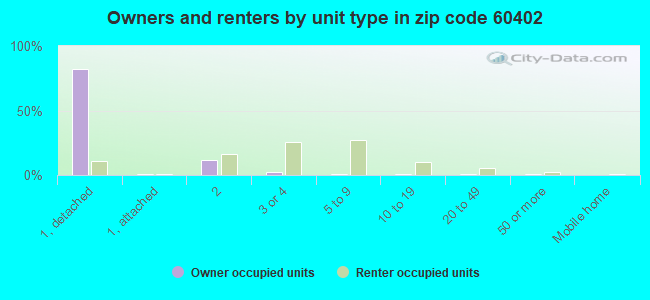
% of renters here:
36%
State:
33%
March 2022 cost of living index in zip code 60402: 100.6 (near average, U.S. average is 100)
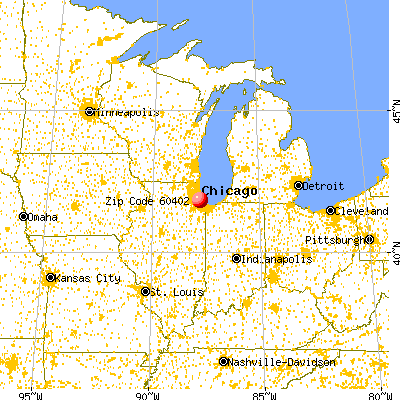
Land area: 5.3 sq. mi. Water area: 0.1 sq. mi.
Population density: 12,097 people per square mile
(very high).
OSM Map
General Map
Google Map
MSN Map
OSM Map
General Map
Google Map
MSN Map
OSM Map
General Map
Google Map
MSN Map
OSM Map
General Map
Google Map
MSN Map
Please wait while loading the map...
Real estate property taxes paid for housing units in 2022:
This zip code:
2.2% ($6,084)
Illinois:
2.0% ($4,912)
Median real estate property taxes paid for housing units with mortgages in 2022: $6,300 (2.2%) Median real estate property taxes paid for housing units with no mortgage in 2022: $5,633 (2.1%)
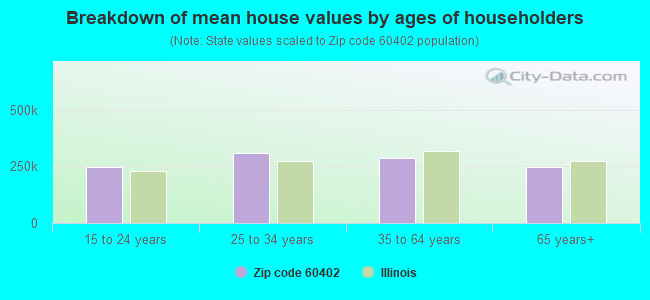
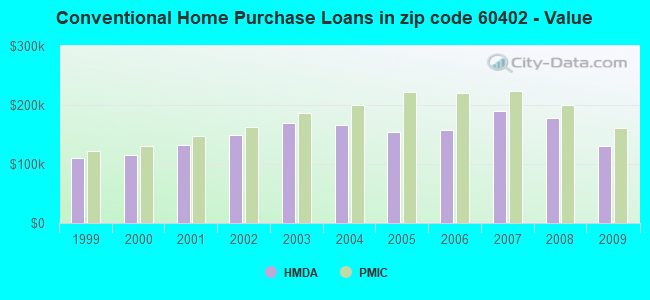
Estimated median house/condo value in 2022: $278,328
60402:
$278,328
Illinois:
$251,600
According to our research of Illinois and other state lists, there were 33 registered sex offenders living in 60402 zip code as of April 27, 2024. The ratio of all residents to sex offenders in zip code 60402 is 1,965 to 1. The ratio of registered sex offenders to all residents in this zip code is much lower than the state average.
Median resident age:
This zip code:
36.9 years
Illinois median age:
39.1 years
Average household size:
This zip code:
2.8 people
Illinois:
2.4 people
Averages for the 2020 tax year for zip code 60402, filed in 2021:
Average Adjusted Gross Income (AGI) in 2020: $49,548 (Individual Income Tax Returns)
Here:
$49,548
State:
$82,626
Salary/wage: $46,586 (reported on 85.6% of returns)
Here:
$46,586
State:
$66,640
(% of AGI for various income ranges: 1158.4% for AGIs below $25k, 3559.7% for AGIs $25k-50k, 6570.6% for AGIs $50k-75k, 9421.6% for AGIs $75k-100k, 17098.5% for AGIs $100k-200k, 49358.8% for AGIs over 200k)
Taxable interest for individuals: $1,135 (reported on 15.9% of returns)
This zip code:
$1,135
Illinois:
$2,376
(% of AGI for various income ranges: 10.1% for AGIs below $25k, 12.1% for AGIs $25k-50k, 21.7% for AGIs $50k-75k, 36.9% for AGIs $75k-100k, 60.6% for AGIs $100k-200k, 641.9% for AGIs over 200k)
Ordinary dividends: $3,435 (reported on 9.8% of returns)
Here:
$3,435
State:
$9,061
(% of AGI for various income ranges: 12.3% for AGIs below $25k, 14.9% for AGIs $25k-50k, 36.8% for AGIs $50k-75k, 82.1% for AGIs $75k-100k, 146.1% for AGIs $100k-200k, 1433.1% for AGIs over 200k)
Net capital gain/loss in AGI: +$7,417 (reported on 8.4% of returns)
Here:
+$7,417
State:
+$31,684
(% of AGI for various income ranges: 3.4% for AGIs below $25k, 12.7% for AGIs $25k-50k, 32.2% for AGIs $50k-75k, 80.8% for AGIs $75k-100k, 286.1% for AGIs $100k-200k, 5915.6% for AGIs over 200k)
Profit/loss from business: +$7,970 (reported on 16.1% of returns)
Here:
+$7,970
State:
+$12,175
(% of AGI for various income ranges: 169.2% for AGIs below $25k, 115.3% for AGIs $25k-50k, 126.4% for AGIs $50k-75k, 179.2% for AGIs $75k-100k, 282.9% for AGIs $100k-200k, 1614.4% for AGIs over 200k)
Taxable individual retirement arrangement distribution: $13,909 (reported on 4.8% of returns)
60402:
$13,909
Illinois:
$21,613
(% of AGI for various income ranges: 28.9% for AGIs below $25k, 36.3% for AGIs $25k-50k, 87.4% for AGIs $50k-75k, 157.4% for AGIs $75k-100k, 338.7% for AGIs $100k-200k, 1315.6% for AGIs over 200k)
Self-employed (Keogh) retirement plans: $15,125 (reported on 0.1% of returns)
60402:
$15,125
Illinois:
$30,962
(% of AGI for various income ranges: 32.2% for AGIs $100k-200k)
Total itemized deductions: $23,516 (reported on 6.8% of returns)
Here:
$23,516
State:
$34,948
(% of AGI for various income ranges: 31.5% for AGIs below $25k, 103.6% for AGIs $25k-50k, 296.7% for AGIs $50k-75k, 493.0% for AGIs $75k-100k, 652.0% for AGIs $100k-200k, 2871.9% for AGIs over 200k)
Charity contributions: $5,353 (reported on 4.6% of returns)
Here:
$5,353
State:
$13,122
(% of AGI for various income ranges: 1.7% for AGIs below $25k, 13.4% for AGIs $25k-50k, 38.6% for AGIs $50k-75k, 55.2% for AGIs $75k-100k, 127.9% for AGIs $100k-200k, 811.3% for AGIs over 200k)
Taxes paid: $8,234 (reported on 6.8% of returns)
60402:
$8,234
State:
$8,563
(% of AGI for various income ranges: 8.3% for AGIs below $25k, 36.7% for AGIs $25k-50k, 112.2% for AGIs $50k-75k, 187.0% for AGIs $75k-100k, 239.9% for AGIs $100k-200k, 560.6% for AGIs over 200k)
Earned income credit: $2,293 (reported on 19.5% of returns)
Here:
$2,293
State:
$2,311
(% of AGI for various income ranges: 103.4% for AGIs below $25k, 66.9% for AGIs $25k-50k, 0.9% for AGIs $50k-75k)
Percentage of individuals using paid preparers for their 2020 taxes: 91.2%
Here:
91%
State:
93%
(% for various income ranges: 90.2% for AGIs below $25k, 92.0% for AGIs $25k-50k, 91.8% for AGIs $50k-75k, 91.8% for AGIs $75k-100k, 91.2% for AGIs $100k-200k, 90.0% for AGIs over 200k)
Averages for the 2012 tax year for zip code 60402, filed in 2013:
Average Adjusted Gross Income (AGI) in 2012: $40,409 (Individual Income Tax Returns)
Here:
$40,409
State:
$68,058
Salary/wage: $38,824 (reported on 86.3% of returns)
Here:
$38,824
State:
$55,396
(% of AGI for various income ranges: 76.4% for AGIs below $25k, 87.2% for AGIs $25k-50k, 85.5% for AGIs $50k-75k, 84.5% for AGIs $75k-100k, 83.5% for AGIs $100k-200k, 57.8% for AGIs over 200k)
Taxable interest for individuals: $989 (reported on 21.0% of returns)
This zip code:
$989
Illinois:
$1,969
(% of AGI for various income ranges: 0.7% for AGIs below $25k, 0.4% for AGIs $25k-50k, 0.4% for AGIs $50k-75k, 0.5% for AGIs $75k-100k, 0.7% for AGIs $100k-200k, 0.8% for AGIs over 200k)
Ordinary dividends: $3,295 (reported on 11.3% of returns)
Here:
$3,295
State:
$7,786
(% of AGI for various income ranges: 1.0% for AGIs below $25k, 0.5% for AGIs $25k-50k, 0.8% for AGIs $50k-75k, 0.8% for AGIs $75k-100k, 1.2% for AGIs $100k-200k, 2.7% for AGIs over 200k)
Net capital gain/loss in AGI: +$1,477 (reported on 7.1% of returns)
Here:
+$1,477
State:
+$22,183
(% of AGI for various income ranges: 0.2% for AGIs $75k-100k, 0.3% for AGIs $100k-200k, 2.5% for AGIs over 200k)
Profit/loss from business: +$8,744 (reported on 13.6% of returns)
Here:
+$8,744
State:
+$12,903
(% of AGI for various income ranges: 10.6% for AGIs below $25k, 2.5% for AGIs $25k-50k, 1.6% for AGIs $50k-75k, 1.3% for AGIs $75k-100k, 1.3% for AGIs $100k-200k, 0.5% for AGIs over 200k)
Taxable individual retirement arrangement distribution: $11,777 (reported on 6.5% of returns)
60402:
$11,777
Illinois:
$17,929
(% of AGI for various income ranges: 2.2% for AGIs below $25k, 1.4% for AGIs $25k-50k, 1.7% for AGIs $50k-75k, 2.1% for AGIs $75k-100k, 2.2% for AGIs $100k-200k, 2.7% for AGIs over 200k)
Self-employment retirement plans: $15,600 (reported on 0.1% of returns)
60402:
$15,600
Illinois:
$24,666
Total itemized deductions: $18,258 (25% of AGI, reported on 28.0% of returns)
Here:
$18,258
State:
$26,433
Here:
25.2% of AGI
State:
19.2% of AGI
(% of AGI for various income ranges: 7.4% for AGIs below $25k, 10.2% for AGIs $25k-50k, 14.3% for AGIs $50k-75k, 15.2% for AGIs $75k-100k, 16.1% for AGIs $100k-200k, 12.4% for AGIs over 200k)
Charity contributions: $2,086 (reported on 21.0% of returns)
Here:
$2,086
State:
$4,525
(% of AGI for various income ranges: 0.4% for AGIs below $25k, 0.8% for AGIs $25k-50k, 1.2% for AGIs $50k-75k, 1.3% for AGIs $75k-100k, 1.6% for AGIs $100k-200k, 1.5% for AGIs over 200k)
Taxes paid: $7,767 (reported on 28.0% of returns)
60402:
$7,767
State:
$11,968
(% of AGI for various income ranges: 2.5% for AGIs below $25k, 3.9% for AGIs $25k-50k, 6.2% for AGIs $50k-75k, 6.7% for AGIs $75k-100k, 7.5% for AGIs $100k-200k, 5.7% for AGIs over 200k)
Earned income credit: $2,417 (reported on 23.9% of returns)
Here:
$2,417
State:
$2,349
(% of AGI for various income ranges: 7.8% for AGIs below $25k, 1.3% for AGIs $25k-50k)
Percentage of individuals using paid preparers for their 2012 taxes: 61.6%
Here:
62%
State:
57%
(% for various income ranges: 59.7% for AGIs below $25k, 62.5% for AGIs $25k-50k, 65.8% for AGIs $50k-75k, 62.4% for AGIs $75k-100k, 60.1% for AGIs $100k-200k, 66.7% for AGIs over 200k)
Averages for the 2004 tax year for zip code 60402, filed in 2005:
Average Adjusted Gross Income (AGI) in 2004: $35,986 (Individual Income Tax Returns)
Here:
$35,986
State:
$54,625
Salary/wage: $35,548 (reported on 85.6% of returns)
Here:
$35,548
State:
$46,811
(% of AGI for various income ranges: 97.2% for AGIs below $10k, 78.5% for AGIs $10k-25k, 88.2% for AGIs $25k-50k, 87.9% for AGIs $50k-75k, 86.8% for AGIs $75k-100k, 73.2% for AGIs over 100k)
Taxable interest for individuals: $1,535 (reported on 39.2% of returns)
This zip code:
$1,535
Illinois:
$2,101
(% of AGI for various income ranges: 6.2% for AGIs below $10k, 2.8% for AGIs $10k-25k, 1.3% for AGIs $25k-50k, 1.3% for AGIs $50k-75k, 1.2% for AGIs $75k-100k, 1.9% for AGIs over 100k)
Taxable dividends: $2,293 (reported on 17.4% of returns)
Here:
$2,293
State:
$4,306
(% of AGI for various income ranges: 3.0% for AGIs below $10k, 1.4% for AGIs $10k-25k, 0.8% for AGIs $25k-50k, 0.8% for AGIs $50k-75k, 1.0% for AGIs $75k-100k, 1.6% for AGIs over 100k)
Net capital gain/loss: +$4,697 (reported on 11.5% of returns)
Here:
+$4,697
State:
+$17,321
(% of AGI for various income ranges: -0.3% for AGIs below $10k, 0.3% for AGIs $10k-25k, 0.4% for AGIs $25k-50k, 0.8% for AGIs $50k-75k, 1.2% for AGIs $75k-100k, 6.3% for AGIs over 100k)
Profit/loss from business: +$7,418 (reported on 11.6% of returns)
Here:
+$7,418
State:
+$11,771
(% of AGI for various income ranges: 5.0% for AGIs below $10k, 6.1% for AGIs $10k-25k, 2.3% for AGIs $25k-50k, 1.3% for AGIs $50k-75k, 1.5% for AGIs $75k-100k, 1.8% for AGIs over 100k)
IRA payment deduction: $2,705 (reported on 1.9% of returns)
60402:
$2,705
Illinois:
$3,087
(% of AGI for various income ranges: 0.2% for AGIs below $10k, 0.1% for AGIs $10k-25k, 0.2% for AGIs $25k-50k, 0.1% for AGIs $50k-75k, 0.1% for AGIs $75k-100k, 0.1% for AGIs over 100k)
Self-employed pension: $8,088 (reported on 0.2% of returns)
Here:
$8,088
Illinois:
$16,965
Total itemized deductions: $16,099 (28% of AGI, reported on 34.1% of returns)
Here:
$16,099
State:
$20,239
Here:
27.7% of AGI
State:
19.5% of AGI
(% of AGI for various income ranges: 16.6% for AGIs below $10k, 11.6% for AGIs $10k-25k, 15.4% for AGIs $25k-50k, 17.7% for AGIs $50k-75k, 15.7% for AGIs $75k-100k, 13.5% for AGIs over 100k)
Charity contributions deductions: $1,835 (3% of AGI, reported on 28.6% of returns)
Here:
$1,835
State:
$3,719
Here:
3.0% of AGI
State:
3.4% of AGI
(% of AGI for various income ranges: 0.8% for AGIs below $10k, 0.7% for AGIs $10k-25k, 1.3% for AGIs $25k-50k, 1.7% for AGIs $50k-75k, 1.9% for AGIs $75k-100k, 1.8% for AGIs over 100k)
Total tax: $4,270 (reported on 69.6% of returns)
60402:
$4,270
State:
$9,882
(% of AGI for various income ranges: 3.7% for AGIs below $10k, 3.5% for AGIs $10k-25k, 6.0% for AGIs $25k-50k, 8.2% for AGIs $50k-75k, 10.2% for AGIs $75k-100k, 15.6% for AGIs over 100k)
Earned income credit: $1,793 (reported on 18.6% of returns)
Here:
$1,793
State:
$1,788
Percentage of individuals using paid preparers for their 2004 taxes: 63.5%
Here:
64%
State:
61%
(% for various income ranges: 57.2% for AGIs below $10k, 67.4% for AGIs $10k-25k, 64.4% for AGIs $25k-50k, 64.0% for AGIs $50k-75k, 58.9% for AGIs $75k-100k, 64.8% for AGIs over 100k)
Likely homosexual households (counted as self-reported same-sex unmarried-partner households)
Lesbian couples: 0.1% of all households
Gay men: 0.3% of all households
Household received Food Stamps/SNAP in the past 12 months: 3,706 Household did not receive Food Stamps/SNAP in the past 12 months: 19,335
Women who had a birth in the past 12 months: 660 (371 now married, 290 unmarried) Women who did not have a birth in the past 12 months: 14,290 (5,763 now married, 8,522 unmarried)
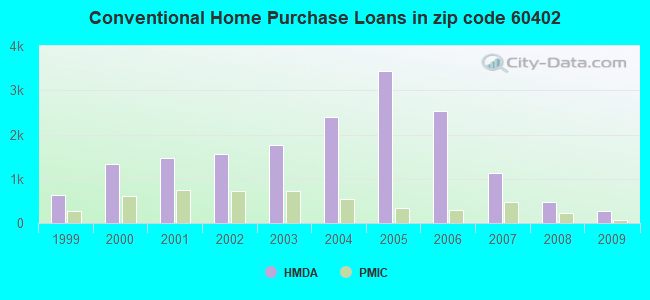
Housing units in zip code 60402 with a mortgage: 9,305 (552 second mortgage, 45 home equity loan, 365 both second mortgage and home equity loan) Houses without a mortgage: 335
Median monthly owner costs for units with a mortgage: $1,906 Median monthly owner costs for units without a mortgage: $849
Residents with income below the poverty level in 2022:
This zip code:
10.8%
Whole state:
11.9%
Residents with income below 50% of the poverty level in 2022:
This zip code:
7.5%
Whole state:
5.7%
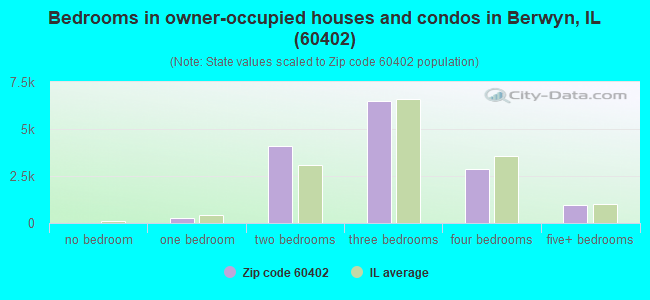
Median number of rooms in houses and condos:
Here:
6.2
State:
6.4
Median number of rooms in apartments:
Here:
4.1
State:
4.1
Notable locations in this zip code not listed on our city pages
Notable locations in zip code 60402: Forest View Fire Department (A), Stickney Fire Department (B), South Branch Berwyn Public Library (C), Stickney Village Hall (D), Berwyn Public Library (E), Berwyn City Hall (F), Forest View Village Hall (G), Berwyn Fire Department Station 3 City Hall (H), Berwyn Fire Department Station 2 North (I), Berwyn Fire Department Station 1 South (J). Display/hide their locations on the map
Churches in zip code 60402 include: Church of Christ (A), First Reformed Church of Berwyn (B), Berwyn United Lutheran Church (C), Concordia Lutheran Church (D), Ebenezer Christian Reformed Church (E), Emmanuel Bible Church (F), First Baptist Church (G), First Church of Christ Scientist (H), First Lutheran Church (I). Display/hide their locations on the map
7,958 married couples with children.
4,998 single-parent households (1,718 men, 3,280 women).
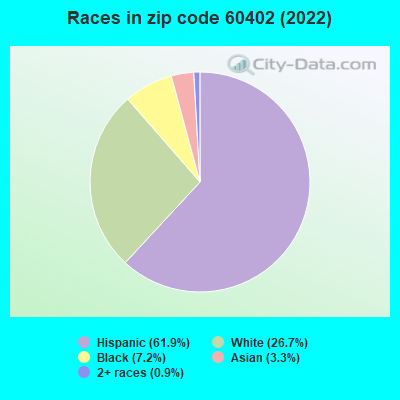
45.1% of residents of 60402 zip code speak English at home.
50.2% of residents speak Spanish at home (68% very well, 18% well, 12% not well, 1% not at all).
2.7% of residents speak other Indo-European language at home (65% very well, 22% well, 11% not well, 3% not at all).
2.2% of residents speak Asian or Pacific Island language at home (67% very well, 16% well, 15% not well, 1% not at all).
0.1% of residents speak other language at home (89% very well, 11% well).
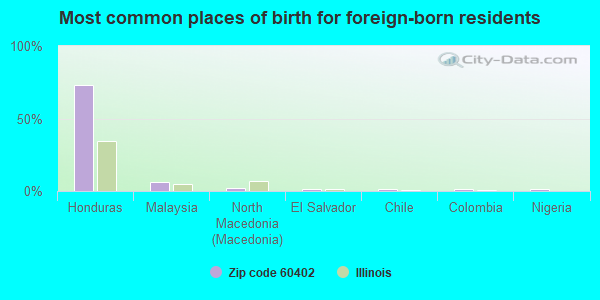
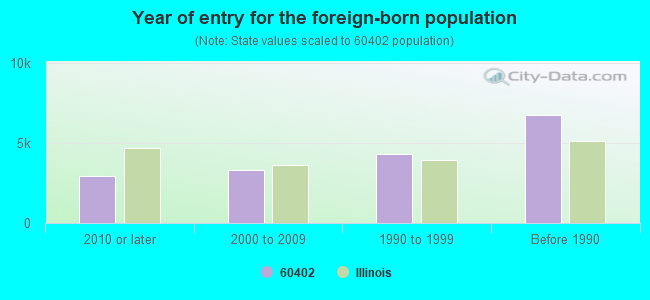
Foreign born population: 16,069 (25.2%) (51.0% of them are naturalized citizens)
Major facilities with environmental interests located in this zip code:
LAKE-RIVER TERMINALS INC (5005 S HARLEM in BERWYN, IL)
STATE MASTER (Illinois EPA Project) - HAZARDOUS WASTE PROGRAM, AIR PROGRAM, SOLID WASTE PROGRAM AIR MINOR (AIRS/AFS) ENFORCEMENT/COMPLIANCE ACTIVITY (Integrated Compliance Information System) COMPLIANCE ACTIVITY (Tracking inspections of insecticide, fungicide, and rodenticide, and toxic substances) CRITERIA AND HAZARDOUS AIR POLLUTANT INVENTORY (Inventory of air pollution sources) Large Quantity Generators, more that 1000 kg of hazardous waste/month (Resource Conservation and Recovery Act (tracking hazardous waste)) - notification TRANSPORTER (Resource Conservation and Recovery Act (tracking hazardous waste)) - notification HAZARDOUS WASTE BIENNIAL REPORTER (Resource Conservation and Recovery Act (tracking hazardous waste)) (Resource Conservation and Recovery Act (tracking hazardous waste)) Business SIC classification: SPECIAL WAREHOUSING AND STORAGE; NONCLASSIFIABLE ESTABLISHMENTS Organizations: KINARK CORP (CONTACT/OPERATOR)
, LAKE RIVER CORPORATION (CONTACT/OPERATOR)
Alternative names: LAKE RIVER CORP, LAKE RIVER CORP TERMINALS DIV, OLIN CORP
PETROLEUM FUEL & TERMINAL CO (4801 S HARLEM AVE in BERWYN, IL)
STATE MASTER (Illinois EPA Project) - HAZARDOUS WASTE PROGRAM, AIR PROGRAM, SOLID WASTE PROGRAM AIR MINOR (AIRS/AFS) OIL CONTROL (Facility Response Plan for oil discharge) CRITERIA AND HAZARDOUS AIR POLLUTANT INVENTORY (Inventory of air pollution sources) Large Quantity Generators, more that 1000 kg of hazardous waste/month (Resource Conservation and Recovery Act (tracking hazardous waste)) - notification Business SIC classification: SPECIAL WAREHOUSING AND STORAGE; PETROLEUM BULK STATIONS AND TERMINALS Organizations: APEX OIL COMPANY (CONTACT/GENERAL)
, PETROLEUM FUEL AND TERMINAL ST LOUIS MO (CONTACT/OWNER)
Alternative names: PETROLEUM FUEL & TERMINAL COMPANY FOREST VIEW, ILLINOIS TERMINAL
CHICAGO BLOCK CO INC (6400 W 41ST ST in FOREST VIEW, IL)
STATE MASTER (Illinois EPA Project) - AIR PROGRAM, SOLID WASTE PROGRAM AIR MINOR (AIRS/AFS) CRITERIA AND HAZARDOUS AIR POLLUTANT INVENTORY (Inventory of air pollution sources) National Pollutant Discharge Elimination System NON-MAJOR (Tracking pollutant discharge elimination systems) - permit Conditionally Exempt Small Quantity Generators, less than 100 kg/month of hazardous waste (Resource Conservation and Recovery Act (tracking hazardous waste)) - notification Business SIC classification: AUTOMATIC CONTROLS FOR REGULATING RESIDENTIAL AND COMMERCIAL ENVIRONMENTS AND APPLIANCES Business NAICS classification: AUTOMATIC ENVIRONMENTAL CONTROL MANUFACTURING FOR RESIDENTIAL, COMMERCIAL, AND APPLIANCE USE. Organizations: CHICAGO BLOCK COMPANY (CONTACT/OWNER)
, MATERIAL SERVICE COMPANY (CONTACT/OWNER)
Alternative names: CHICAGO BLOCK AND BRICK
COMMONWEALTH EDISON CO (6401 W. 43RD ST. in STICKNEY, IL)
STATE MASTER (Illinois EPA Project) - SOLID WASTE PROGRAM, HAZARDOUS WASTE PROGRAM, AIR PROGRAM AIR MINOR (AIRS/AFS) Large Quantity Generators, more that 1000 kg of hazardous waste/month (Resource Conservation and Recovery Act (tracking hazardous waste)) - notification Business SIC classification: NONCLASSIFIABLE ESTABLISHMENTS Alternative names: COM ED GENERAL WAREHOUSE, COM ED - STICKNEY
PHYSICIANS RECORD CO (3000 SOUTH RIDGELAND AVENUE in BERWYN, IL)
STATE MASTER (Illinois EPA Project) - HAZARDOUS WASTE PROGRAM, AIR PROGRAM, SOLID WASTE PROGRAM AIR MINOR (AIRS/AFS) CRITERIA AND HAZARDOUS AIR POLLUTANT INVENTORY (Inventory of air pollution sources) Conditionally Exempt Small Quantity Generators, less than 100 kg/month of hazardous waste (Resource Conservation and Recovery Act (tracking hazardous waste)) - notification Business SIC classification: BOOKS: PUBLISHING, OR PUBLISHING AND PRINTING Organizations: VOLLER JOHN W (CONTACT/OWNER)
MACNEAL MEMORIAL HOSPITAL (3249 OAK PARK AVENUE in BERWYN, IL)
STATE MASTER (Illinois EPA Project) - HAZARDOUS WASTE PROGRAM, AIR PROGRAM, SOLID WASTE PROGRAM AIR MINOR (AIRS/AFS) CRITERIA AND HAZARDOUS AIR POLLUTANT INVENTORY (Inventory of air pollution sources) Small Quantity Generators, between 100 kg and 1000 kg of hazardous waste/month (Resource Conservation and Recovery Act (tracking hazardous waste)) - notification Business SIC and NAICS classification: GENERAL MEDICAL AND SURGICAL HOSPITALS Organizations: MAC NEAL HOSPITAL (CONTACT/OWNER)
Alternative names: MAC NEAL HOSPITAL
CUSTOM CARS UNLIMITED (6641 OGDEN AVENUE in BERWYN, IL)
STATE MASTER (Illinois EPA Project) - HAZARDOUS WASTE PROGRAM, AIR PROGRAM AIR MINOR (AIRS/AFS) Small Quantity Generators, between 100 kg and 1000 kg of hazardous waste/month (Resource Conservation and Recovery Act (tracking hazardous waste)) - notification Business SIC classification: NONCLASSIFIABLE ESTABLISHMENTS
ABLE PRINTING SERVICE (6221 W ROOSEVELT RD in BERWYN, IL)
STATE MASTER (Illinois EPA Project) - HAZARDOUS WASTE PROGRAM Large Quantity Generators, more that 1000 kg of hazardous waste/month (Resource Conservation and Recovery Act (tracking hazardous waste)) - notification
ACE-CHICAGO GREAT DANE CORP (5050 WEST 39TH STREET in STICKNEY, IL)
STATE MASTER (Illinois EPA Project) - HAZARDOUS WASTE PROGRAM, SCRAP TIRE MANAGEMENT, AIR PROGRAM AIR MINOR (AIRS/AFS) CRITERIA AND HAZARDOUS AIR POLLUTANT INVENTORY (Inventory of air pollution sources) Business SIC classification: NONCLASSIFIABLE ESTABLISHMENTS Alternative names: TRANSPORT FINISHES
AMPERE ELECTRIC CO (4615 S HARLEM AVE in FORESTVIEW, IL)
STATE MASTER (Illinois EPA Project) - SOLID WASTE PROGRAM (Resource Conservation and Recovery Act (tracking hazardous waste)) Organizations: RAPID ELECTRIC SUPPLY & SERVICE (CONTACT/OWNER)
PARKWYN FUNERAL HOME (6901 ROOSEVELT RD in BERWYN, IL)
STATE MASTER (Illinois EPA Project) - AIR PROGRAM AIR MINOR (AIRS/AFS) CRITERIA AND HAZARDOUS AIR POLLUTANT INVENTORY (Inventory of air pollution sources) Business SIC classification: FUNERAL SERVICE AND CREMATORIES
MOBIL OIL CORP (6701-09 WEST CERMAK in BERWYN, IL)
STATE MASTER (Illinois EPA Project) - HAZARDOUS WASTE PROGRAM, AIR PROGRAM AIR MINOR (AIRS/AFS) CRITERIA AND HAZARDOUS AIR POLLUTANT INVENTORY (Inventory of air pollution sources) Business SIC classification: GASOLINE SERVICE STATIONS
JOSEPH NOSEK & SONS (6731 16TH ST in BERWYN, IL)
STATE MASTER (Illinois EPA Project) - HAZARDOUS WASTE PROGRAM Large Quantity Generators, more that 1000 kg of hazardous waste/month (Resource Conservation and Recovery Act (tracking hazardous waste)) - notification Organizations: NOSEK JOSEPH (CONTACT/OWNER)
Alternative names: NOSEK JOSEPH AND SONS
Housing units lacking complete plumbing facilities: 1.3% Housing units lacking complete kitchen facilities: 1.9%
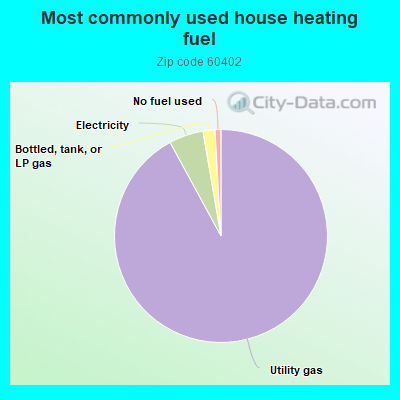
91.9%Utility gas
5.2%Electricity
1.8%Bottled, tank, or LP gas
0.9%No fuel used
Population in 1990: 51,541. Population change in the 1990s: +8,832 (+17.1%).
Place of birth for U.S.-born residents:
This state: 40,835
Northeast: 817
Midwest: 2,187
South: 1,347
West: 963
59% of the 60402 zip code residents lived in the same house 5 years ago. Out of people who lived in different houses, 90% lived in this county. Out of people who lived in different counties, 50% lived in Illinois.
93% of the 60402 zip code residents lived in the same house 1 year ago. Out of people who lived in different houses, 83% moved from this county. Out of people who lived in different houses, 6% moved from different county within same state. Out of people who lived in different houses, 6% moved from different state. Out of people who lived in different houses, 2% moved from abroad.
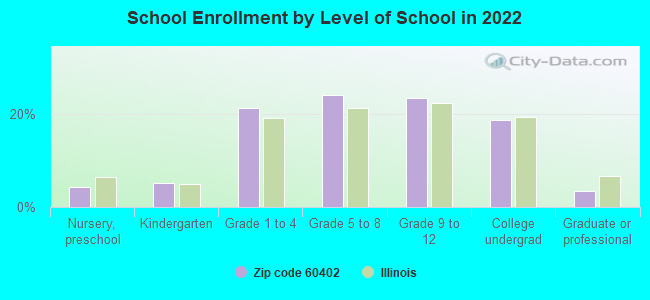
Private vs. public school enrollment:
Students in private schools in grades 1 to 8 (elementary and middle school): 1,167
Here:
16.0%
Illinois:
13.3%
Students in private schools in grades 9 to 12 (high school): 295
Here:
7.8%
Illinois:
9.9%
Students in private undergraduate colleges: 889
Here:
29.6%
Illinois:
27.4%
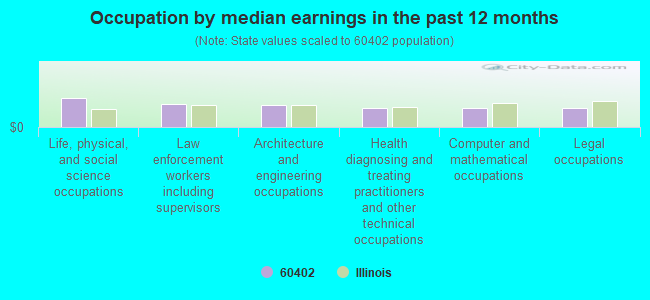
Occupation by median earnings in the past 12 months ($)
100,093Life, physical, and social science occupations
78,155Law enforcement workers including supervisors
75,059Architecture and engineering occupations
66,341Health diagnosing and treating practitioners and other technical occupations
64,857Computer and mathematical occupations
64,765Legal occupations
Top industries in this zip code by the number of employees in 2005:
Health Care and Social Assistance: General Medical and Surgical Hospitals (over 1000 employees: 1 establishment)
2002 - 2018 National Fire Incident Reporting System (NFIRS) incidents
According to the data from the years 2002 - 2018 the average number of fires per year is 216. The highest number of fires - 278 took place in 2004, and the least - 167 in 2016. The data has an increasing trend.
When looking into fire subcategories, the most reports belonged to: Structure Fires (52.3%), and Outside Fires (22.8%).
Fire incident types reported to NFIRS in Zip Code 60402


 Nearest zip codes: 60546, 60804, 60304, 60534, 60130, 60141.
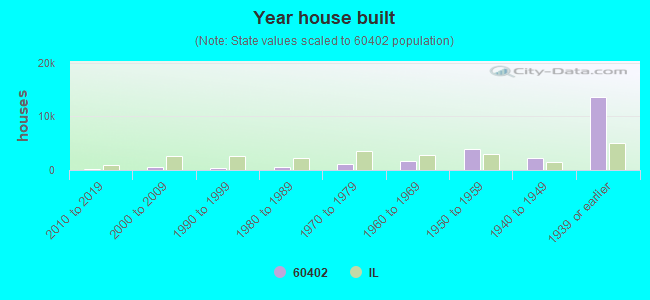


 According to the data from the years 2002 - 2018 the average number of fires per year is 216. The highest number of fires - 278 took place in 2004, and the least - 167 in 2016. The data has an increasing trend.
 When looking into fire subcategories, the most reports belonged to: Structure Fires (52.3%), and Outside Fires (22.8%).