Estimated zip code population in 2022: 1,720 Zip code population in 2010: 2,292 Zip code population in 2000: 3,439
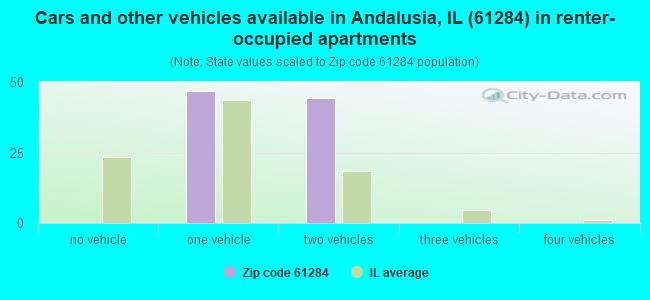
Houses and condos: 819 Renter-occupied apartments: 93
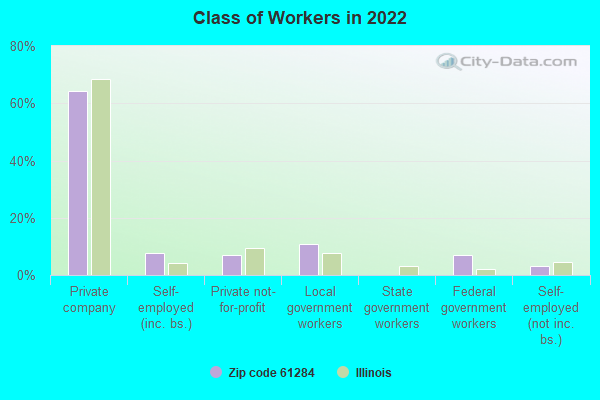
% of renters here:
12%
State:
33%
March 2022 cost of living index in zip code 61284: 84.9 (less than average, U.S. average is 100)
Land area: 45.1 sq. mi. Water area: 0.8 sq. mi.
Population density: 38 people per square mile
(very low).
OSM Map
General Map
Google Map
MSN Map
OSM Map
General Map
Google Map
MSN Map
OSM Map
General Map
Google Map
MSN Map
OSM Map
General Map
Google Map
MSN Map
Please wait while loading the map...
Real estate property taxes paid for housing units in 2022:
This zip code:
1.8% ($4,355)
Illinois:
2.0% ($4,912)
Median real estate property taxes paid for housing units with mortgages in 2022: $4,624 (1.8%) Median real estate property taxes paid for housing units with no mortgage in 2022: $3,832 (1.8%)
Business Search- 14 Million verified businesses
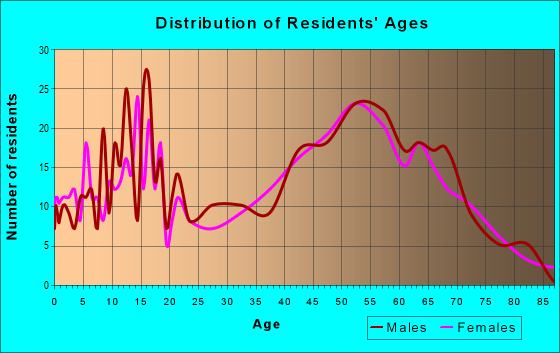
Males: 819
(47.6%)
Females: 901
(52.4%)
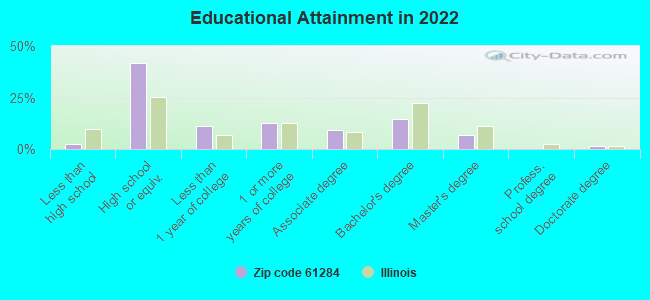
For population 25 years and over in 61284:
High school or higher: 97.3%
Bachelor's degree or higher: 22.8%
Graduate or professional degree: 8.0%
Mean travel time to work (commute): 21.4 minutes
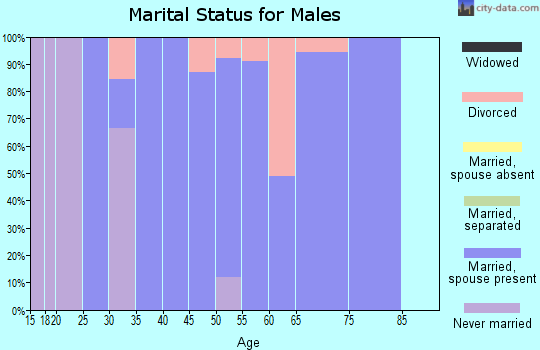
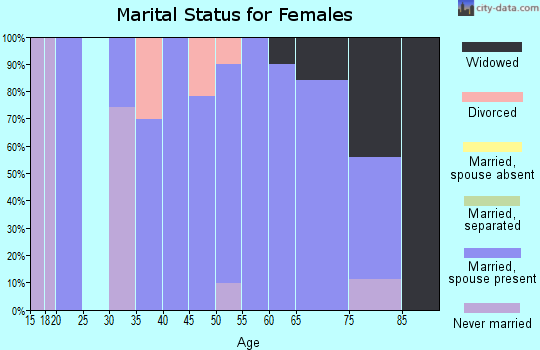
For population 15 years and over in 61284:
Never married: 16.9%
Now married: 67.5%
Separated: 0.0%
Widowed: 10.9%
Divorced: 4.7%
Zip code 61284 compared to state average:
Unemployed percentage significantly below state average.
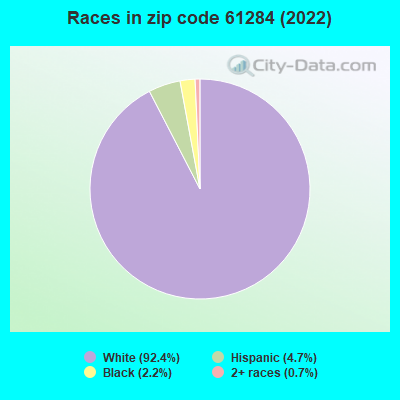
Black race population percentage significantly below state average.
Hispanic race population percentage significantly below state average.
Median age significantly above state average.
Foreign-born population percentage significantly below state average.
Renting percentage significantly below state average.
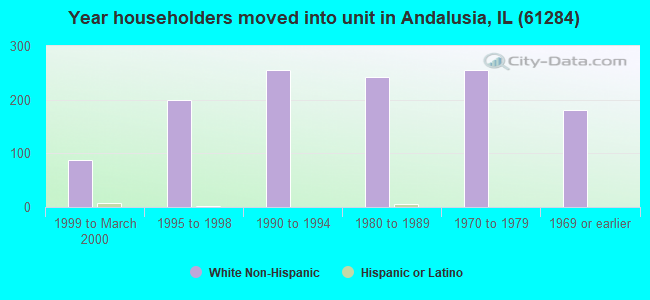
Length of stay since moving in significantly above state average.
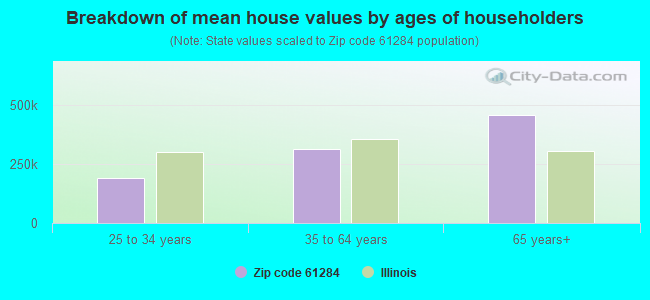
Estimated median house/condo value in 2022: $240,972
61284:
$240,972
Illinois:
$251,600
According to our research of Illinois and other state lists, there were 2 registered sex offenders living in 61284 zip code as of April 26, 2024. The ratio of all residents to sex offenders in zip code 61284 is 1,128 to 1. The ratio of registered sex offenders to all residents in this zip code is lower than the state average.
Median resident age:
This zip code:
60.1 years
Illinois median age:
39.1 years
Average household size:
This zip code:
2.1 people
Illinois:
2.4 people
Averages for the 2020 tax year for zip code 61284, filed in 2021:
Average Adjusted Gross Income (AGI) in 2020: $103,467 (Individual Income Tax Returns)
Here:
$103,467
State:
$82,626
Salary/wage: $72,281 (reported on 75.8% of returns)
Here:
$72,281
State:
$66,640
(% of AGI for various income ranges: 1006.7% for AGIs below $25k, 3091.3% for AGIs $25k-50k, 5287.9% for AGIs $50k-75k, 8824.4% for AGIs $75k-100k, 14547.0% for AGIs $100k-200k, 49626.7% for AGIs over 200k)
Taxable interest for individuals: $1,387 (reported on 50.0% of returns)
This zip code:
$1,387
Illinois:
$2,376
(% of AGI for various income ranges: 33.9% for AGIs below $25k, 66.7% for AGIs $25k-50k, 62.1% for AGIs $50k-75k, 157.8% for AGIs $75k-100k, 124.0% for AGIs $100k-200k, 646.7% for AGIs over 200k)
Ordinary dividends: $4,533 (reported on 27.5% of returns)
Here:
$4,533
State:
$9,061
(% of AGI for various income ranges: 39.4% for AGIs below $25k, 68.7% for AGIs $25k-50k, 107.9% for AGIs $50k-75k, 134.4% for AGIs $75k-100k, 229.0% for AGIs $100k-200k, 1973.3% for AGIs over 200k)
Net capital gain/loss in AGI: +$10,111 (reported on 23.3% of returns)
Here:
+$10,111
State:
+$31,684
(% of AGI for various income ranges: 23.9% for AGIs below $25k, 8.7% for AGIs $25k-50k, 147.1% for AGIs $50k-75k, 231.1% for AGIs $75k-100k, 252.5% for AGIs $100k-200k, 6186.7% for AGIs over 200k)
Profit/loss from business: +$11,175 (reported on 13.3% of returns)
Here:
+$11,175
State:
+$12,175
(% of AGI for various income ranges: 81.1% for AGIs below $25k, 128.7% for AGIs $25k-50k, 230.0% for AGIs $50k-75k, 276.7% for AGIs $75k-100k, 439.0% for AGIs $100k-200k)
Taxable individual retirement arrangement distribution: $16,911 (reported on 15.8% of returns)
61284:
$16,911
Illinois:
$21,613
(% of AGI for various income ranges: 128.9% for AGIs below $25k, 250.7% for AGIs $25k-50k, 236.4% for AGIs $50k-75k, 495.6% for AGIs $75k-100k, 914.0% for AGIs $100k-200k)
Total itemized deductions: $27,760 (reported on 4.2% of returns)
Here:
$27,760
State:
$34,948
(% of AGI for various income ranges: 290.7% for AGIs $25k-50k, 476.0% for AGIs $100k-200k)
Charity contributions: $8,267 (reported on 2.5% of returns)
Here:
$8,267
State:
$13,122
(% of AGI for various income ranges: 124.0% for AGIs $100k-200k)
Taxes paid: $8,960 (reported on 4.2% of returns)
61284:
$8,960
State:
$8,563
(% of AGI for various income ranges: 83.3% for AGIs $25k-50k, 161.5% for AGIs $100k-200k)
Earned income credit: $1,962 (reported on 6.7% of returns)
Here:
$1,962
State:
$2,311
(% of AGI for various income ranges: 45.6% for AGIs below $25k, 50.0% for AGIs $25k-50k)
Percentage of individuals using paid preparers for their 2020 taxes: 95.8%
Here:
96%
State:
93%
(% for various income ranges: 96.3% for AGIs below $25k, 95.5% for AGIs $25k-50k, 100.0% for AGIs $50k-75k, 100.0% for AGIs $75k-100k, 93.5% for AGIs $100k-200k, 85.7% for AGIs over 200k)
Averages for the 2012 tax year for zip code 61284, filed in 2013:
Average Adjusted Gross Income (AGI) in 2012: $72,056 (Individual Income Tax Returns)
Here:
$72,056
State:
$68,058
Salary/wage: $57,860 (reported on 80.5% of returns)
Here:
$57,860
State:
$55,396
(% of AGI for various income ranges: 68.5% for AGIs below $25k, 69.2% for AGIs $25k-50k, 64.1% for AGIs $50k-75k, 71.3% for AGIs $75k-100k, 75.3% for AGIs $100k-200k, 37.0% for AGIs over 200k)
Taxable interest for individuals: $1,209 (reported on 56.1% of returns)
This zip code:
$1,209
Illinois:
$1,969
(% of AGI for various income ranges: 2.4% for AGIs below $25k, 1.1% for AGIs $25k-50k, 0.6% for AGIs $50k-75k, 0.8% for AGIs $75k-100k, 1.0% for AGIs $100k-200k, 0.8% for AGIs over 200k)
Ordinary dividends: $4,709 (reported on 28.5% of returns)
Here:
$4,709
State:
$7,786
(% of AGI for various income ranges: 2.4% for AGIs below $25k, 0.9% for AGIs $25k-50k, 1.7% for AGIs $50k-75k, 0.7% for AGIs $75k-100k, 1.1% for AGIs $100k-200k, 4.7% for AGIs over 200k)
Net capital gain/loss in AGI: +$5,269 (reported on 21.1% of returns)
Here:
+$5,269
State:
+$22,183
(% of AGI for various income ranges: 0.1% for AGIs $50k-75k, 0.4% for AGIs $75k-100k, 0.6% for AGIs $100k-200k, 6.9% for AGIs over 200k)
Profit/loss from business: +$7,012 (reported on 13.8% of returns)
Here:
+$7,012
State:
+$12,903
(% of AGI for various income ranges: 2.8% for AGIs below $25k, 2.9% for AGIs $25k-50k, 0.3% for AGIs $50k-75k, 0.9% for AGIs $75k-100k, 2.1% for AGIs $100k-200k)
Taxable individual retirement arrangement distribution: $13,000 (reported on 13.8% of returns)
61284:
$13,000
Illinois:
$17,929
(% of AGI for various income ranges: 3.9% for AGIs below $25k, 2.5% for AGIs $25k-50k, 2.7% for AGIs $50k-75k, 2.9% for AGIs $75k-100k, 3.4% for AGIs $100k-200k)
Total itemized deductions: $19,689 (17% of AGI, reported on 37.4% of returns)
Here:
$19,689
State:
$26,433
Here:
17.3% of AGI
State:
19.2% of AGI
(% of AGI for various income ranges: 13.1% for AGIs below $25k, 6.3% for AGIs $25k-50k, 9.6% for AGIs $50k-75k, 10.3% for AGIs $75k-100k, 12.3% for AGIs $100k-200k, 8.0% for AGIs over 200k)
Charity contributions: $3,421 (reported on 27.6% of returns)
Here:
$3,421
State:
$4,525
(% of AGI for various income ranges: 0.6% for AGIs below $25k, 0.5% for AGIs $25k-50k, 0.9% for AGIs $50k-75k, 1.1% for AGIs $75k-100k, 2.0% for AGIs $100k-200k, 1.1% for AGIs over 200k)
Taxes paid: $8,709 (reported on 37.4% of returns)
61284:
$8,709
State:
$11,968
(% of AGI for various income ranges: 2.1% for AGIs below $25k, 2.1% for AGIs $25k-50k, 3.6% for AGIs $50k-75k, 4.2% for AGIs $75k-100k, 5.7% for AGIs $100k-200k, 5.0% for AGIs over 200k)
Earned income credit: $1,750 (reported on 6.5% of returns)
Here:
$1,750
State:
$2,349
(% of AGI for various income ranges: 2.5% for AGIs below $25k, 0.5% for AGIs $25k-50k)
Percentage of individuals using paid preparers for their 2012 taxes: 68.3%
Here:
68%
State:
57%
(% for various income ranges: 60.0% for AGIs below $25k, 68.2% for AGIs $25k-50k, 80.0% for AGIs $50k-75k, 66.7% for AGIs $75k-100k, 70.8% for AGIs $100k-200k, 75.0% for AGIs over 200k)
Averages for the 2004 tax year for zip code 61284, filed in 2005:
Average Adjusted Gross Income (AGI) in 2004: $54,079 (Individual Income Tax Returns)
Here:
$54,079
State:
$54,625
Salary/wage: $48,797 (reported on 84.9% of returns)
Here:
$48,797
State:
$46,811
(% of AGI for various income ranges: 177.3% for AGIs below $10k, 67.3% for AGIs $10k-25k, 67.0% for AGIs $25k-50k, 74.8% for AGIs $50k-75k, 86.1% for AGIs $75k-100k, 74.9% for AGIs over 100k)
Taxable interest for individuals: $1,696 (reported on 65.9% of returns)
This zip code:
$1,696
Illinois:
$2,101
(% of AGI for various income ranges: 16.5% for AGIs below $10k, 4.7% for AGIs $10k-25k, 2.4% for AGIs $25k-50k, 1.5% for AGIs $50k-75k, 1.5% for AGIs $75k-100k, 2.0% for AGIs over 100k)
Taxable dividends: $2,621 (reported on 34.2% of returns)
Here:
$2,621
State:
$4,306
(% of AGI for various income ranges: 4.7% for AGIs below $10k, 2.8% for AGIs $10k-25k, 1.3% for AGIs $25k-50k, 0.8% for AGIs $50k-75k, 0.8% for AGIs $75k-100k, 2.8% for AGIs over 100k)
Net capital gain/loss: +$5,135 (reported on 24.4% of returns)
Here:
+$5,135
State:
+$17,321
(% of AGI for various income ranges: 4.7% for AGIs below $10k, 0.9% for AGIs $10k-25k, 1.6% for AGIs $25k-50k, 1.5% for AGIs $50k-75k, 1.0% for AGIs $75k-100k, 4.3% for AGIs over 100k)
Profit/loss from business: +$8,427 (reported on 13.1% of returns)
Here:
+$8,427
State:
+$11,771
(% of AGI for various income ranges: -1.8% for AGIs below $10k, 0.1% for AGIs $10k-25k, 3.3% for AGIs $25k-50k, 2.4% for AGIs $50k-75k, 0.2% for AGIs $75k-100k, 2.8% for AGIs over 100k)
IRA payment deduction: $3,447 (reported on 2.9% of returns)
61284:
$3,447
Illinois:
$3,087
Total itemized deductions: $15,256 (17% of AGI, reported on 34.0% of returns)
Here:
$15,256
State:
$20,239
Here:
17.1% of AGI
State:
19.5% of AGI
(% of AGI for various income ranges: 9.0% for AGIs $10k-25k, 9.0% for AGIs $25k-50k, 9.3% for AGIs $50k-75k, 11.4% for AGIs $75k-100k, 9.1% for AGIs over 100k)
Charity contributions deductions: $2,580 (3% of AGI, reported on 29.0% of returns)
Here:
$2,580
State:
$3,719
Here:
2.7% of AGI
State:
3.4% of AGI
(% of AGI for various income ranges: 1.1% for AGIs $10k-25k, 0.8% for AGIs $25k-50k, 1.4% for AGIs $50k-75k, 1.4% for AGIs $75k-100k, 1.7% for AGIs over 100k)
Total tax: $7,696 (reported on 83.0% of returns)
61284:
$7,696
State:
$9,882
(% of AGI for various income ranges: 3.3% for AGIs below $10k, 4.5% for AGIs $10k-25k, 6.9% for AGIs $25k-50k, 8.7% for AGIs $50k-75k, 10.8% for AGIs $75k-100k, 18.3% for AGIs over 100k)
Earned income credit: $1,148 (reported on 4.7% of returns)
Here:
$1,148
State:
$1,788
Percentage of individuals using paid preparers for their 2004 taxes: 63.6%
Here:
64%
State:
61%
(% for various income ranges: 52.7% for AGIs below $10k, 57.6% for AGIs $10k-25k, 69.4% for AGIs $25k-50k, 70.3% for AGIs $50k-75k, 66.1% for AGIs $75k-100k, 61.7% for AGIs over 100k)
Household received Food Stamps/SNAP in the past 12 months: 0 Household did not receive Food Stamps/SNAP in the past 12 months: 784
Women who had a birth in the past 12 months: 10 (10 now married, 0 unmarried) Women who did not have a birth in the past 12 months: 180 (105 now married, 73 unmarried)
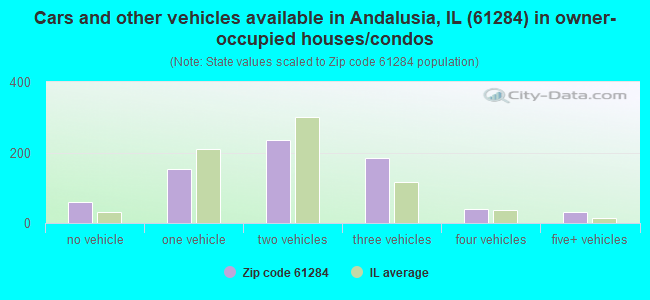
Housing units in zip code 61284 with a mortgage: 419 (40 second mortgage, 40 both second mortgage and home equity loan) Houses without a mortgage: 27
Median monthly owner costs for units with a mortgage: $1,562 Median monthly owner costs for units without a mortgage: $608
Residents with income below the poverty level in 2022:
This zip code:
3.8%
Whole state:
11.9%
Residents with income below 50% of the poverty level in 2022:
This zip code:
3.4%
Whole state:
5.7%
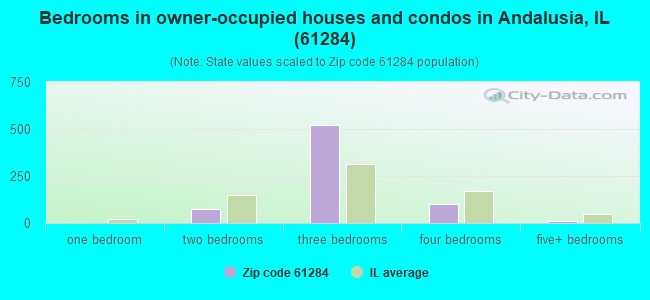
Median number of rooms in houses and condos:
Here:
6.2
State:
6.4
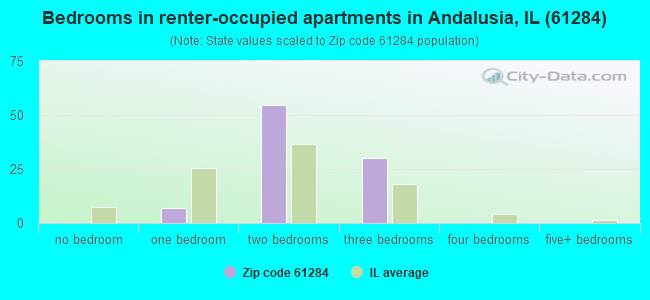
Median number of rooms in apartments:
Here:
3.4
State:
4.1
Notable locations in this zip code not listed on our city pages
Notable locations in zip code 61284: Buffalo Prairie Town Hall (A), Andalusia Fire Protection District Station 2 (B). Display/hide their locations on the map
Churches in zip code 61284 include: Zion Lutheran Church (A), Edgington Presbyterian Church (B), Taylor Ridge United Methodist Church (C), Saint Patricks Catholic Church (D). Display/hide their locations on the map
Lakes and reservoirs: Lake Velra (A), Valley Friends Lake (B), Turkey Hollow Reservoir (C), Hidden Lake (D), Lake George (E). Display/hide their locations on the map
Size of family households: 335 2-persons, 76 3-persons, 92 4-persons, 37 5-persons
Size of nonfamily households: 256 1-person
164 married couples with children.
106 single-parent households (94 men, 12 women).
96.1% of residents of 61284 zip code speak English at home.
4.0% of residents speak Spanish at home (100% very well).
0.5% of residents speak other Indo-European language at home (100% very well).
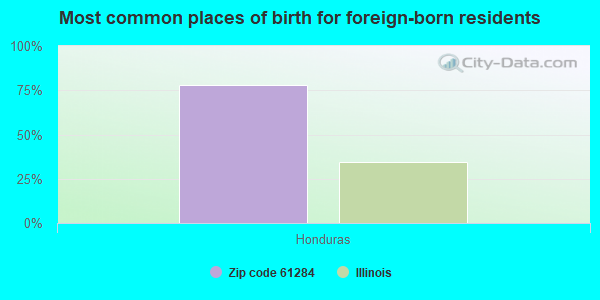
Foreign born population: 31 (1.9%) (0.0% of them are naturalized citizens)
:
1.9%
Whole state:
14.4%
78%Honduras
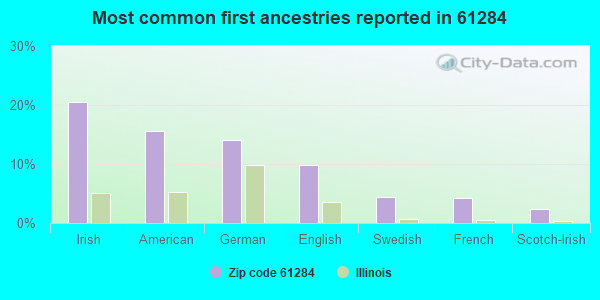
20%Irish
16%American
14%German
10%English
4%Swedish
4%French
2%Scotch-Irish
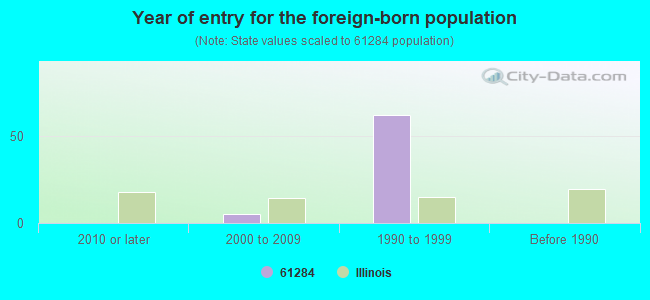
Year of entry for the foreign-born population
02010 or later
52000 to 2009
621990 to 1999
0Before 1990
Facilities with environmental interests located in this zip code:
ROCKRIDGE HIGH SCHOOL (14110 134TH AVE W in EDGINGTON, IL)
STATE MASTER (Illinois EPA Project) - HAZARDOUS WASTE PROGRAM, AIR PROGRAM AIR MINOR (AIRS/AFS) (National Center for Education Statistics) - STATE ID-4908130000001 CRITERIA AND HAZARDOUS AIR POLLUTANT INVENTORY (Inventory of air pollution sources) Conditionally Exempt Small Quantity Generators, less than 100 kg/month of hazardous waste (Resource Conservation and Recovery Act (tracking hazardous waste)) Business SIC and NAICS classification: ELEMENTARY AND SECONDARY SCHOOLS Organizations: CLAYTON NAYLOR (CONTACT/OPERATOR)
, ROCKRIDGE CUSD 300 (CONTACT/OWNER)
, ROCKRIDGE C U SCHOOL DIST 300 (SCHOOL DISTRICT)
Alternative names: ROCKRIDGE UNIT SCHOOL DISTRICT 300
MARTIN GRAIN CO (14506 140TH ST W in EDGINGTON, IL)
STATE MASTER (Illinois EPA Project) - AIR PROGRAM AIR MINOR (AIRS/AFS) CRITERIA AND HAZARDOUS AIR POLLUTANT INVENTORY (Inventory of air pollution sources) Business SIC classification: GRAIN AND FIELD BEANS
HICKORY HILLS SECOND ADDITION (6330 95TH AVENUE CT. WEST in TAYLOR RIDGE, IL)
STATE MASTER (Illinois EPA Project) - National Pollutant Discharge Elimination System Permit National Pollutant Discharge Elimination System NON-MAJOR (Tracking pollutant discharge elimination systems) - permit Business SIC classification: WATER SUPPLY
RESOURCE TECHNOLOGY CORP (8400 77TH ST W in TAYLOR RIDGE, IL)
STATE MASTER (Illinois EPA Project) - AIR PROGRAM AIR MAJOR (AIRS/AFS) CRITERIA AND HAZARDOUS AIR POLLUTANT INVENTORY (Inventory of air pollution sources) Business SIC classification: ELECTRIC SERVICES
ROCKRIDGE JR HIGH SCHOOL (14110 134TH AVE W in TAYLOR RIDGE, IL)
(National Center for Education Statistics) - STATE ID-4908130001002 Organizations: ROCKRIDGE C U SCHOOL DIST 300 (SCHOOL DISTRICT)
JERRYS DISPOSAL SYSTEMS INC (14824 79TH AVE W in TAYLOR RIDGE, IL)
(Resource Conservation and Recovery Act (tracking hazardous waste))
MER-ROC FS INC (6901 134TH AVE WEST in TAYLOR RIDGE, IL)
(Resource Conservation and Recovery Act (tracking hazardous waste))
MUELLER TRUCKING (6716 - 134TH AVENUE in TAYLOR RIDGE, IL)
National Pollutant Discharge Elimination System NON-MAJOR (Tracking pollutant discharge elimination systems) - permit
Housing units lacking complete plumbing facilities: 3.1%
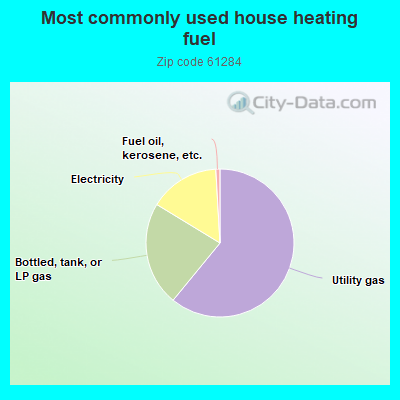
61.0%Utility gas
22.8%Bottled, tank, or LP gas
15.4%Electricity
0.9%Fuel oil, kerosene, etc.
Population in 1990: 1,090. Population change in the 1990s: +2,349 (+215.5%).
Place of birth for U.S.-born residents:
This state: 1,311
Northeast: 7
Midwest: 260
South: 39
West: 28
79% of the 61284 zip code residents lived in the same house 5 years ago. Out of people who lived in different houses, 62% lived in this county. Out of people who lived in different counties, 50% lived in Illinois.
99% of the 61284 zip code residents lived in the same house 1 year ago. Out of people who lived in different houses, 93% moved from this county.
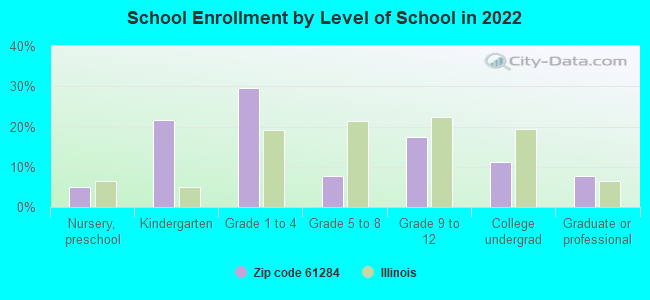
Private vs. public school enrollment:
Students in private schools in grades 1 to 8 (elementary and middle school): 54
Here:
51.3%
Illinois:
13.3%
Students in private schools in grades 9 to 12 (high school): 17
Here:
35.3%
Illinois:
9.9%
Students in private undergraduate colleges: 10
Here:
34.0%
Illinois:
27.4%
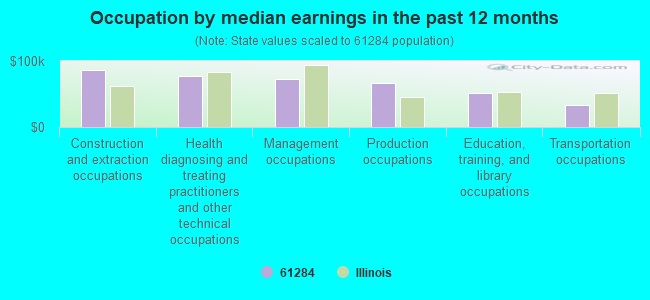
Occupation by median earnings in the past 12 months ($)
86,925Construction and extraction occupations
77,604Health diagnosing and treating practitioners and other technical occupations
72,131Management occupations
66,803Production occupations
51,018Education, training, and library occupations
33,087Transportation occupations
Companies with federal contracts located in this zip code:
ELAINE NITZ (9027 154TH ST W in TAYLOR RIDGE, IL; small business) : $59,598 in 15 contractsfrom 2002 to 2006
Contracts for Custodial Janitorial Services, Landscaping/Groundskeeping Services by Army, U.S. Army Corps of Engineers - civil program financing only Signed by year:2000: $0; 2001: $0; 2002: $7,820; 2003: $7,410; 2004: $15,674; 2005: $15,246; 2006: $13,448.
Biggest contracts:
$7,992 with Army for Custodial Janitorial Services. Signed on 2004-01-29. Completion date: 2003-03-31.
$7,992 with U.S. Army Corps of Engineers - civil program financing only for Custodial Janitorial Services. Signed on 2004-01-29. Completion date: 2003-03-31.
$7,820, same as above.Signed on 2002-03-13. Completion date: 2003-03-31.
$7,790 with Army for Landscaping/Groundskeeping Services. Signed on 2005-03-01. Completion date: 2004-11-04.
AMERICA''S PLACE QUAD CITIES, (6015 93RD AVE CT W in TAYLOR RIDGE, IL; small business)
$0 with Army for Sets, Kits, and Outfits of Hand Tools. Signed on 2003-05-22. Completion date: 2013-01-30.
Top industries in this zip code by the number of employees in 2005:
Arts, Entertainment, and Recreation: Golf Courses and Country Clubs (250-499 employees: 1 establishment)
Arts, Entertainment, and Recreation: Skiing Facilities (100-249: 1)
Accommodation and Food Services: Full-Service Restaurants (20-49: 1, 1-4: 1)
Construction: Commercial and Institutional Building Construction (10-19: 1, 5-9: 1)
Real Estate and Rental and Leasing: Lessors of Nonresidential Buildings (except Miniwarehouses) (10-19: 1)
Construction: Structural Steel and Precast Concrete Contractors (10-19: 1)
Other Services (except Public Administration): Religious Organizations (5-9: 1, 1-4: 1)
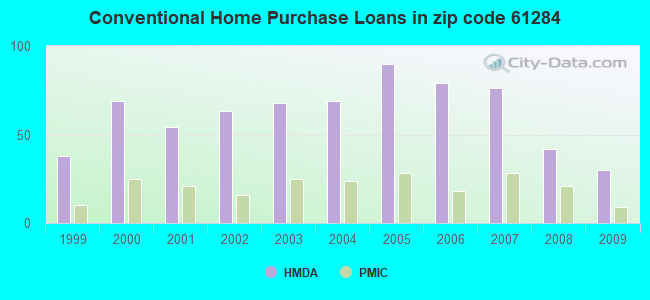
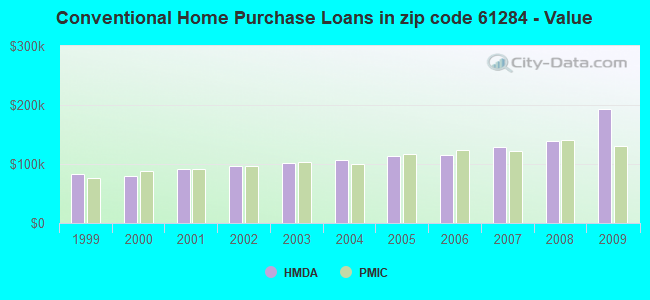
Detailed PMIC statistics for the following Tracts:0241.02
, 0241.03
2004 - 2018 National Fire Incident Reporting System (NFIRS) incidents
Based on the data from the years 2004 - 2018 the average number of fire incidents per year is 7. The highest number of fire incidents - 17 took place in 2015, and the least - 0 in 2009. The data has a dropping trend.
When looking into fire subcategories, the most reports belonged to: Outside Fires (54.5%), and Structure Fires (26.7%).
Fire incident types reported to NFIRS in Zip Code 61284


 Nearest zip codes: 61232, 52728, 61279, 52726, 52802, 52804.
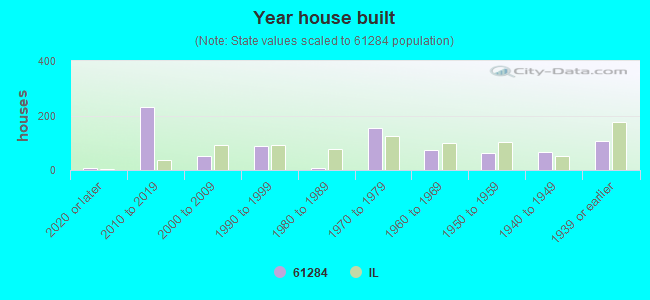


 Based on the data from the years 2004 - 2018 the average number of fire incidents per year is 7. The highest number of fire incidents - 17 took place in 2015, and the least - 0 in 2009. The data has a dropping trend.
 When looking into fire subcategories, the most reports belonged to: Outside Fires (54.5%), and Structure Fires (26.7%).