Estimated zip code population in 2022: 2,054 Zip code population in 2010: 2,452 Zip code population in 2000: 2,444
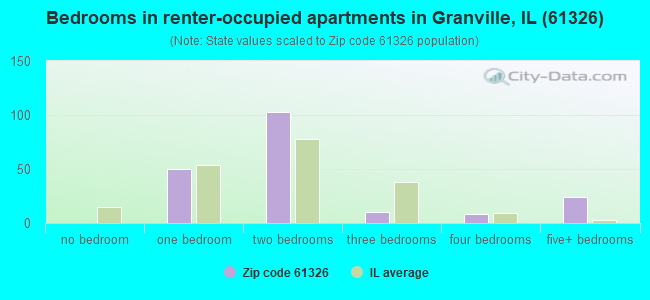
Houses and condos: 978 Renter-occupied apartments: 193
% of renters here:
23%
State:
33%
March 2022 cost of living index in zip code 61326: 84.4 (less than average, U.S. average is 100)
Land area: 49.3 sq. mi. Water area: 0.8 sq. mi.
Population density: 42 people per square mile
(very low).
OSM Map
General Map
Google Map
MSN Map
OSM Map
General Map
Google Map
MSN Map
OSM Map
General Map
Google Map
MSN Map
OSM Map
General Map
Google Map
MSN Map
Please wait while loading the map...
Real estate property taxes paid for housing units in 2022:
This zip code:
1.4% ($2,054)
Illinois:
2.0% ($4,912)
Median real estate property taxes paid for housing units with mortgages in 2022: $2,083 (1.4%) Median real estate property taxes paid for housing units with no mortgage in 2022: $2,039 (1.5%)
Business Search- 14 Million verified businesses
Males: 1,016
(49.5%)
Females: 1,038
(50.5%)
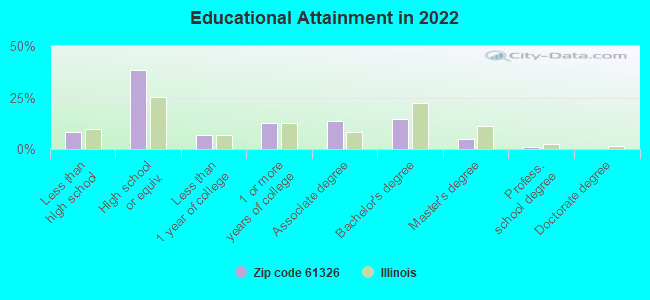
For population 25 years and over in 61326:
High school or higher: 90.8%
Bachelor's degree or higher: 20.0%
Graduate or professional degree: 5.7%
Unemployed: 2.6%
Mean travel time to work (commute): 22.3 minutes
For population 15 years and over in 61326:
Never married: 26.2%
Now married: 52.7%
Separated: 0.5%
Widowed: 9.4%
Divorced: 11.2%
Zip code 61326 compared to state average:
Median house value below state average.
Unemployed percentage below state average.
Black race population percentage significantly below state average.
Hispanic race population percentage below state average.
Foreign-born population percentage significantly below state average.
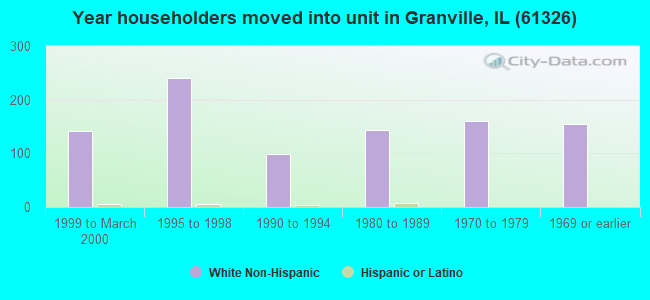
Length of stay since moving in significantly above state average.
Percentage of population with a bachelor's degree or higher below state average.
Averages for the 2020 tax year for zip code 61326, filed in 2021:
Average Adjusted Gross Income (AGI) in 2020: $66,270 (Individual Income Tax Returns)
Here:
$66,270
State:
$82,626
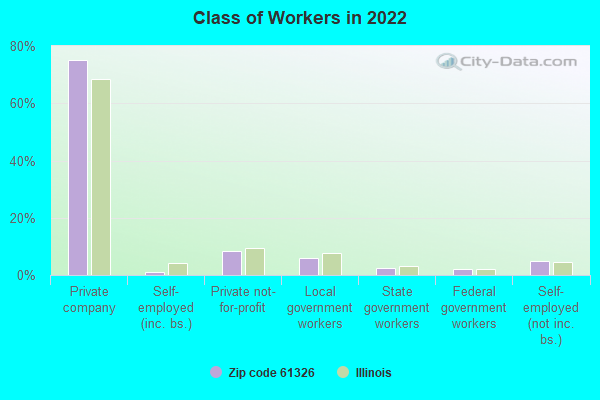
Salary/wage: $53,538 (reported on 78.9% of returns)
Here:
$53,538
State:
$66,640
(% of AGI for various income ranges: 1044.8% for AGIs below $25k, 3354.8% for AGIs $25k-50k, 5663.6% for AGIs $50k-75k, 8847.8% for AGIs $75k-100k, 12527.1% for AGIs $100k-200k)
Taxable interest for individuals: $1,024 (reported on 43.9% of returns)
This zip code:
$1,024
Illinois:
$2,376
(% of AGI for various income ranges: 13.5% for AGIs below $25k, 29.5% for AGIs $25k-50k, 47.9% for AGIs $50k-75k, 41.1% for AGIs $75k-100k, 122.1% for AGIs $100k-200k)
Ordinary dividends: $5,459 (reported on 25.4% of returns)
Here:
$5,459
State:
$9,061
(% of AGI for various income ranges: 31.3% for AGIs below $25k, 53.3% for AGIs $25k-50k, 68.6% for AGIs $50k-75k, 72.2% for AGIs $75k-100k, 400.0% for AGIs $100k-200k)
Net capital gain/loss in AGI: +$15,195 (reported on 18.4% of returns)
Here:
+$15,195
State:
+$31,684
(% of AGI for various income ranges: 7.0% for AGIs below $25k, 31.9% for AGIs $25k-50k, 127.1% for AGIs $50k-75k, 25.6% for AGIs $75k-100k, 522.1% for AGIs $100k-200k)
Profit/loss from business: +$24,483 (reported on 10.5% of returns)
Here:
+$24,483
State:
+$12,175
(% of AGI for various income ranges: 58.3% for AGIs below $25k, 76.2% for AGIs $25k-50k, 227.1% for AGIs $50k-75k, 1661.4% for AGIs $100k-200k)
Taxable individual retirement arrangement distribution: $12,320 (reported on 13.2% of returns)
61326:
$12,320
Illinois:
$21,613
(% of AGI for various income ranges: 103.5% for AGIs below $25k, 87.1% for AGIs $25k-50k, 198.6% for AGIs $50k-75k, 400.0% for AGIs $75k-100k, 563.6% for AGIs $100k-200k)
Taxes paid: $9,800 (reported on 1.8% of returns)
61326:
$9,800
State:
$8,563
(% of AGI for various income ranges: 140.0% for AGIs $50k-75k)
Earned income credit: $2,155 (reported on 9.6% of returns)
Here:
$2,155
State:
$2,311
(% of AGI for various income ranges: 66.5% for AGIs below $25k, 40.0% for AGIs $25k-50k)
Percentage of individuals using paid preparers for their 2020 taxes: 95.6%
Here:
96%
State:
93%
(% for various income ranges: 93.9% for AGIs below $25k, 96.2% for AGIs $25k-50k, 94.4% for AGIs $50k-75k, 100.0% for AGIs $75k-100k, 95.0% for AGIs $100k-200k, 100.0% for AGIs over 200k)
Averages for the 2012 tax year for zip code 61326, filed in 2013:
Average Adjusted Gross Income (AGI) in 2012: $57,117 (Individual Income Tax Returns)
Here:
$57,117
State:
$68,058
Salary/wage: $43,578 (reported on 80.7% of returns)
Here:
$43,578
State:
$55,396
(% of AGI for various income ranges: 68.7% for AGIs below $25k, 74.2% for AGIs $25k-50k, 73.0% for AGIs $50k-75k, 75.9% for AGIs $75k-100k, 78.2% for AGIs $100k-200k)
Taxable interest for individuals: $1,166 (reported on 47.1% of returns)
This zip code:
$1,166
Illinois:
$1,969
(% of AGI for various income ranges: 1.3% for AGIs below $25k, 0.7% for AGIs $25k-50k, 1.0% for AGIs $50k-75k, 0.5% for AGIs $75k-100k, 0.9% for AGIs $100k-200k, 1.5% for AGIs over 200k)
Ordinary dividends: $6,172 (reported on 24.4% of returns)
Here:
$6,172
State:
$7,786
(% of AGI for various income ranges: 0.9% for AGIs below $25k, 1.0% for AGIs $25k-50k, 0.6% for AGIs $50k-75k, 1.1% for AGIs $75k-100k, 2.9% for AGIs $100k-200k, 7.8% for AGIs over 200k)
Net capital gain/loss in AGI: +$7,460 (reported on 16.8% of returns)
Here:
+$7,460
State:
+$22,183
(% of AGI for various income ranges: 0.1% for AGIs $50k-75k, 2.1% for AGIs $75k-100k, 0.7% for AGIs $100k-200k, 9.3% for AGIs over 200k)
Profit/loss from business: +$13,820 (reported on 12.6% of returns)
Here:
+$13,820
State:
+$12,903
(% of AGI for various income ranges: 6.2% for AGIs below $25k, 0.6% for AGIs $25k-50k, 2.0% for AGIs $50k-75k, 1.2% for AGIs $75k-100k, 7.6% for AGIs $100k-200k)
Taxable individual retirement arrangement distribution: $10,807 (reported on 12.6% of returns)
61326:
$10,807
Illinois:
$17,929
(% of AGI for various income ranges: 3.5% for AGIs below $25k, 2.6% for AGIs $25k-50k, 2.3% for AGIs $50k-75k, 3.8% for AGIs $75k-100k, 2.8% for AGIs $100k-200k)
Total itemized deductions: $17,648 (15% of AGI, reported on 24.4% of returns)
Here:
$17,648
State:
$26,433
Here:
15.2% of AGI
State:
19.2% of AGI
(% of AGI for various income ranges: 5.9% for AGIs below $25k, 6.1% for AGIs $25k-50k, 6.7% for AGIs $50k-75k, 8.4% for AGIs $75k-100k, 9.8% for AGIs $100k-200k, 6.3% for AGIs over 200k)
Charity contributions: $2,884 (reported on 16.0% of returns)
Here:
$2,884
State:
$4,525
(% of AGI for various income ranges: 0.7% for AGIs $25k-50k, 0.5% for AGIs $50k-75k, 0.9% for AGIs $75k-100k, 1.8% for AGIs $100k-200k)
Taxes paid: $7,689 (reported on 23.5% of returns)
61326:
$7,689
State:
$11,968
(% of AGI for various income ranges: 2.0% for AGIs $25k-50k, 2.4% for AGIs $50k-75k, 3.3% for AGIs $75k-100k, 4.6% for AGIs $100k-200k, 4.0% for AGIs over 200k)
Earned income credit: $1,971 (reported on 14.3% of returns)
Here:
$1,971
State:
$2,349
(% of AGI for various income ranges: 5.5% for AGIs below $25k, 0.7% for AGIs $25k-50k)
Percentage of individuals using paid preparers for their 2012 taxes: 68.9%
Here:
69%
State:
57%
(% for various income ranges: 59.5% for AGIs below $25k, 67.9% for AGIs $25k-50k, 71.4% for AGIs $50k-75k, 83.3% for AGIs $75k-100k, 76.9% for AGIs $100k-200k, 100.0% for AGIs over 200k)
Averages for the 2004 tax year for zip code 61326, filed in 2005:
Average Adjusted Gross Income (AGI) in 2004: $43,309 (Individual Income Tax Returns)
Here:
$43,309
State:
$54,625
Salary/wage: $37,415 (reported on 82.5% of returns)
Here:
$37,415
State:
$46,811
(% of AGI for various income ranges: 75.5% for AGIs below $10k, 69.7% for AGIs $10k-25k, 79.1% for AGIs $25k-50k, 77.5% for AGIs $50k-75k, 80.8% for AGIs $75k-100k, 53.6% for AGIs over 100k)
Taxable interest for individuals: $2,034 (reported on 61.9% of returns)
This zip code:
$2,034
Illinois:
$2,101
(% of AGI for various income ranges: 9.2% for AGIs below $10k, 3.8% for AGIs $10k-25k, 3.1% for AGIs $25k-50k, 2.3% for AGIs $50k-75k, 1.7% for AGIs $75k-100k, 3.3% for AGIs over 100k)
Taxable dividends: $1,821 (reported on 29.3% of returns)
Here:
$1,821
State:
$4,306
(% of AGI for various income ranges: 2.7% for AGIs below $10k, 1.5% for AGIs $10k-25k, 0.6% for AGIs $25k-50k, 1.2% for AGIs $50k-75k, 0.7% for AGIs $75k-100k, 1.8% for AGIs over 100k)
Net capital gain/loss: +$4,242 (reported on 16.9% of returns)
Here:
+$4,242
State:
+$17,321
(% of AGI for various income ranges: -1.4% for AGIs below $10k, 0.0% for AGIs $10k-25k, 0.1% for AGIs $25k-50k, -0.0% for AGIs $50k-75k, -0.1% for AGIs $75k-100k, 6.3% for AGIs over 100k)
Profit/loss from business: +$12,493 (reported on 12.1% of returns)
Here:
+$12,493
State:
+$11,771
(% of AGI for various income ranges: -0.4% for AGIs below $10k, 0.0% for AGIs $10k-25k, 1.0% for AGIs $25k-50k, 2.7% for AGIs $50k-75k, 1.9% for AGIs $75k-100k, 8.6% for AGIs over 100k)
IRA payment deduction: $2,791 (reported on 3.5% of returns)
61326:
$2,791
Illinois:
$3,087
Self-employed pension: $8,692 (reported on 1.1% of returns)
Here:
$8,692
Illinois:
$16,965
Total itemized deductions: $15,313 (20% of AGI, reported on 21.7% of returns)
Here:
$15,313
State:
$20,239
Here:
19.9% of AGI
State:
19.5% of AGI
(% of AGI for various income ranges: 10.2% for AGIs below $10k, 5.6% for AGIs $10k-25k, 6.4% for AGIs $25k-50k, 10.0% for AGIs $50k-75k, 6.3% for AGIs $75k-100k, 7.8% for AGIs over 100k)
Charity contributions deductions: $2,028 (2% of AGI, reported on 17.3% of returns)
Here:
$2,028
State:
$3,719
Here:
2.5% of AGI
State:
3.4% of AGI
(% of AGI for various income ranges: 0.6% for AGIs $10k-25k, 0.5% for AGIs $25k-50k, 0.9% for AGIs $50k-75k, 0.7% for AGIs $75k-100k, 1.2% for AGIs over 100k)
Total tax: $6,523 (reported on 75.8% of returns)
61326:
$6,523
State:
$9,882
(% of AGI for various income ranges: 1.7% for AGIs below $10k, 4.4% for AGIs $10k-25k, 7.3% for AGIs $25k-50k, 9.1% for AGIs $50k-75k, 11.4% for AGIs $75k-100k, 19.8% for AGIs over 100k)
Earned income credit: $1,479 (reported on 11.8% of returns)
Here:
$1,479
State:
$1,788
Percentage of individuals using paid preparers for their 2004 taxes: 66.4%
Here:
66%
State:
61%
(% for various income ranges: 56.0% for AGIs below $10k, 67.7% for AGIs $10k-25k, 63.5% for AGIs $25k-50k, 71.0% for AGIs $50k-75k, 78.5% for AGIs $75k-100k, 80.3% for AGIs over 100k)
Household received Food Stamps/SNAP in the past 12 months: 102 Household did not receive Food Stamps/SNAP in the past 12 months: 749
Women who had a birth in the past 12 months: 33 (33 now married, 0 unmarried) Women who did not have a birth in the past 12 months: 357 (141 now married, 216 unmarried)
Housing units in zip code 61326 with a mortgage: 315 (21 second mortgage, 16 both second mortgage and home equity loan) Houses without a mortgage: 19
Median monthly owner costs for units with a mortgage: $1,168 Median monthly owner costs for units without a mortgage: $509
Residents with income below the poverty level in 2022:
This zip code:
13.3%
Whole state:
11.9%
Residents with income below 50% of the poverty level in 2022:
This zip code:
8.8%
Whole state:
5.7%
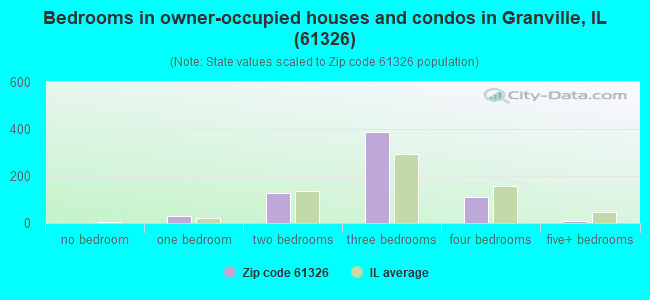
Median number of rooms in houses and condos:
Here:
6.3
State:
6.4
Median number of rooms in apartments:
Here:
4.1
State:
4.1
Notable locations in this zip code not listed on our city pages
Cemeteries: Sacred Heart Cemetery (1), Granville Cemetery (2), Mount Palatine Cemetery (3), Union Grove Cemetery (4). Display/hide their locations on the map
Parks in zip code 61326 include: Mount Palatine Cemetery Prairie Nature Preserve (1), Fox Run State Conservation Area (2). Display/hide their locations on the map
Size of family households: 295 2-persons, 109 3-persons, 85 4-persons, 32 5-persons, 4 6-persons, 23 7-or-more-persons
Size of nonfamily households: 257 1-person, 47 2-persons
267 married couples with children.
130 single-parent households (25 men, 105 women).
94.0% of residents of 61326 zip code speak English at home.
5.3% of residents speak Spanish at home (75% very well, 25% well).
0.6% of residents speak other Indo-European language at home (100% very well).
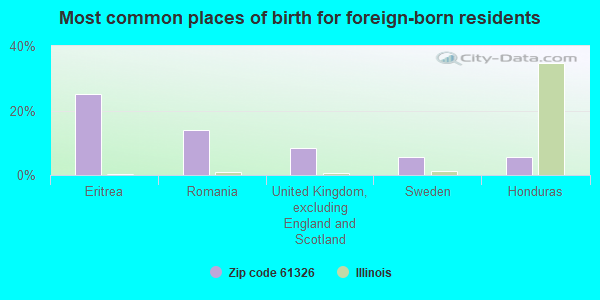
Foreign born population: 36 (1.8%) (91.7% of them are naturalized citizens)
This zip code:
1.8%
Whole state:
14.4%
25%Eritrea
14%Romania
8%United Kingdom, excluding England and Scotland
6%Sweden
6%Honduras
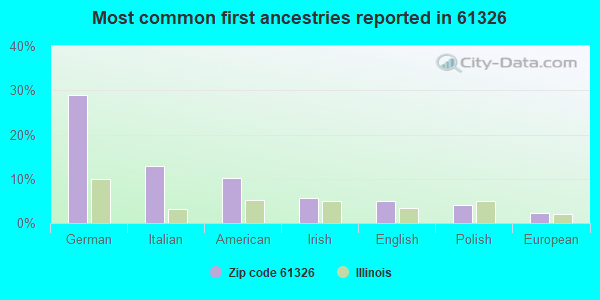
29%German
13%Italian
10%American
6%Irish
5%English
4%Polish
2%European
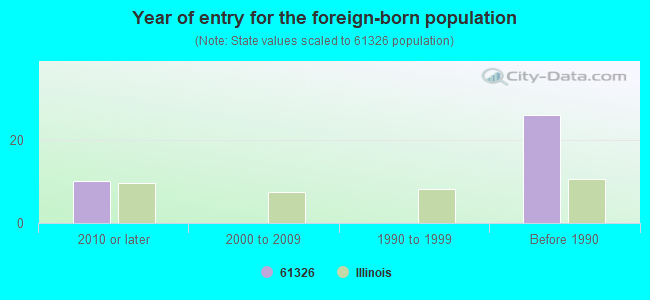
Year of entry for the foreign-born population
102010 or later
02000 to 2009
01990 to 1999
26Before 1990
Facilities with environmental interests located in this zip code:
GRANVILLE STP (316 SOUTH MCCOY STREET in GRANVILLE, IL)
STATE MASTER (Illinois EPA Project) - National Pollutant Discharge Elimination System Permit National Pollutant Discharge Elimination System NON-MAJOR (Tracking pollutant discharge elimination systems) - permit National Pollutant Discharge Elimination System NON-MAJOR (Tracking pollutant discharge elimination systems) - permit Business SIC classification: SEWERAGE SYSTEMS Alternative names: GRANVILLE STP, VILLAGE OF, GRANVILLE, VILLAGE OF
GRANVILLE READY MIX (502 EAST HARPER AVENUE in GRANVILLE, IL)
STATE MASTER (Illinois EPA Project) - AIR PROGRAM AIR MINOR (AIRS/AFS) CRITERIA AND HAZARDOUS AIR POLLUTANT INVENTORY (Inventory of air pollution sources) Business SIC classification: READY-MIXED CONCRETE
MID AMERICA GROWERS (14240 GREENHOUSE AVE in GRANVILLE, IL)
STATE MASTER (Illinois EPA Project) - AIR PROGRAM AIR MINOR (AIRS/AFS) Business SIC classification: ORNAMENTAL FLORICULTURE AND NURSERY PRODUCTS
PUTNAM COUNTY HIGH SCHOOL (P O BOX 341 in GRANVILLE, IL)
(Geographic Names Information System) (National Center for Education Statistics) - STATE ID-4307853500002 Organizations: PUTNAM CO C U SCHOOL DIST 535 (SCHOOL DISTRICT)
PUTNAM CO ELEM SCH-HOPKINS BLDG (PO BOX 602 in GRANVILLE, IL)
(National Center for Education Statistics) - STATE ID-4307853502005 Organizations: PUTNAM CO C U SCHOOL DIST 535 (SCHOOL DISTRICT)
AMOCO FERTILIZER PLANT (RTE 17 E in GRANVILLE, IL)
(Resource Conservation and Recovery Act (tracking hazardous waste))
NORTON INC.?GARY (RR 1 BOX 29 in GRANVILLE, IL)
National Pollutant Discharge Elimination System NON-MAJOR (Tracking pollutant discharge elimination systems) - permit Alternative names: NORTON, GARY INC.
MID AMERICAN GROWERS (HWY 89 RR 1 in GRANVILLE, IL)
Small Quantity Generators, between 100 kg and 1000 kg of hazardous waste/month (Resource Conservation and Recovery Act (tracking hazardous waste)) - notification
PUTNAM COUNTY COMMUNITY UNIT SD #535 (400 SILVERSPOON AVE in GRANVILLE, IL)
COMPLIANCE ACTIVITY (Tracking inspections of insecticide, fungicide, and rodenticide, and toxic substances) Alternative names: PUTNAM COUNTY CUSD #535
Housing units lacking complete plumbing facilities: 7.7% Housing units lacking complete kitchen facilities: 2.5%
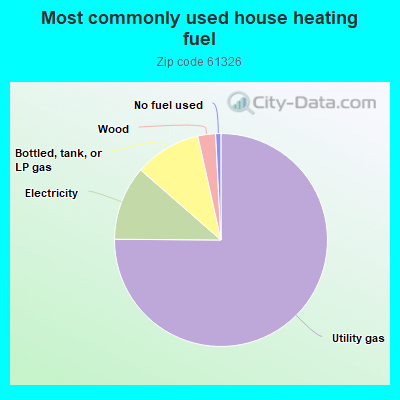
75.2%Utility gas
11.3%Electricity
10.1%Bottled, tank, or LP gas
2.7%Wood
0.8%No fuel used
Population in 1990: 2,784.
Place of birth for U.S.-born residents:
This state: 1,786
Midwest: 117
South: 71
West: 32
61% of the 61326 zip code residents lived in the same house 5 years ago. Out of people who lived in different houses, 48% lived in this county. Out of people who lived in different counties, 50% lived in Illinois.
91% of the 61326 zip code residents lived in the same house 1 year ago. Out of people who lived in different houses, 43% moved from this county. Out of people who lived in different houses, 52% moved from different county within same state. Out of people who lived in different houses, 5% moved from different state.
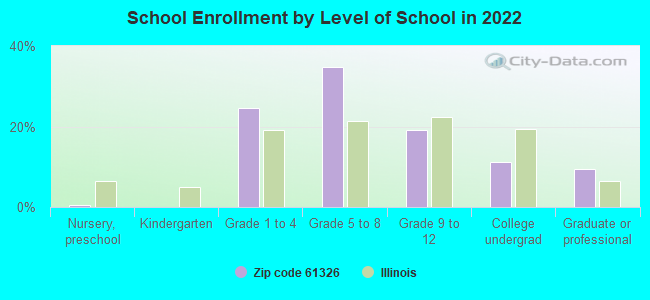
Private vs. public school enrollment:
Students in private schools in grades 1 to 8 (elementary and middle school): 17
Here:
8.3%
Illinois:
13.3%
Students in private schools in grades 9 to 12 (high school): 24
Here:
35.8%
Illinois:
9.9%
Students in private undergraduate colleges:
Here:
0.0%
Illinois:
27.4%
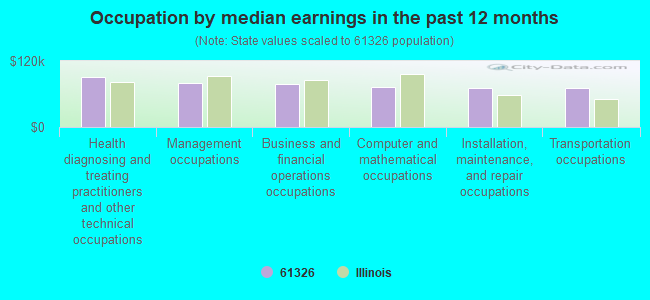
Occupation by median earnings in the past 12 months ($)
91,492Health diagnosing and treating practitioners and other technical occupations
80,781Management occupations
77,336Business and financial operations occupations
73,099Computer and mathematical occupations
71,423Installation, maintenance, and repair occupations
71,124Transportation occupations
Companies with federal contracts located in this zip code:
D O T RAIL SERVICE, INC (RR 1 in GRANVILLE, IL; small business) : $2,626,866 in 66 contractsfrom 2002 to 2006
Contracts for Maintenance, Repair or Alteration of Real Property -- Other Non-Building Facilities, Maintenance, Repair or Alteration of Real Property -- Highways, Roads, Streets, Bridges, and Railways (includes resurfacing), Maintenance, Repair or Alteration of Real Property -- Miscellaneous Buildings by Army Signed by year:2000: $0; 2001: $0; 2002: $194,516; 2003: $614,991; 2004: $348,263; 2005: $892,765; 2006: $576,331.
Biggest contracts:
$410,014 with Army for Maintenance, Repair or Alteration of Real Property -- Other Non-Building Facilities. Taking place in KY. Signed on 2005-03-01. Completion date: 2005-05-28.
$371,678, same as above.Signed on 2006-03-02. Completion date: 2006-07-20.
$260,569, same as above.Signed on 2005-09-20. Completion date: 2006-02-04.
$155,181, same as above.Signed on 2006-02-16. Completion date: 2006-05-10.
KETTMAN HEATING & PLUMBING (413 S ELM ST in GRANVILLE, IL; small business)
$10,180 with U.S. Army Corps of Engineers - civil program financing only for Air Conditioning Equipment. Signed on 2002-05-13. Completion date: 2002-06-10.
Top industries in this zip code by the number of employees in 2005:
Construction: Other Heavy and Civil Engineering Construction (10-19 employees: 1 establishment, 1-4 employees: 1 establishment)
Construction: Commercial and Institutional Building Construction (10-19: 1, 1-4: 1)
Information: Data Processing, Hosting, and Related Services (10-19: 1)
Construction: Plumbing, Heating, and Air-Conditioning Contractors (10-19: 1)
Finance and Insurance: Commercial Banking (10-19: 1)
Construction: Water and Sewer Line and Related Structures Construction (10-19: 1)
Construction: New Single-Family Housing Construction (except Operative Builders) (5-9: 1, 1-4: 1)
Finance and Insurance: Insurance Agencies and Brokerages (5-9: 1, 1-4: 1)
People in group quarters in 2000:
7 people in nursing homes
2002 - 2018 National Fire Incident Reporting System (NFIRS) incidents
Based on the data from the years 2002 - 2018 the average number of fire incidents per year is 11. The highest number of fire incidents - 23 took place in 2012, and the least - 0 in 2004. The data has a growing trend.
When looking into fire subcategories, the most reports belonged to: Structure Fires (54.2%), and Outside Fires (33.2%).
Fire incident types reported to NFIRS in Zip Code 61326

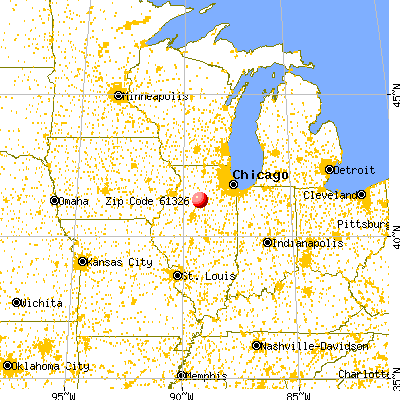


 Nearest zip codes: 61340, 61363, 61335, 61327, 61316, 61322.


 Based on the data from the years 2002 - 2018 the average number of fire incidents per year is 11. The highest number of fire incidents - 23 took place in 2012, and the least - 0 in 2004. The data has a growing trend.
 When looking into fire subcategories, the most reports belonged to: Structure Fires (54.2%), and Outside Fires (33.2%).