Estimated zip code population in 2022: 2,944 Zip code population in 2010: 3,312 Zip code population in 2000: 3,610
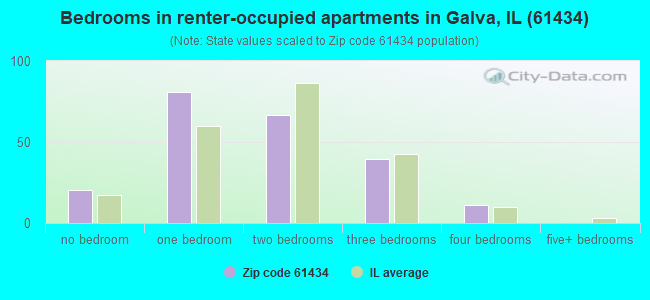
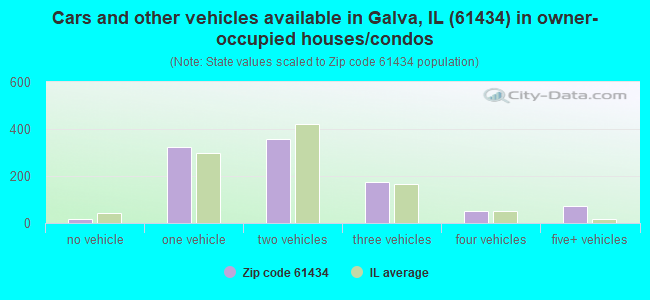
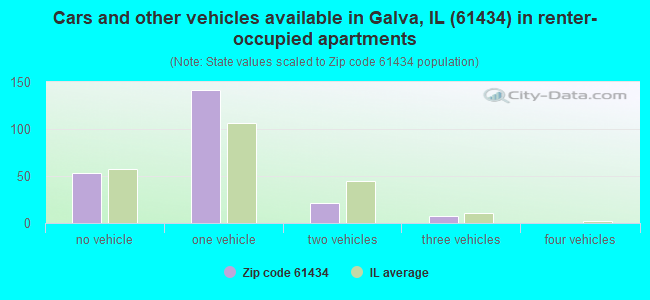
Houses and condos: 1,321 Renter-occupied apartments: 219
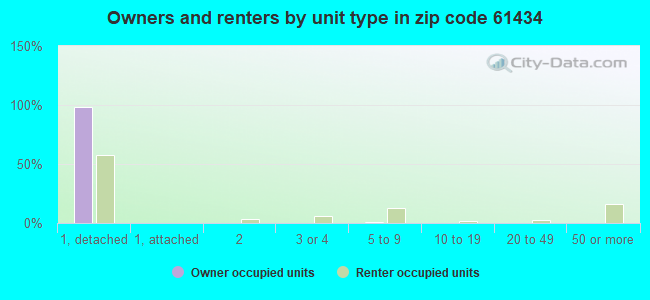
% of renters here:
18%
State:
33%
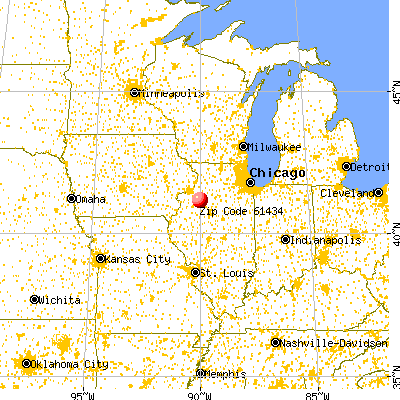
March 2022 cost of living index in zip code 61434: 83.9 (less than average, U.S. average is 100)
Land area: 79.1 sq. mi. Water area: 0.0 sq. mi.
Population density: 37 people per square mile
(very low).
OSM Map
General Map
Google Map
MSN Map
OSM Map
General Map
Google Map
MSN Map
OSM Map
General Map
Google Map
MSN Map
OSM Map
General Map
Google Map
MSN Map
Please wait while loading the map...
Real estate property taxes paid for housing units in 2022:
This zip code:
1.7% ($1,515)
Illinois:
2.0% ($4,912)
Median real estate property taxes paid for housing units with mortgages in 2022: $1,975 (1.8%) Median real estate property taxes paid for housing units with no mortgage in 2022: $1,266 (1.8%)
Business Search- 14 Million verified businesses
Males: 1,415
(48.1%)
Females: 1,528
(51.9%)
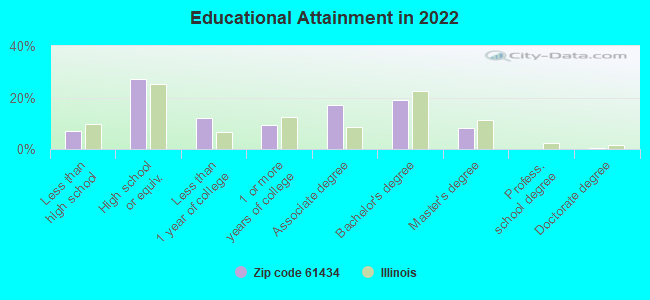
For population 25 years and over in 61434:
High school or higher: 92.9%
Bachelor's degree or higher: 27.8%
Graduate or professional degree: 8.7%
Unemployed: 2.0%
Mean travel time to work (commute): 23.6 minutes
For population 15 years and over in 61434:
Never married: 26.4%
Now married: 51.9%
Separated: 2.8%
Widowed: 8.7%
Divorced: 10.2%
Zip code 61434 compared to state average:
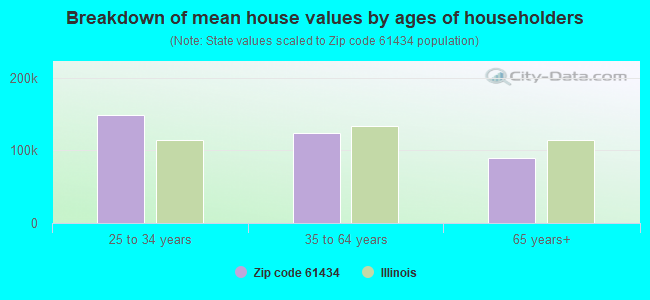
Median house value significantly below state average.
Unemployed percentage below state average.
Black race population percentage significantly below state average.
Hispanic race population percentage significantly below state average.
Foreign-born population percentage significantly below state average.
Renting percentage below state average.
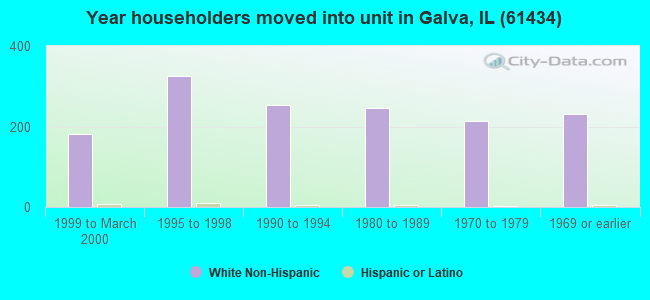
Length of stay since moving in significantly above state average.
House age above state average.
Number of college students significantly below state average.
Averages for the 2020 tax year for zip code 61434, filed in 2021:
Average Adjusted Gross Income (AGI) in 2020: $53,456 (Individual Income Tax Returns)
Here:
$53,456
State:
$82,626
Salary/wage: $46,151 (reported on 79.7% of returns)
Here:
$46,151
State:
$66,640
(% of AGI for various income ranges: 1050.8% for AGIs below $25k, 3384.2% for AGIs $25k-50k, 5813.3% for AGIs $50k-75k, 8113.6% for AGIs $75k-100k, 15497.0% for AGIs $100k-200k)
Taxable interest for individuals: $778 (reported on 36.5% of returns)
This zip code:
$778
Illinois:
$2,376
(% of AGI for various income ranges: 21.4% for AGIs below $25k, 33.9% for AGIs $25k-50k, 46.7% for AGIs $50k-75k, 23.6% for AGIs $75k-100k, 115.0% for AGIs $100k-200k)
Ordinary dividends: $4,074 (reported on 18.2% of returns)
Here:
$4,074
State:
$9,061
(% of AGI for various income ranges: 26.5% for AGIs below $25k, 20.3% for AGIs $25k-50k, 105.6% for AGIs $50k-75k, 93.6% for AGIs $75k-100k, 646.0% for AGIs $100k-200k)
Net capital gain/loss in AGI: +$7,024 (reported on 14.2% of returns)
Here:
+$7,024
State:
+$31,684
(% of AGI for various income ranges: 17.8% for AGIs below $25k, 52.9% for AGIs $25k-50k, 104.4% for AGIs $50k-75k, 143.6% for AGIs $75k-100k, 899.0% for AGIs $100k-200k)
Profit/loss from business: +$6,888 (reported on 11.5% of returns)
Here:
+$6,888
State:
+$12,175
(% of AGI for various income ranges: 50.8% for AGIs below $25k, 47.7% for AGIs $25k-50k, 176.1% for AGIs $50k-75k, 518.0% for AGIs $100k-200k)
Taxable individual retirement arrangement distribution: $10,831 (reported on 8.8% of returns)
61434:
$10,831
Illinois:
$21,613
(% of AGI for various income ranges: 79.2% for AGIs below $25k, 57.7% for AGIs $25k-50k, 251.7% for AGIs $50k-75k, 483.0% for AGIs $100k-200k)
Total itemized deductions: $37,100 (reported on 2.0% of returns)
Here:
$37,100
State:
$34,948
(% of AGI for various income ranges: 1113.0% for AGIs $100k-200k)
Charity contributions: $14,300 (reported on 1.4% of returns)
Here:
$14,300
State:
$13,122
(% of AGI for various income ranges: 158.9% for AGIs $50k-75k)
Taxes paid: $7,067 (reported on 2.0% of returns)
61434:
$7,067
State:
$8,563
(% of AGI for various income ranges: 192.7% for AGIs $75k-100k)
Earned income credit: $2,277 (reported on 14.9% of returns)
Here:
$2,277
State:
$2,311
(% of AGI for various income ranges: 83.2% for AGIs below $25k, 62.3% for AGIs $25k-50k)
Percentage of individuals using paid preparers for their 2020 taxes: 94.6%
Here:
95%
State:
93%
(% for various income ranges: 92.0% for AGIs below $25k, 97.4% for AGIs $25k-50k, 96.0% for AGIs $50k-75k, 93.3% for AGIs $75k-100k, 94.1% for AGIs $100k-200k, 100.0% for AGIs over 200k)
Averages for the 2012 tax year for zip code 61434, filed in 2013:
Average Adjusted Gross Income (AGI) in 2012: $45,815 (Individual Income Tax Returns)
Here:
$45,815
State:
$68,058
Salary/wage: $36,817 (reported on 83.8% of returns)
Here:
$36,817
State:
$55,396
(% of AGI for various income ranges: 73.9% for AGIs below $25k, 74.7% for AGIs $25k-50k, 72.9% for AGIs $50k-75k, 72.8% for AGIs $75k-100k, 54.0% for AGIs $100k-200k)
Taxable interest for individuals: $811 (reported on 40.9% of returns)
This zip code:
$811
Illinois:
$1,969
(% of AGI for various income ranges: 1.7% for AGIs below $25k, 0.9% for AGIs $25k-50k, 0.7% for AGIs $50k-75k, 0.5% for AGIs $75k-100k, 0.4% for AGIs $100k-200k)
Ordinary dividends: $2,030 (reported on 21.4% of returns)
Here:
$2,030
State:
$7,786
(% of AGI for various income ranges: 1.4% for AGIs below $25k, 0.9% for AGIs $25k-50k, 1.1% for AGIs $50k-75k, 0.5% for AGIs $75k-100k, 0.9% for AGIs $100k-200k)
Net capital gain/loss in AGI: +$3,705 (reported on 13.0% of returns)
Here:
+$3,705
State:
+$22,183
(% of AGI for various income ranges: 0.2% for AGIs $25k-50k, 0.5% for AGIs $50k-75k, 0.5% for AGIs $75k-100k, 2.7% for AGIs $100k-200k)
Profit/loss from business: +$7,883 (reported on 11.7% of returns)
Here:
+$7,883
State:
+$12,903
(% of AGI for various income ranges: 2.0% for AGIs below $25k, 3.3% for AGIs $25k-50k, 2.4% for AGIs $50k-75k, 1.4% for AGIs $75k-100k, 1.2% for AGIs $100k-200k)
Taxable individual retirement arrangement distribution: $6,256 (reported on 11.7% of returns)
61434:
$6,256
Illinois:
$17,929
(% of AGI for various income ranges: 2.3% for AGIs below $25k, 2.7% for AGIs $25k-50k, 1.9% for AGIs $50k-75k, 2.5% for AGIs $75k-100k)
Total itemized deductions: $19,065 (19% of AGI, reported on 14.9% of returns)
Here:
$19,065
State:
$26,433
Here:
18.5% of AGI
State:
19.2% of AGI
(% of AGI for various income ranges: 5.4% for AGIs $25k-50k, 6.0% for AGIs $50k-75k, 6.3% for AGIs $75k-100k, 8.9% for AGIs $100k-200k)
Charity contributions: $3,233 (reported on 9.7% of returns)
Here:
$3,233
State:
$4,525
(% of AGI for various income ranges: 0.6% for AGIs $25k-50k, 0.5% for AGIs $50k-75k, 0.7% for AGIs $75k-100k, 1.1% for AGIs $100k-200k)
Taxes paid: $6,791 (reported on 14.9% of returns)
61434:
$6,791
State:
$11,968
(% of AGI for various income ranges: 1.2% for AGIs $25k-50k, 1.7% for AGIs $50k-75k, 2.4% for AGIs $75k-100k, 3.8% for AGIs $100k-200k)
Earned income credit: $1,859 (reported on 17.5% of returns)
Here:
$1,859
State:
$2,349
(% of AGI for various income ranges: 5.3% for AGIs below $25k, 0.7% for AGIs $25k-50k)
Percentage of individuals using paid preparers for their 2012 taxes: 63.6%
Here:
64%
State:
57%
(% for various income ranges: 55.4% for AGIs below $25k, 64.1% for AGIs $25k-50k, 72.7% for AGIs $50k-75k, 71.4% for AGIs $75k-100k, 78.6% for AGIs $100k-200k)
Averages for the 2004 tax year for zip code 61434, filed in 2005:
Average Adjusted Gross Income (AGI) in 2004: $33,901 (Individual Income Tax Returns)
Here:
$33,901
State:
$54,625
Salary/wage: $31,244 (reported on 82.3% of returns)
Here:
$31,244
State:
$46,811
(% of AGI for various income ranges: 120.3% for AGIs below $10k, 63.6% for AGIs $10k-25k, 80.4% for AGIs $25k-50k, 77.9% for AGIs $50k-75k, 78.0% for AGIs $75k-100k, 66.6% for AGIs over 100k)
Taxable interest for individuals: $1,176 (reported on 55.0% of returns)
This zip code:
$1,176
Illinois:
$2,101
(% of AGI for various income ranges: 10.9% for AGIs below $10k, 4.9% for AGIs $10k-25k, 1.3% for AGIs $25k-50k, 1.5% for AGIs $50k-75k, 1.4% for AGIs $75k-100k, 0.6% for AGIs over 100k)
Taxable dividends: $1,485 (reported on 28.4% of returns)
Here:
$1,485
State:
$4,306
(% of AGI for various income ranges: 6.1% for AGIs below $10k, 1.6% for AGIs $10k-25k, 0.9% for AGIs $25k-50k, 1.2% for AGIs $50k-75k, 0.4% for AGIs $75k-100k, 1.8% for AGIs over 100k)
Net capital gain/loss: +$3,565 (reported on 20.6% of returns)
Here:
+$3,565
State:
+$17,321
(% of AGI for various income ranges: 0.4% for AGIs below $10k, 1.0% for AGIs $10k-25k, 0.3% for AGIs $25k-50k, 2.2% for AGIs $50k-75k, 3.5% for AGIs $75k-100k, 5.4% for AGIs over 100k)
Profit/loss from business: +$6,496 (reported on 14.9% of returns)
Here:
+$6,496
State:
+$11,771
(% of AGI for various income ranges: -1.5% for AGIs below $10k, 7.8% for AGIs $10k-25k, 2.1% for AGIs $25k-50k, 3.4% for AGIs $50k-75k, 2.0% for AGIs $75k-100k, 1.0% for AGIs over 100k)
IRA payment deduction: $1,973 (reported on 2.4% of returns)
61434:
$1,973
Illinois:
$3,087
Total itemized deductions: $15,075 (23% of AGI, reported on 15.3% of returns)
Here:
$15,075
State:
$20,239
Here:
23.5% of AGI
State:
19.5% of AGI
(% of AGI for various income ranges: 14.2% for AGIs below $10k, 9.0% for AGIs $10k-25k, 4.0% for AGIs $25k-50k, 6.5% for AGIs $50k-75k, 7.2% for AGIs $75k-100k, 9.1% for AGIs over 100k)
Charity contributions deductions: $2,589 (4% of AGI, reported on 11.8% of returns)
Here:
$2,589
State:
$3,719
Here:
3.8% of AGI
State:
3.4% of AGI
(% of AGI for various income ranges: 1.3% for AGIs below $10k, 0.8% for AGIs $10k-25k, 0.5% for AGIs $25k-50k, 0.8% for AGIs $50k-75k, 0.8% for AGIs $75k-100k, 1.8% for AGIs over 100k)
Total tax: $4,441 (reported on 70.6% of returns)
61434:
$4,441
State:
$9,882
(% of AGI for various income ranges: 3.7% for AGIs below $10k, 4.6% for AGIs $10k-25k, 6.4% for AGIs $25k-50k, 8.8% for AGIs $50k-75k, 10.7% for AGIs $75k-100k, 18.3% for AGIs over 100k)
Earned income credit: $1,502 (reported on 14.8% of returns)
Here:
$1,502
State:
$1,788
Percentage of individuals using paid preparers for their 2004 taxes: 68.8%
Here:
69%
State:
61%
(% for various income ranges: 60.1% for AGIs below $10k, 70.8% for AGIs $10k-25k, 71.5% for AGIs $25k-50k, 73.1% for AGIs $50k-75k, 71.9% for AGIs $75k-100k, 71.4% for AGIs over 100k)
Household received Food Stamps/SNAP in the past 12 months: 231 Household did not receive Food Stamps/SNAP in the past 12 months: 992
Women who had a birth in the past 12 months: 61 (24 now married, 36 unmarried) Women who did not have a birth in the past 12 months: 454 (211 now married, 241 unmarried)
Housing units in zip code 61434 with a mortgage: 496 (26 second mortgage, 17 both second mortgage and home equity loan) Median monthly owner costs for units with a mortgage: $1,040 Median monthly owner costs for units without a mortgage: $502
Residents with income below the poverty level in 2022:
This zip code:
13.7%
Whole state:
11.9%
Residents with income below 50% of the poverty level in 2022:
This zip code:
5.9%
Whole state:
5.7%
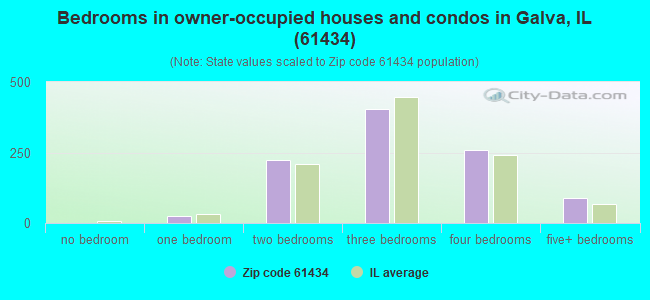
Median number of rooms in houses and condos:
Here:
7.1
State:
6.4
Median number of rooms in apartments:
Here:
4.4
State:
4.1
Notable locations in this zip code not listed on our city pages
Notable locations in zip code 61434: Galva Autovue Theatre (A), Galva Public Library (B), Galva Grange Hall (C), Galva Bishop Hills Emergency Medical Services (D), Galva Fire Department (E). Display/hide their locations on the map
Churches in zip code 61434 include: Trinity Baptist Church (A), Galva Christian Church (B), First United Methodist Church (C), First Congregational Church (D), First Baptist Church of Galva (E), Saint Johns Catholic Church (F), Assembly of God Church (G), Grace United Methodist Church (H), Foursquare Church (I). Display/hide their locations on the map
Size of family households: 349 2-persons, 184 3-persons, 97 4-persons, 45 5-persons, 30 6-persons, 46 7-or-more-persons
Size of nonfamily households: 450 1-person, 13 2-persons
385 married couples with children.
278 single-parent households (77 men, 201 women).
96.9% of residents of 61434 zip code speak English at home.
1.2% of residents speak Spanish at home (100% very well).
1.0% of residents speak other Indo-European language at home (14% very well, 29% well, 57% not well).
0.3% of residents speak other language at home (100% very well).
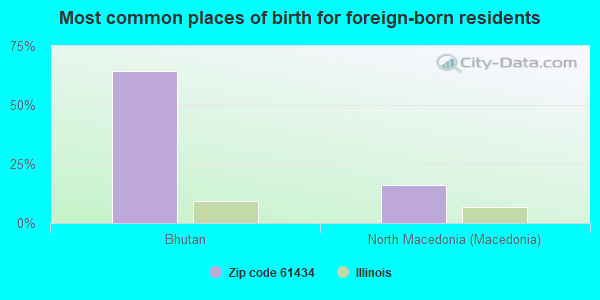
Foreign born population: 31 (1.1%) (90.4% of them are naturalized citizens)
This zip code:
1.1%
Whole state:
14.4%
65%Bhutan
16%North Macedonia (Macedonia)
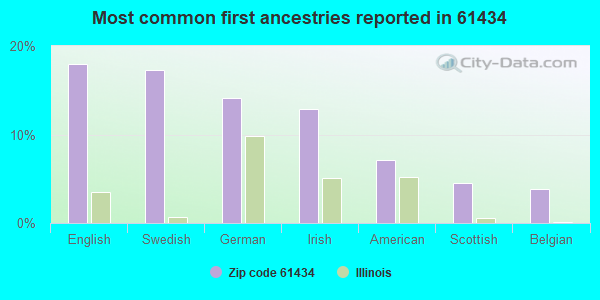
18%English
17%Swedish
14%German
13%Irish
7%American
5%Scottish
4%Belgian
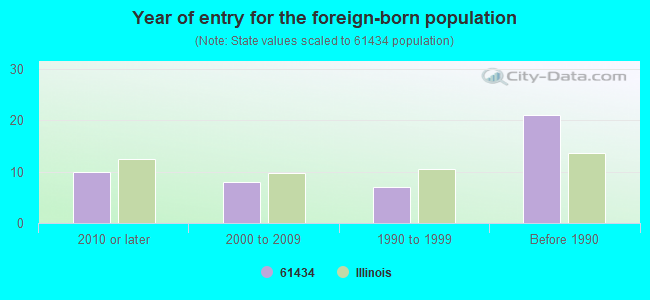
Year of entry for the foreign-born population
102010 or later
82000 to 2009
71990 to 1999
21Before 1990
Major facilities with environmental interests located in this zip code:
KERR-MCGEE REFINING CORP (12 SE 1ST AVENUE in GALVA, IL)
STATE MASTER (Illinois EPA Project) - SOLID WASTE PROGRAM, SCRAP TIRE MANAGEMENT, AIR PROGRAM STATE MASTER (Illinois EPA Project) - National Pollutant Discharge Elimination System Permit AIR MINOR (AIRS/AFS) CRITERIA AND HAZARDOUS AIR POLLUTANT INVENTORY (Inventory of air pollution sources) Business SIC classification: GASOLINE SERVICE STATIONS Alternative names: KERR-MCGEE REFINING CORP.-STATION KM-722
KEWANEE CORP (1105 SE 2ND ST in GALVA, IL)
STATE MASTER (Illinois EPA Project) - HAZARDOUS WASTE PROGRAM Large Quantity Generators, more that 1000 kg of hazardous waste/month (Resource Conservation and Recovery Act (tracking hazardous waste)) - notification Business NAICS classification: FARM MACHINERY AND EQUIPMENT MANUFACTURING. Organizations: PAWLOWSKI DANIEL S (CONTACT/OWNER)
Alternative names: HAMMONS INDUSTRIES INC
JOHN H BEST & SONS INC (BURLINGTON RD in GALVA, IL)
STATE MASTER (Illinois EPA Project) - SOLID WASTE PROGRAM, HAZARDOUS WASTE PROGRAM, AIR PROGRAM AIR MINOR (AIRS/AFS) Business SIC classification: WOOD OFFICE AND STORE FIXTURES, PARTITIONS, SHELVING, AND LOCKERS
ALL FEED PROCESSING AND PACKAGING (717 W. DIVISION ST. in GALVA, IL)
STATE MASTER (Illinois EPA Project) - AIR PROGRAM AIR MINOR (AIRS/AFS) Business SIC classification: NONCLASSIFIABLE ESTABLISHMENTS
LINCOLN LAND RAIL LLC (1100 SE 2ND in GALVA, IL)
STATE MASTER (Illinois EPA Project) - AIR PROGRAM AIR MINOR (AIRS/AFS) Business SIC classification: GRAIN AND FIELD BEANS Alternative names: GATEWAY GRAIN ELEVATOR
MILITARY & NAVAL DEPT (201 MORGAN ROAD in GALVA, IL)
STATE MASTER (Illinois EPA Project) - HAZARDOUS WASTE PROGRAM, AIR PROGRAM AIR MINOR (AIRS/AFS) Business SIC classification: NATIONAL SECURITY Alternative names: DEPT. OF MILITARY AFFAIRS
NORWEST BANK (112 N EXCHANGE ST in GALVA, IL)
STATE MASTER (Illinois EPA Project) - HAZARDOUS WASTE PROGRAM Conditionally Exempt Small Quantity Generators, less than 100 kg/month of hazardous waste (Resource Conservation and Recovery Act (tracking hazardous waste)) - notification TRANSPORTER (Resource Conservation and Recovery Act (tracking hazardous waste)) - notification Organizations: NORWEST CORPORATION (CONTACT/OWNER)
Alternative names: NORWEST BANK GALVA NA
CITY OF GALVA (103 N. CENTER AVE in GALVA, IL)
STATE MASTER (Illinois EPA Project) - AIR PROGRAM AIR MINOR (AIRS/AFS) Business SIC classification: NONCLASSIFIABLE ESTABLISHMENTS Alternative names: CITY OF GALVA WELL NUMBER 4
PEARSON BROTHERS CO (US RTE 34 EAST in GALVA, IL)
Large Quantity Generators, more that 1000 kg of hazardous waste/month (Resource Conservation and Recovery Act (tracking hazardous waste)) - notification TSD (Resource Conservation and Recovery Act (tracking hazardous waste)) Organizations: LELAND PEARSON (CONTACT/OWNER)
AMOCO FERTILIZER PLANT (2MI S OF RTE 34 in GALVA, IL)
(Resource Conservation and Recovery Act (tracking hazardous waste))
LINDBURG OIL COMPANY (104 MARKET STREET in GALVA, IL)
AIR MINOR (AIRS/AFS) Business SIC classification: PETROLEUM BULK STATIONS AND TERMINALS
BOSTON TRUCKING, INC. (203 N.E. 8 AVE. in GALVA, IL)
National Pollutant Discharge Elimination System NON-MAJOR (Tracking pollutant discharge elimination systems) - permit
ILLINOIS ARMY NATIONAL GUARD (201 MORGAN RD in GALVA, IL)
Small Quantity Generators, between 100 kg and 1000 kg of hazardous waste/month (Resource Conservation and Recovery Act (tracking hazardous waste)) - notification TRANSPORTER (Resource Conservation and Recovery Act (tracking hazardous waste)) - notification
Housing units lacking complete plumbing facilities: 5.7% Housing units lacking complete kitchen facilities: 5.8%
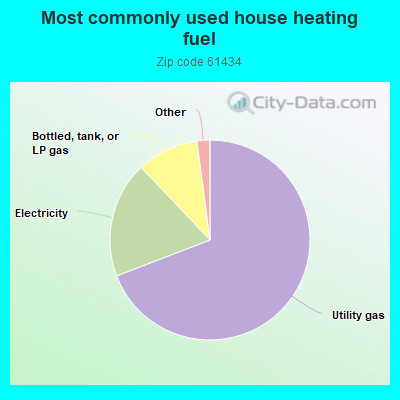
69.3%Utility gas
18.8%Electricity
10.0%Bottled, tank, or LP gas
0.9%Other fuel
0.7%Wood
0.5%No fuel used
Population in 1990: 3,725.
Place of birth for U.S.-born residents:
This state: 2,527
Northeast: 34
Midwest: 162
South: 50
West: 112
64% of the 61434 zip code residents lived in the same house 5 years ago. Out of people who lived in different houses, 60% lived in this county. Out of people who lived in different counties, 50% lived in Illinois.
92% of the 61434 zip code residents lived in the same house 1 year ago. Out of people who lived in different houses, 55% moved from this county. Out of people who lived in different houses, 33% moved from different county within same state. Out of people who lived in different houses, 9% moved from different state. Out of people who lived in different houses, 4% moved from abroad.
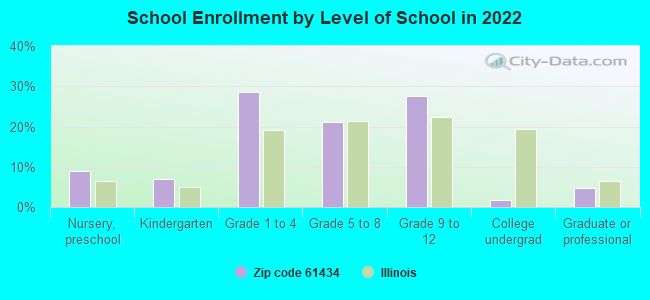
Private vs. public school enrollment:
Students in private schools in grades 1 to 8 (elementary and middle school): 94
Here:
29.9%
Illinois:
13.3%
Students in private schools in grades 9 to 12 (high school): 8
Here:
5.0%
Illinois:
9.9%
Students in private undergraduate colleges:
Here:
0.0%
Illinois:
27.4%
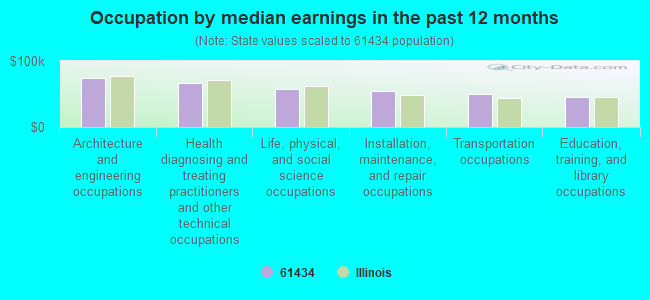
Occupation by median earnings in the past 12 months ($)
73,648Architecture and engineering occupations
67,287Health diagnosing and treating practitioners and other technical occupations
56,860Life, physical, and social science occupations
54,929Installation, maintenance, and repair occupations
49,348Transportation occupations
46,179Education, training, and library occupations
Top industries in this zip code by the number of employees in 2005:
2002 - 2018 National Fire Incident Reporting System (NFIRS) incidents
Based on the data from the years 2002 - 2018 the average number of fires per year is 24. The highest number of fires - 45 took place in 2015, and the least - 11 in 2008. The data has a growing trend.
When looking into fire subcategories, the most incidents belonged to: Structure Fires (39.4%), and Outside Fires (37.7%).
Fire incident types reported to NFIRS in Zip Code 61434


 Nearest zip codes: 61419, 61449, 61443, 61414, 61238, 61485.
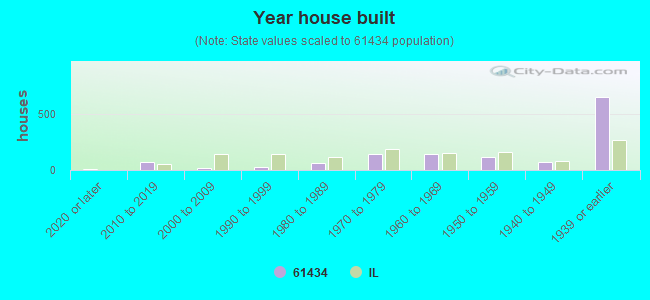


 Based on the data from the years 2002 - 2018 the average number of fires per year is 24. The highest number of fires - 45 took place in 2015, and the least - 11 in 2008. The data has a growing trend.
 When looking into fire subcategories, the most incidents belonged to: Structure Fires (39.4%), and Outside Fires (37.7%).