Estimated zip code population in 2022: 1,232 Zip code population in 2010: 1,213 Zip code population in 2000: 1,144
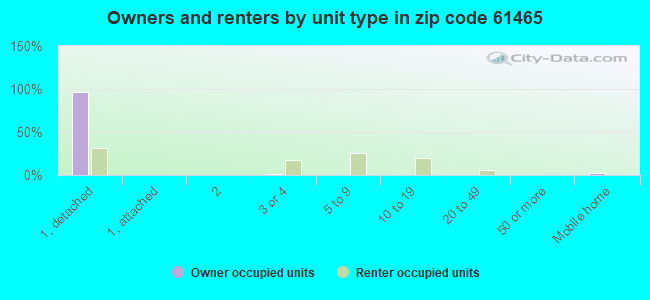
Houses and condos: 571 Renter-occupied apartments: 35
% of renters here:
7%
State:
33%
March 2022 cost of living index in zip code 61465: 83.7 (less than average, U.S. average is 100)
Land area: 41.8 sq. mi. Water area: 0.0 sq. mi.
Population density: 29 people per square mile
(very low).
OSM Map
General Map
Google Map
MSN Map
OSM Map
General Map
Google Map
MSN Map
OSM Map
General Map
Google Map
MSN Map
OSM Map
General Map
Google Map
MSN Map
Please wait while loading the map...
Real estate property taxes paid for housing units in 2022:
This zip code:
2.1% ($2,213)
Illinois:
2.0% ($4,912)
Median real estate property taxes paid for housing units with mortgages in 2022: $2,462 (1.9%) Median real estate property taxes paid for housing units with no mortgage in 2022: $1,930 (2.2%)
Business Search- 14 Million verified businesses
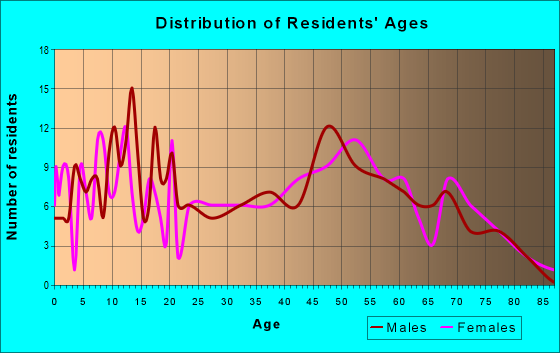
Males: 679
(55.1%)
Females: 553
(44.9%)
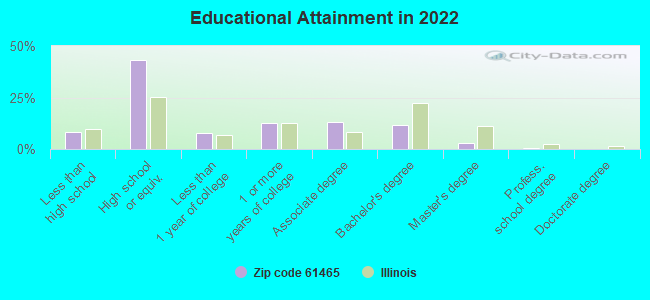
For population 25 years and over in 61465:
High school or higher: 89.6%
Bachelor's degree or higher: 15.1%
Graduate or professional degree: 3.5%
Unemployed: 1.7%
Mean travel time to work (commute): 35.3 minutes
For population 15 years and over in 61465:
Never married: 25.4%
Now married: 60.2%
Separated: 0.9%
Widowed: 4.9%
Divorced: 8.6%
Zip code 61465 compared to state average:
Median house value significantly below state average.
Unemployed percentage below state average.
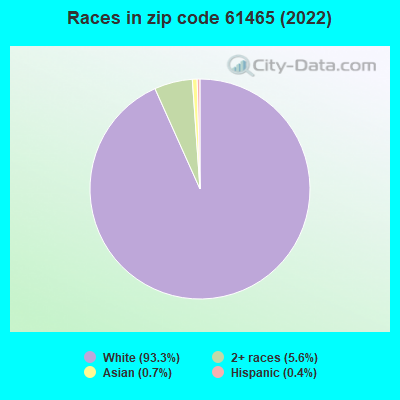
Black race population percentage significantly below state average.
Hispanic race population percentage significantly below state average.
Median age significantly above state average.
Foreign-born population percentage significantly below state average.
Renting percentage significantly below state average.
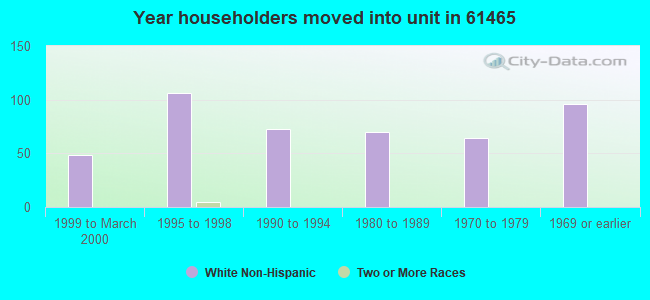
Length of stay since moving in significantly above state average.
Number of college students below state average.
Percentage of population with a bachelor's degree or higher significantly below state average.
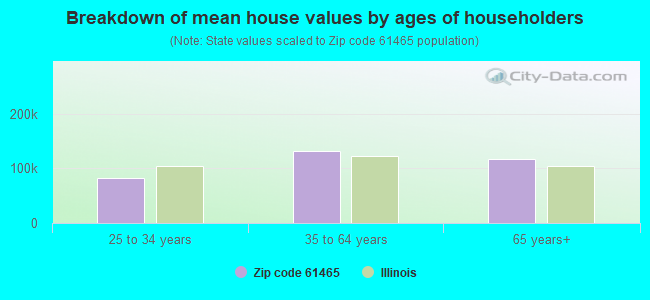
Estimated median house/condo value in 2022: $107,017
61465:
$107,017
Illinois:
$251,600
Median resident age:
This zip code:
50.3 years
Illinois median age:
39.1 years
Average household size:
This zip code:
2.4 people
Illinois:
2.4 people
Averages for the 2020 tax year for zip code 61465, filed in 2021:
Average Adjusted Gross Income (AGI) in 2020: $57,574 (Individual Income Tax Returns)
Here:
$57,574
State:
$82,626
Salary/wage: $47,228 (reported on 79.6% of returns)
Here:
$47,228
State:
$66,640
(% of AGI for various income ranges: 953.8% for AGIs below $25k, 3003.6% for AGIs $25k-50k, 6304.3% for AGIs $50k-75k, 7426.0% for AGIs $75k-100k, 19095.0% for AGIs $100k-200k)
Taxable interest for individuals: $880 (reported on 37.0% of returns)
This zip code:
$880
Illinois:
$2,376
(% of AGI for various income ranges: 13.1% for AGIs below $25k, 68.2% for AGIs $25k-50k, 12.9% for AGIs $50k-75k, 60.0% for AGIs $75k-100k, 112.5% for AGIs $100k-200k)
Ordinary dividends: $1,430 (reported on 18.5% of returns)
Here:
$1,430
State:
$9,061
(% of AGI for various income ranges: 26.2% for AGIs below $25k, 84.3% for AGIs $50k-75k, 125.0% for AGIs $100k-200k)
Net capital gain/loss in AGI: +$4,333 (reported on 16.7% of returns)
Here:
+$4,333
State:
+$31,684
(% of AGI for various income ranges: 10.8% for AGIs below $25k, 102.9% for AGIs $50k-75k, 760.0% for AGIs $100k-200k)
Profit/loss from business: +$6,983 (reported on 11.1% of returns)
Here:
+$6,983
State:
+$12,175
(% of AGI for various income ranges: 289.1% for AGIs $25k-50k, 202.0% for AGIs $75k-100k)
Taxable individual retirement arrangement distribution: $8,267 (reported on 5.6% of returns)
61465:
$8,267
Illinois:
$21,613
(% of AGI for various income ranges: 225.5% for AGIs $25k-50k)
Earned income credit: $1,962 (reported on 14.8% of returns)
Here:
$1,962
State:
$2,311
(% of AGI for various income ranges: 68.5% for AGIs below $25k, 61.8% for AGIs $25k-50k)
Percentage of individuals using paid preparers for their 2020 taxes: 96.3%
Here:
96%
State:
93%
(% for various income ranges: 100.0% for AGIs below $25k, 92.9% for AGIs $25k-50k, 88.9% for AGIs $50k-75k, 100.0% for AGIs $75k-100k, 100.0% for AGIs $100k-200k)
Averages for the 2012 tax year for zip code 61465, filed in 2013:
Average Adjusted Gross Income (AGI) in 2012: $48,780 (Individual Income Tax Returns)
Here:
$48,780
State:
$68,058
Salary/wage: $41,028 (reported on 78.3% of returns)
Here:
$41,028
State:
$55,396
(% of AGI for various income ranges: 66.5% for AGIs below $25k, 65.5% for AGIs $25k-50k, 75.9% for AGIs $50k-75k, 78.2% for AGIs $75k-100k, 47.6% for AGIs $100k-200k)
Taxable interest for individuals: $722 (reported on 38.3% of returns)
This zip code:
$722
Illinois:
$1,969
(% of AGI for various income ranges: 1.7% for AGIs below $25k, 0.7% for AGIs $25k-50k, 0.6% for AGIs $50k-75k, 0.3% for AGIs $75k-100k, 0.3% for AGIs $100k-200k)
Ordinary dividends: $757 (reported on 23.3% of returns)
Here:
$757
State:
$7,786
(% of AGI for various income ranges: 0.7% for AGIs below $25k, 0.3% for AGIs $25k-50k, 0.5% for AGIs $50k-75k, 0.3% for AGIs $75k-100k, 0.2% for AGIs $100k-200k)
Net capital gain/loss in AGI: +$2,367 (reported on 10.0% of returns)
Here:
+$2,367
State:
+$22,183
Profit/loss from business: +$6,086 (reported on 11.7% of returns)
Here:
+$6,086
State:
+$12,903
Taxable individual retirement arrangement distribution: $6,867 (reported on 10.0% of returns)
61465:
$6,867
Illinois:
$17,929
Total itemized deductions: $17,223 (21% of AGI, reported on 21.7% of returns)
Here:
$17,223
State:
$26,433
Here:
21.0% of AGI
State:
19.2% of AGI
(% of AGI for various income ranges: 8.3% for AGIs $25k-50k, 8.8% for AGIs $50k-75k, 7.7% for AGIs $75k-100k, 8.5% for AGIs $100k-200k)
Charity contributions: $2,214 (reported on 11.7% of returns)
Here:
$2,214
State:
$4,525
Taxes paid: $6,108 (reported on 21.7% of returns)
61465:
$6,108
State:
$11,968
(% of AGI for various income ranges: 1.5% for AGIs $25k-50k, 2.8% for AGIs $50k-75k, 3.1% for AGIs $75k-100k, 4.0% for AGIs $100k-200k)
Earned income credit: $2,089 (reported on 15.0% of returns)
Here:
$2,089
State:
$2,349
(% of AGI for various income ranges: 5.4% for AGIs below $25k, 1.1% for AGIs $25k-50k)
Percentage of individuals using paid preparers for their 2012 taxes: 65.0%
Here:
65%
State:
57%
(% for various income ranges: 60.0% for AGIs below $25k, 68.8% for AGIs $25k-50k, 63.6% for AGIs $50k-75k, 62.5% for AGIs $75k-100k, 80.0% for AGIs $100k-200k)
Averages for the 2004 tax year for zip code 61465, filed in 2005:
Average Adjusted Gross Income (AGI) in 2004: $36,515 (Individual Income Tax Returns)
Here:
$36,515
State:
$54,625
Salary/wage: $32,742 (reported on 81.5% of returns)
Here:
$32,742
State:
$46,811
(% of AGI for various income ranges: 126.7% for AGIs below $10k, 60.0% for AGIs $10k-25k, 74.1% for AGIs $25k-50k, 82.9% for AGIs $50k-75k, 75.4% for AGIs $75k-100k, 53.9% for AGIs over 100k)
Taxable interest for individuals: $1,060 (reported on 48.0% of returns)
This zip code:
$1,060
Illinois:
$2,101
(% of AGI for various income ranges: 7.0% for AGIs below $10k, 2.8% for AGIs $10k-25k, 1.6% for AGIs $25k-50k, 0.3% for AGIs $50k-75k, 1.6% for AGIs $75k-100k, 1.1% for AGIs over 100k)
Taxable dividends: $626 (reported on 26.1% of returns)
Here:
$626
State:
$4,306
(% of AGI for various income ranges: 4.2% for AGIs below $10k, 1.1% for AGIs $10k-25k, 0.3% for AGIs $25k-50k, 0.1% for AGIs $50k-75k, 0.4% for AGIs $75k-100k, 0.4% for AGIs over 100k)
Net capital gain/loss: +$540 (reported on 16.8% of returns)
Here:
+$540
State:
+$17,321
(% of AGI for various income ranges: 0.9% for AGIs $10k-25k, 0.5% for AGIs $25k-50k, -0.0% for AGIs $50k-75k, 0.1% for AGIs over 100k)
Profit/loss from business: +$4,013 (reported on 12.8% of returns)
Here:
+$4,013
State:
+$11,771
(% of AGI for various income ranges: -2.2% for AGIs below $10k, 4.7% for AGIs $10k-25k, 1.9% for AGIs $25k-50k, 1.3% for AGIs $50k-75k)
Profit/loss from farming: +$2,143 (reported on 8.2% of returns)
Here:
+$2,143
State:
+$2,327
Total itemized deductions: $12,433 (22% of AGI, reported on 16.3% of returns)
Here:
$12,433
State:
$20,239
Here:
21.7% of AGI
State:
19.5% of AGI
(% of AGI for various income ranges: 6.4% for AGIs $10k-25k, 5.6% for AGIs $25k-50k, 4.6% for AGIs $50k-75k, 12.4% for AGIs $75k-100k)
Charity contributions deductions: $1,559 (3% of AGI, reported on 9.9% of returns)
Here:
$1,559
State:
$3,719
Here:
3.1% of AGI
State:
3.4% of AGI
Total tax: $4,574 (reported on 74.2% of returns)
61465:
$4,574
State:
$9,882
(% of AGI for various income ranges: 2.2% for AGIs below $10k, 4.5% for AGIs $10k-25k, 6.7% for AGIs $25k-50k, 8.8% for AGIs $50k-75k, 11.1% for AGIs $75k-100k, 18.4% for AGIs over 100k)
Earned income credit: $1,423 (reported on 16.3% of returns)
Here:
$1,423
State:
$1,788
Percentage of individuals using paid preparers for their 2004 taxes: 64.1%
Here:
64%
State:
61%
(% for various income ranges: 50.9% for AGIs below $10k, 69.9% for AGIs $10k-25k, 66.3% for AGIs $25k-50k, 63.3% for AGIs $50k-75k, 64.1% for AGIs $75k-100k, 82.6% for AGIs over 100k)
Household received Food Stamps/SNAP in the past 12 months: 68 Household did not receive Food Stamps/SNAP in the past 12 months: 452
Women who had a birth in the past 12 months: 1 (1 now married, 0 unmarried) Women who did not have a birth in the past 12 months: 160 (77 now married, 82 unmarried)
Housing units in zip code 61465 with a mortgage: 218 (12 second mortgage, 12 both second mortgage and home equity loan) Houses without a mortgage: 11
Median monthly owner costs for units with a mortgage: $1,120 Median monthly owner costs for units without a mortgage: $431
Residents with income below the poverty level in 2022:
This zip code:
6.0%
Whole state:
11.9%
Residents with income below 50% of the poverty level in 2022:
This zip code:
4.3%
Whole state:
5.7%
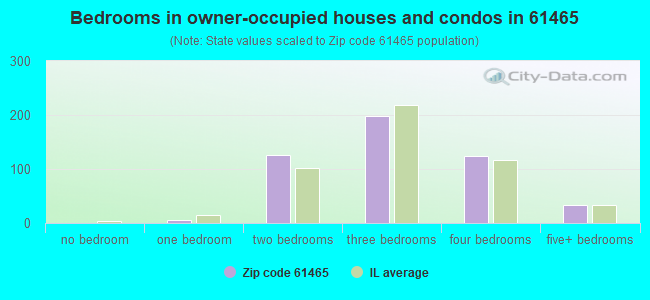
Median number of rooms in houses and condos:
Here:
6.5
State:
6.4
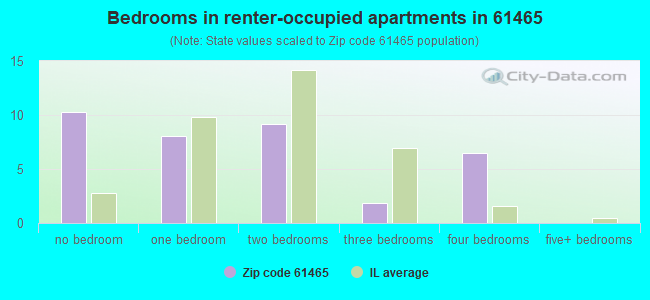
Median number of rooms in apartments:
Here:
3.5
State:
4.1
Notable locations in this zip code not listed on our city pages
Notable locations in zip code 61465: New Windsor Public Library (A), Rivoli Fire Protection District New Windsor Station (B). Display/hide their locations on the map
Cemeteries: Calvary Cemetery (1), Hopewell Cemetery (2), New Windsor Cemetery (3), Merryman Cemetery (4), Cooper Cemetery (5). Display/hide their locations on the map
Size of family households: 269 2-persons, 63 3-persons, 24 4-persons, 35 5-persons, 6 6-persons
Size of nonfamily households: 106 1-person, 14 2-persons
67 married couples with children.
109 single-parent households (98 men, 11 women).
99.7% of residents of 61465 zip code speak English at home.
0.3% of residents speak Asian or Pacific Island language at home (100% well).
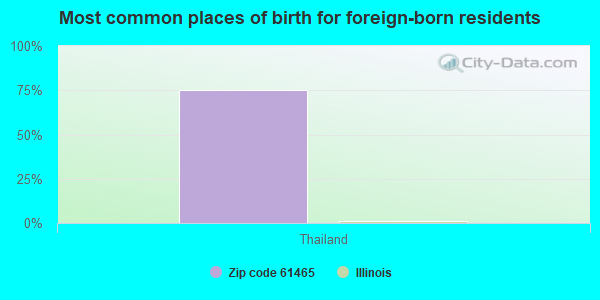
Foreign born population: 4 (0.3%) (100.0% of them are naturalized citizens)
This zip code:
0.3%
Whole state:
14.4%
75%Thailand
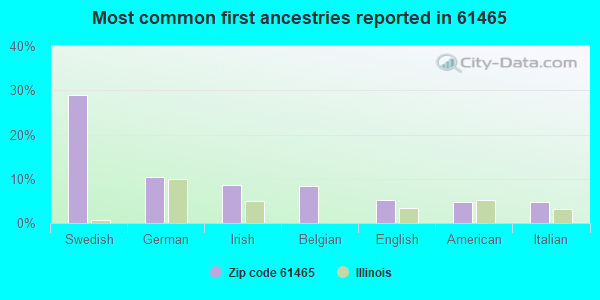
29%Swedish
10%German
9%Irish
8%Belgian
5%English
5%American
5%Italian
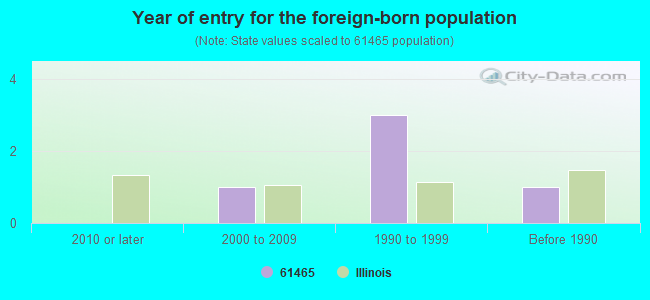
Year of entry for the foreign-born population
02010 or later
12000 to 2009
31990 to 1999
1Before 1990
Facilities with environmental interests located in this zip code:
ANR PIPELINE CO (296 N 600 AVE in NEW WINDSOR, IL)
STATE MASTER (Illinois EPA Project) - SOLID WASTE PROGRAM, AIR PROGRAM, HAZARDOUS WASTE PROGRAM, National Pollutant Discharge Elimination System Permit AIR MAJOR (AIRS/AFS) CRITERIA AND HAZARDOUS AIR POLLUTANT INVENTORY (Inventory of air pollution sources) National Pollutant Discharge Elimination System NON-MAJOR (Tracking pollutant discharge elimination systems) - permit Conditionally Exempt Small Quantity Generators, less than 100 kg/month of hazardous waste (Resource Conservation and Recovery Act (tracking hazardous waste)) - notification Business SIC classification: NATURAL GAS TRANSMISSION Business NAICS classification: PIPELINE TRANSPORTATION OF NATURAL GAS. Alternative names: ANR PIPELINE CO NEW WINDSOR, ANR PIPELINE COMPANY NEW WINDSOR STATION, ANR PIPELINE-NEW WINDSOR
ALLEN OIL CO (201 W MAIN ST in NEW WINDSOR, IL)
STATE MASTER (Illinois EPA Project) - SOLID WASTE PROGRAM, AIR PROGRAM, SCRAP TIRE MANAGEMENT AIR MINOR (AIRS/AFS) Large Quantity Generators, more that 1000 kg of hazardous waste/month (Resource Conservation and Recovery Act (tracking hazardous waste)) - notification Business SIC classification: GASOLINE SERVICE STATIONS Organizations: ALLEN MARTIN (CONTACT/OWNER)
GRAINSTORE ELEVATORS (3RD AND STATE in NEW WINDSOR, IL)
STATE MASTER (Illinois EPA Project) - AIR PROGRAM AIR MINOR (AIRS/AFS) CRITERIA AND HAZARDOUS AIR POLLUTANT INVENTORY (Inventory of air pollution sources) Business SIC classification: GRAIN AND FIELD BEANS
AT&T LONG LINES NEW WINDSOR (APPROX 1.5MI SE NEW WINDSOR in NEW WINDSOR, IL)
(Resource Conservation and Recovery Act (tracking hazardous waste)) Organizations: AMERICAN TELEPHONE AND TELEGRAPH (CONTACT/OWNER)
Housing units lacking complete plumbing facilities: 4.1% Housing units lacking complete kitchen facilities: 0.3%
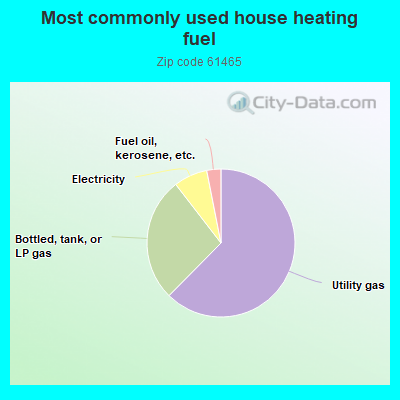
62.6%Utility gas
27.2%Bottled, tank, or LP gas
7.4%Electricity
3.1%Fuel oil, kerosene, etc.
Population in 1990: 1,171.
Place of birth for U.S.-born residents:
This state: 889
Northeast: 7
Midwest: 254
South: 25
West: 46
62% of the 61465 zip code residents lived in the same house 5 years ago. Out of people who lived in different houses, 47% lived in this county. Out of people who lived in different counties, 50% lived in Illinois.
93% of the 61465 zip code residents lived in the same house 1 year ago. Out of people who lived in different houses, 68% moved from this county. Out of people who lived in different houses, 8% moved from different county within same state. Out of people who lived in different houses, 21% moved from different state.
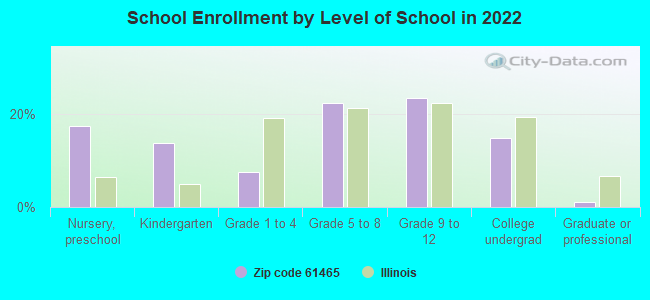
Private vs. public school enrollment:
Students in private schools in grades 1 to 8 (elementary and middle school):
Here:
0.0%
Illinois:
13.3%
Students in private schools in grades 9 to 12 (high school):
Here:
0.0%
Illinois:
9.9%
Students in private undergraduate colleges:
Here:
0.0%
Illinois:
27.4%
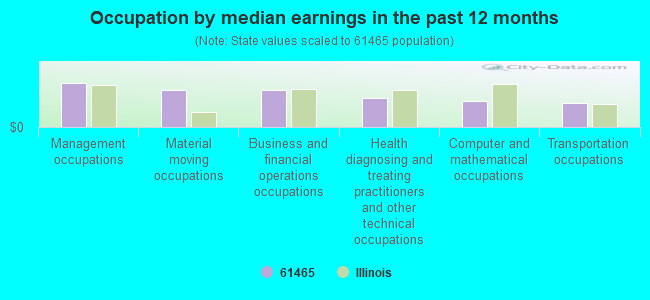
Occupation by median earnings in the past 12 months ($)
110,401Management occupations
93,984Material moving occupations
92,852Business and financial operations occupations
73,823Health diagnosing and treating practitioners and other technical occupations
65,325Computer and mathematical occupations
59,630Transportation occupations
Top industries in this zip code by the number of employees in 2005:
Finance and Insurance: Insurance Agencies and Brokerages (5-9 employees: 1 establishment)
Other Services (except Public Administration): Computer and Office Machine Repair and Maintenance (1-4: 1)
Accommodation and Food Services: Drinking Places (Alcoholic Beverages) (1-4: 1)
2002 - 2018 National Fire Incident Reporting System (NFIRS) incidents
According to the data from the years 2002 - 2018 the average number of fires per year is 12. The highest number of fires - 24 took place in 2003, and the least - 6 in 2002. The data has a constant trend.
When looking into fire subcategories, the most reports belonged to: Outside Fires (63.5%), and Structure Fires (25.1%).
Fire incident types reported to NFIRS in Zip Code 61465
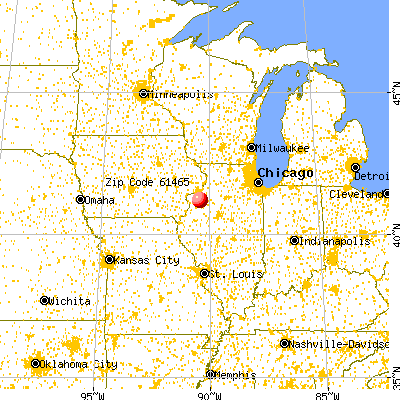


 Nearest zip codes: 61281, 61486, 61466, 61468, 61413, 61263.


 According to the data from the years 2002 - 2018 the average number of fires per year is 12. The highest number of fires - 24 took place in 2003, and the least - 6 in 2002. The data has a constant trend.
 When looking into fire subcategories, the most reports belonged to: Outside Fires (63.5%), and Structure Fires (25.1%).