Estimated zip code population in 2022: 2,890 Zip code population in 2010: 2,909 Zip code population in 2000: 2,909
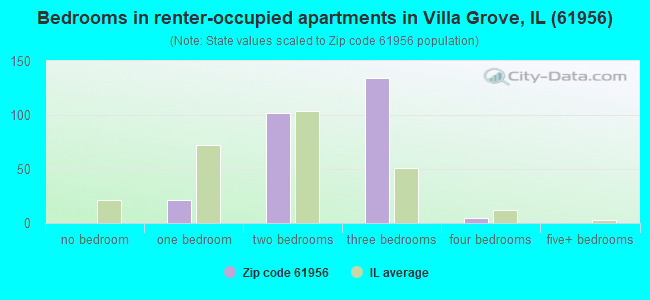
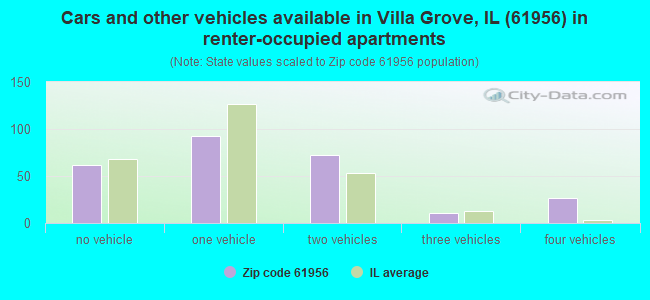
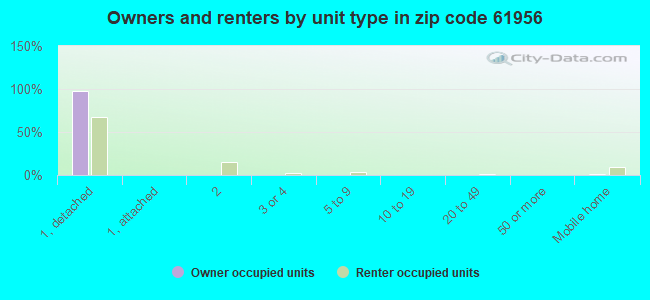
Houses and condos: 1,390 Renter-occupied apartments: 269
% of renters here:
21%
State:
33%
March 2022 cost of living index in zip code 61956: 84.2 (less than average, U.S. average is 100)
Land area: 33.8 sq. mi. Water area: 0.0 sq. mi.
Population density: 85 people per square mile
(very low).
OSM Map
General Map
Google Map
MSN Map
OSM Map
General Map
Google Map
MSN Map
OSM Map
General Map
Google Map
MSN Map
OSM Map
General Map
Google Map
MSN Map
Please wait while loading the map...
Real estate property taxes paid for housing units in 2022:
This zip code:
1.8% ($2,072)
Illinois:
2.0% ($4,912)
Median real estate property taxes paid for housing units with mortgages in 2022: $2,172 (1.7%) Median real estate property taxes paid for housing units with no mortgage in 2022: $1,818 (1.9%)
Averages for the 2020 tax year for zip code 61956, filed in 2021:
Average Adjusted Gross Income (AGI) in 2020: $53,496 (Individual Income Tax Returns)
Here:
$53,496
State:
$82,626
Salary/wage: $45,053 (reported on 80.0% of returns)
Here:
$45,053
State:
$66,640
(% of AGI for various income ranges: 1126.7% for AGIs below $25k, 3397.1% for AGIs $25k-50k, 5510.7% for AGIs $50k-75k, 9049.1% for AGIs $75k-100k, 16188.0% for AGIs $100k-200k)
Taxable interest for individuals: $1,036 (reported on 28.9% of returns)
This zip code:
$1,036
Illinois:
$2,376
(% of AGI for various income ranges: 16.7% for AGIs below $25k, 15.8% for AGIs $25k-50k, 62.7% for AGIs $50k-75k, 30.0% for AGIs $75k-100k, 173.0% for AGIs $100k-200k)
Ordinary dividends: $3,016 (reported on 14.1% of returns)
Here:
$3,016
State:
$9,061
(% of AGI for various income ranges: 16.1% for AGIs below $25k, 15.5% for AGIs $25k-50k, 67.3% for AGIs $50k-75k, 47.3% for AGIs $75k-100k, 319.0% for AGIs $100k-200k)
Net capital gain/loss in AGI: +$4,900 (reported on 12.6% of returns)
Here:
+$4,900
State:
+$31,684
(% of AGI for various income ranges: 1.8% for AGIs below $25k, 21.9% for AGIs $25k-50k, 60.0% for AGIs $50k-75k, 67.3% for AGIs $75k-100k, 595.0% for AGIs $100k-200k)
Profit/loss from business: +$9,167 (reported on 13.3% of returns)
Here:
+$9,167
State:
+$12,175
(% of AGI for various income ranges: 65.8% for AGIs below $25k, 80.6% for AGIs $25k-50k, 186.0% for AGIs $50k-75k, 293.6% for AGIs $75k-100k, 581.0% for AGIs $100k-200k)
Taxable individual retirement arrangement distribution: $13,579 (reported on 10.4% of returns)
61956:
$13,579
Illinois:
$21,613
(% of AGI for various income ranges: 64.8% for AGIs below $25k, 98.4% for AGIs $25k-50k, 321.3% for AGIs $50k-75k, 900.0% for AGIs $100k-200k)
Total itemized deductions: $20,000 (reported on 2.2% of returns)
Here:
$20,000
State:
$34,948
(% of AGI for various income ranges: 193.5% for AGIs $25k-50k)
Taxes paid: $6,550 (reported on 1.5% of returns)
61956:
$6,550
State:
$8,563
(% of AGI for various income ranges: 42.3% for AGIs $25k-50k)
Earned income credit: $2,273 (reported on 16.3% of returns)
Here:
$2,273
State:
$2,311
(% of AGI for various income ranges: 93.0% for AGIs below $25k, 62.3% for AGIs $25k-50k)
Percentage of individuals using paid preparers for their 2020 taxes: 94.8%
Here:
95%
State:
93%
(% for various income ranges: 93.2% for AGIs below $25k, 97.3% for AGIs $25k-50k, 95.0% for AGIs $50k-75k, 93.3% for AGIs $75k-100k, 94.7% for AGIs $100k-200k)
Averages for the 2012 tax year for zip code 61956, filed in 2013:
Average Adjusted Gross Income (AGI) in 2012: $45,952 (Individual Income Tax Returns)
Here:
$45,952
State:
$68,058
Salary/wage: $38,823 (reported on 83.3% of returns)
Here:
$38,823
State:
$55,396
(% of AGI for various income ranges: 71.8% for AGIs below $25k, 76.5% for AGIs $25k-50k, 77.8% for AGIs $50k-75k, 75.6% for AGIs $75k-100k, 56.5% for AGIs $100k-200k)
Taxable interest for individuals: $1,121 (reported on 34.1% of returns)
This zip code:
$1,121
Illinois:
$1,969
(% of AGI for various income ranges: 1.6% for AGIs below $25k, 0.7% for AGIs $25k-50k, 0.3% for AGIs $50k-75k, 1.2% for AGIs $75k-100k, 0.9% for AGIs $100k-200k)
Ordinary dividends: $1,400 (reported on 15.9% of returns)
Here:
$1,400
State:
$7,786
(% of AGI for various income ranges: 0.8% for AGIs below $25k, 0.5% for AGIs $25k-50k, 0.3% for AGIs $50k-75k, 0.5% for AGIs $75k-100k, 0.5% for AGIs $100k-200k)
Net capital gain/loss in AGI: +$938 (reported on 9.4% of returns)
Here:
+$938
State:
+$22,183
(% of AGI for various income ranges: 0.1% for AGIs below $25k, 0.5% for AGIs $100k-200k)
Profit/loss from business: +$6,917 (reported on 13.0% of returns)
Here:
+$6,917
State:
+$12,903
(% of AGI for various income ranges: 4.1% for AGIs below $25k, 1.5% for AGIs $25k-50k, 1.9% for AGIs $50k-75k, 2.7% for AGIs $100k-200k)
Taxable individual retirement arrangement distribution: $10,669 (reported on 11.6% of returns)
61956:
$10,669
Illinois:
$17,929
(% of AGI for various income ranges: 2.9% for AGIs below $25k, 1.7% for AGIs $25k-50k, 4.5% for AGIs $50k-75k, 3.4% for AGIs $100k-200k)
Total itemized deductions: $16,687 (20% of AGI, reported on 21.7% of returns)
Here:
$16,687
State:
$26,433
Here:
20.1% of AGI
State:
19.2% of AGI
(% of AGI for various income ranges: 6.8% for AGIs below $25k, 5.5% for AGIs $25k-50k, 6.7% for AGIs $50k-75k, 9.8% for AGIs $75k-100k, 9.8% for AGIs $100k-200k)
Charity contributions: $3,220 (reported on 14.5% of returns)
Here:
$3,220
State:
$4,525
(% of AGI for various income ranges: 0.7% for AGIs $25k-50k, 0.5% for AGIs $50k-75k, 0.9% for AGIs $75k-100k, 2.1% for AGIs $100k-200k)
Taxes paid: $6,217 (reported on 21.7% of returns)
61956:
$6,217
State:
$11,968
(% of AGI for various income ranges: 1.0% for AGIs below $25k, 1.8% for AGIs $25k-50k, 2.3% for AGIs $50k-75k, 3.6% for AGIs $75k-100k, 4.6% for AGIs $100k-200k)
Earned income credit: $2,127 (reported on 18.8% of returns)
Here:
$2,127
State:
$2,349
(% of AGI for various income ranges: 6.4% for AGIs below $25k, 1.0% for AGIs $25k-50k)
Percentage of individuals using paid preparers for their 2012 taxes: 57.2%
Here:
57%
State:
57%
(% for various income ranges: 51.9% for AGIs below $25k, 55.9% for AGIs $25k-50k, 64.0% for AGIs $50k-75k, 61.5% for AGIs $75k-100k, 66.7% for AGIs $100k-200k)
Averages for the 2004 tax year for zip code 61956, filed in 2005:
Average Adjusted Gross Income (AGI) in 2004: $34,495 (Individual Income Tax Returns)
Here:
$34,495
State:
$54,625
Salary/wage: $31,063 (reported on 85.8% of returns)
Here:
$31,063
State:
$46,811
(% of AGI for various income ranges: 98.0% for AGIs below $10k, 69.3% for AGIs $10k-25k, 78.7% for AGIs $25k-50k, 80.2% for AGIs $50k-75k, 81.7% for AGIs $75k-100k, 62.9% for AGIs over 100k)
Taxable interest for individuals: $1,690 (reported on 42.1% of returns)
This zip code:
$1,690
Illinois:
$2,101
(% of AGI for various income ranges: 4.3% for AGIs below $10k, 4.1% for AGIs $10k-25k, 1.5% for AGIs $25k-50k, 1.9% for AGIs $50k-75k, 1.1% for AGIs $75k-100k, 2.7% for AGIs over 100k)
Taxable dividends: $1,254 (reported on 17.0% of returns)
Here:
$1,254
State:
$4,306
(% of AGI for various income ranges: 2.3% for AGIs below $10k, 0.6% for AGIs $10k-25k, 0.5% for AGIs $25k-50k, 0.3% for AGIs $50k-75k, 0.8% for AGIs $75k-100k, 1.1% for AGIs over 100k)
Net capital gain/loss: +$2,169 (reported on 13.2% of returns)
Here:
+$2,169
State:
+$17,321
(% of AGI for various income ranges: -0.8% for AGIs below $10k, 0.2% for AGIs $10k-25k, 0.6% for AGIs $25k-50k, 0.9% for AGIs $50k-75k, 0.2% for AGIs $75k-100k, 3.2% for AGIs over 100k)
Profit/loss from business: +$2,570 (reported on 11.5% of returns)
Here:
+$2,570
State:
+$11,771
(% of AGI for various income ranges: -5.4% for AGIs below $10k, 3.1% for AGIs $10k-25k, 1.7% for AGIs $25k-50k, 0.3% for AGIs $50k-75k, 0.4% for AGIs $75k-100k)
Profit/loss from farming: +$310 (reported on 2.0% of returns)
Here:
+$310
State:
+$2,327
IRA payment deduction: $3,333 (reported on 1.7% of returns)
61956:
$3,333
Illinois:
$3,087
Total itemized deductions: $12,969 (21% of AGI, reported on 17.7% of returns)
Here:
$12,969
State:
$20,239
Here:
21.5% of AGI
State:
19.5% of AGI
(% of AGI for various income ranges: 5.0% for AGIs $10k-25k, 5.6% for AGIs $25k-50k, 6.9% for AGIs $50k-75k, 10.4% for AGIs $75k-100k, 6.6% for AGIs over 100k)
Charity contributions deductions: $2,469 (4% of AGI, reported on 13.5% of returns)
Here:
$2,469
State:
$3,719
Here:
3.8% of AGI
State:
3.4% of AGI
(% of AGI for various income ranges: 0.3% for AGIs $10k-25k, 0.5% for AGIs $25k-50k, 1.3% for AGIs $50k-75k, 1.6% for AGIs $75k-100k, 1.3% for AGIs over 100k)
Total tax: $3,921 (reported on 74.2% of returns)
61956:
$3,921
State:
$9,882
(% of AGI for various income ranges: 2.1% for AGIs below $10k, 4.1% for AGIs $10k-25k, 6.5% for AGIs $25k-50k, 8.6% for AGIs $50k-75k, 10.2% for AGIs $75k-100k, 16.4% for AGIs over 100k)
Earned income credit: $1,589 (reported on 13.7% of returns)
Here:
$1,589
State:
$1,788
Percentage of individuals using paid preparers for their 2004 taxes: 59.5%
Here:
59%
State:
61%
(% for various income ranges: 47.6% for AGIs below $10k, 57.8% for AGIs $10k-25k, 61.3% for AGIs $25k-50k, 68.9% for AGIs $50k-75k, 67.4% for AGIs $75k-100k, 70.0% for AGIs over 100k)
Household received Food Stamps/SNAP in the past 12 months: 165 Household did not receive Food Stamps/SNAP in the past 12 months: 1,105
Women who had a birth in the past 12 months: 36 (11 now married, 25 unmarried) Women who did not have a birth in the past 12 months: 595 (312 now married, 279 unmarried)
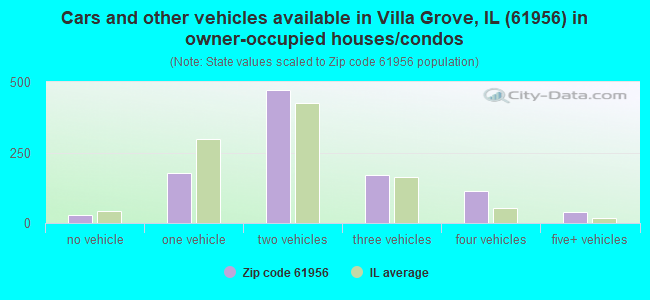
Housing units in zip code 61956 with a mortgage: 614 (42 second mortgage, 18 both second mortgage and home equity loan) Houses without a mortgage: 24
Median monthly owner costs for units with a mortgage: $1,070 Median monthly owner costs for units without a mortgage: $526
Residents with income below the poverty level in 2022:
This zip code:
7.8%
Whole state:
11.9%
Residents with income below 50% of the poverty level in 2022:
This zip code:
3.6%
Whole state:
5.7%
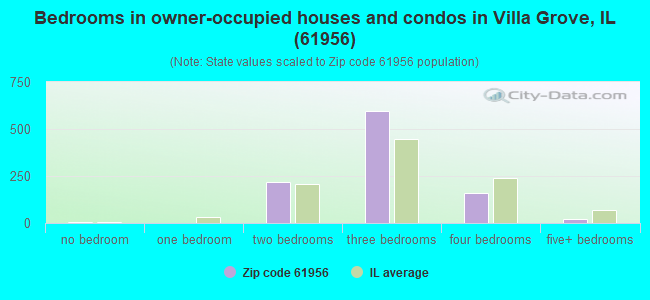
Median number of rooms in houses and condos:
Here:
6.2
State:
6.4
Median number of rooms in apartments:
Here:
4.6
State:
4.1
Notable locations in this zip code not listed on our city pages
Notable locations in zip code 61956: Villa Grove Community Building (A), Camargo Township Library (B), Villa Grove Fire Department (C), Carle Health Care Ambulance (D). Display/hide their locations on the map
Churches in zip code 61956 include: First Christian Church (A), Living Hope Fellowship Church (B), Sacred Heart Catholic Church (C), Immaculate Conception Church (D). Display/hide their locations on the map
Size of family households: 374 2-persons, 179 3-persons, 190 4-persons, 45 5-persons, 34 6-persons
Size of nonfamily households: 339 1-person, 84 2-persons, 25 3-persons
399 married couples with children.
126 single-parent households (70 men, 56 women).
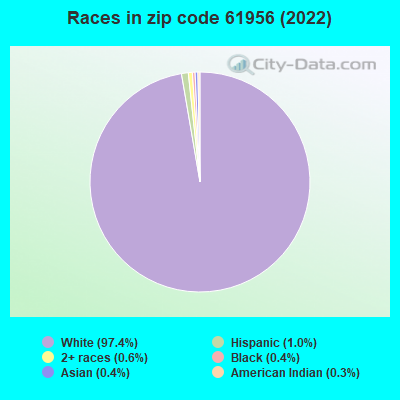
96.7% of residents of 61956 zip code speak English at home.
0.9% of residents speak Spanish at home (12% very well, 88% not well).
1.5% of residents speak other Indo-European language at home (73% very well, 20% well, 7% not well).
0.4% of residents speak Asian or Pacific Island language at home (100% well).
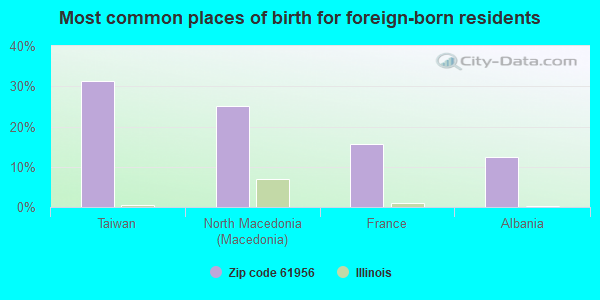
Foreign born population: 32 (1.1%) (28.3% of them are naturalized citizens)
This zip code:
1.1%
Whole state:
14.4%
31%Taiwan
25%North Macedonia (Macedonia)
16%France
12%Albania
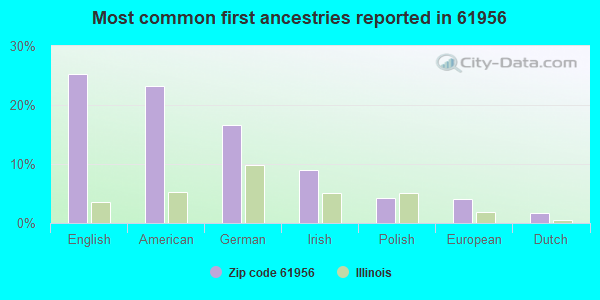
25%English
23%American
17%German
9%Irish
4%Polish
4%European
2%Dutch
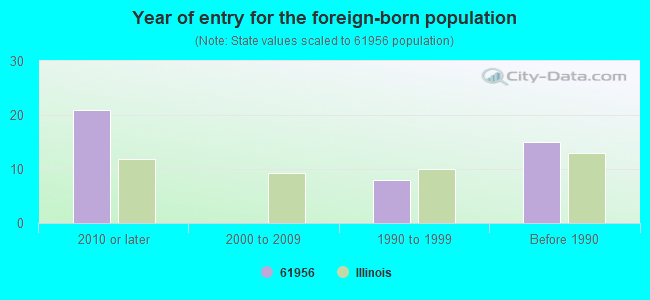
Year of entry for the foreign-born population
212010 or later
02000 to 2009
81990 to 1999
15Before 1990
Facilities with environmental interests located in this zip code:
MULTI-COUNTY LANDFILL (RR 1 N OF VILLA GROVE in VILLA GROVE, IL)
STATE MASTER (Illinois EPA Project) - SOLID WASTE PROGRAM, HAZARDOUS WASTE PROGRAM CRITERIA AND HAZARDOUS AIR POLLUTANT INVENTORY (Inventory of air pollution sources) HAZARDOUS WASTE BIENNIAL REPORTER (Resource Conservation and Recovery Act (tracking hazardous waste)) Large Quantity Generators, more that 1000 kg of hazardous waste/month (Resource Conservation and Recovery Act (tracking hazardous waste)) - notification Business SIC classification: REFUSE SYSTEMS Business NAICS classification: SOLID WASTE LANDFILL. Organizations: GILMER JAMES (CONTACT/OWNER)
PANGBURN OIL INC (FRONT in VILLA GROVE, IL)
STATE MASTER (Illinois EPA Project) - AIR PROGRAM AIR MINOR (AIRS/AFS) CRITERIA AND HAZARDOUS AIR POLLUTANT INVENTORY (Inventory of air pollution sources) Business SIC classification: PETROLEUM BULK STATIONS AND TERMINALS
CITY OF VILLA GROVE (200 N MAIN ST in VILLA GROVE, IL)
STATE MASTER (Illinois EPA Project) - AIR PROGRAM AIR MINOR (AIRS/AFS) CRITERIA AND HAZARDOUS AIR POLLUTANT INVENTORY (Inventory of air pollution sources) Business SIC classification: CRUSHED AND BROKEN LIMESTONE Alternative names: CITY OF VILLA GROVE WATER PLANT
PAULS MACHINE AND WELDING CORP (RR 1 BOX 53 in VILLA GROVE, IL)
STATE MASTER (Illinois EPA Project) - SOLID WASTE PROGRAM, HAZARDOUS WASTE PROGRAM, AIR PROGRAM AIR MINOR (AIRS/AFS) Business SIC classification: FARM MACHINERY AND EQUIPMENT
ILLINI FS.,INC. (RR 1 in VILLA GROVE, IL)
AIR MINOR (AIRS/AFS) (Resource Conservation and Recovery Act (tracking hazardous waste)) Business SIC classification: FARM SUPPLIES Organizations: ILLINI FS INC (CONTACT/OWNER)
KAISER AGRICULTURAL CHEMICALS (5MI NE ON RR 1 in VILLA GROVE, IL)
(Resource Conservation and Recovery Act (tracking hazardous waste))
PANHANDLE EASTERN VILLAGROVE (6PT 5MI W EDGE VILLA GROVE in VILLA GROVE, IL)
(Resource Conservation and Recovery Act (tracking hazardous waste)) Organizations: PANHANDLE EASTERN GAS PIPELINE (CONTACT/OWNER)
ILLINI FS, INC. - VILLA GROVE NH3 (1710 E COUNTY RD 1450 N in VILLA GROVE, IL)
Small Quantity Generators, between 100 kg and 1000 kg of hazardous waste/month (Resource Conservation and Recovery Act (tracking hazardous waste))
PAULS MACHINE AND WELDING CORP (RTE 130 in VILLA GROVE, IL)
Small Quantity Generators, between 100 kg and 1000 kg of hazardous waste/month (Resource Conservation and Recovery Act (tracking hazardous waste)) Organizations: CLER ED (CONTACT/OWNER)
MAYNARDS AUTO BODY (1653 CTY RD 200 N in VILLA GROVE, IL)
Small Quantity Generators, between 100 kg and 1000 kg of hazardous waste/month (Resource Conservation and Recovery Act (tracking hazardous waste)) - notification Organizations: TONDINI MAYNARD (CONTACT/OWNER)
Housing units lacking complete plumbing facilities: 1.1% Housing units lacking complete kitchen facilities: 1.1%
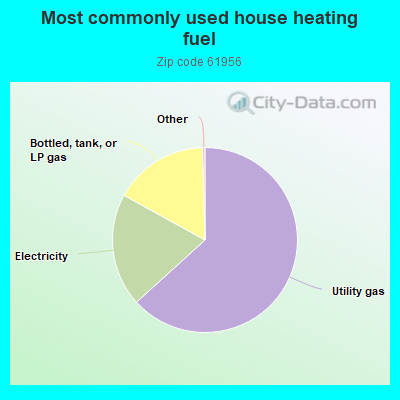
63.4%Utility gas
19.8%Electricity
16.6%Bottled, tank, or LP gas
Population in 1990: 3,259.
Place of birth for U.S.-born residents:
This state: 2,406
Northeast: 18
Midwest: 227
South: 101
West: 83
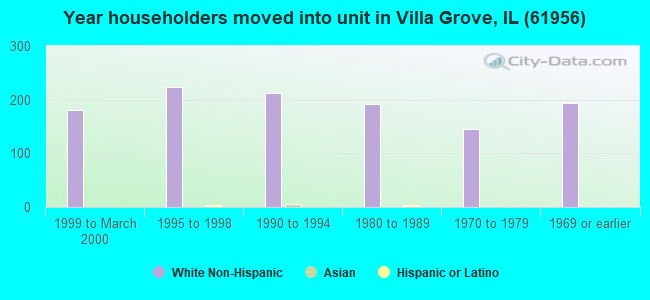
63% of the 61956 zip code residents lived in the same house 5 years ago. Out of people who lived in different houses, 52% lived in this county. Out of people who lived in different counties, 50% lived in Illinois.
91% of the 61956 zip code residents lived in the same house 1 year ago. Out of people who lived in different houses, 70% moved from this county. Out of people who lived in different houses, 16% moved from different county within same state. Out of people who lived in different houses, 11% moved from different state.
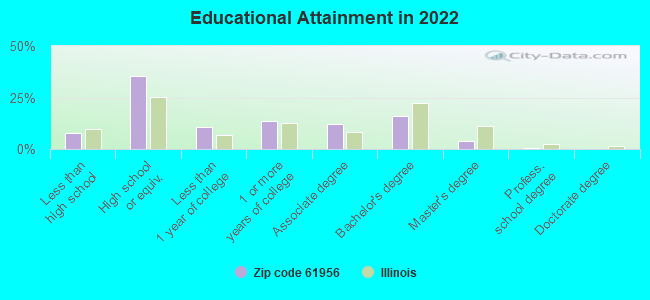
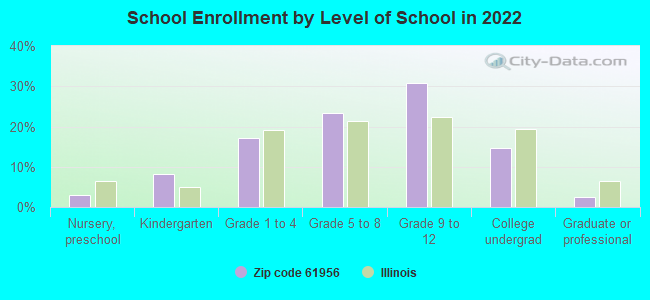
Private vs. public school enrollment:
Students in private schools in grades 1 to 8 (elementary and middle school): 34
Here:
13.6%
Illinois:
13.3%
Students in private schools in grades 9 to 12 (high school): 8
Here:
4.6%
Illinois:
9.9%
Students in private undergraduate colleges: 14
Here:
15.8%
Illinois:
27.4%
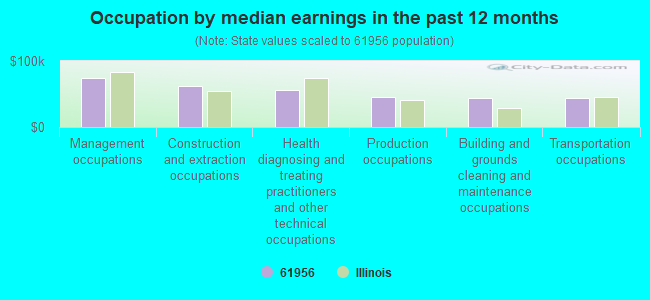
Occupation by median earnings in the past 12 months ($)
74,654Management occupations
61,375Construction and extraction occupations
56,774Health diagnosing and treating practitioners and other technical occupations
45,366Production occupations
44,502Building and grounds cleaning and maintenance occupations
44,116Transportation occupations
Top industries in this zip code by the number of employees in 2005:
Finance and Insurance: Commercial Banking (20-49: 1, 1-4: 1)
Construction: Plumbing, Heating, and Air-Conditioning Contractors (20-49: 1, 1-4: 1)
Construction: New Single-Family Housing Construction (except Operative Builders) (10-19: 1, 1-4: 1)
Information: Newspaper Publishers (10-19: 1)
Construction: Residential Remodelers (10-19: 1)
Finance and Insurance: Direct Property and Casualty Insurance Carriers (10-19: 1)
Other Services (except Public Administration): Religious Organizations (5-9: 1, 1-4: 2)
People in group quarters in 2000:
7 people in other group homes
4 people in other noninstitutional group quarters
Fatal accident statistics in 2012:
Fatal accident count: 2
Vehicles involved in fatal accidents: 3
Fatal accidents caused by drunken drivers: 1
Fatalities: 2
Persons involved in fatal accidents: 3
Pedestrians involved in fatal accidents: 0
2002 - 2018 National Fire Incident Reporting System (NFIRS) incidents
Based on the data from the years 2002 - 2018 the average number of fires per year is 15. The highest number of reported fire incidents - 36 took place in 2011, and the least - 1 in 2003. The data has a growing trend.
When looking into fire subcategories, the most reports belonged to: Structure Fires (53.3%), and Outside Fires (31.9%).
Fire incident types reported to NFIRS in Zip Code 61956


 Nearest zip codes: 61919, 61852, 61941, 61864, 61942, 61877.
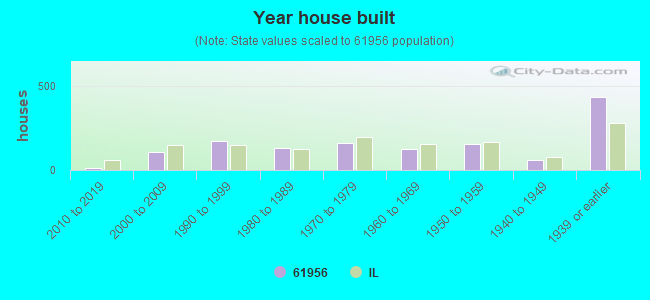


 Based on the data from the years 2002 - 2018 the average number of fires per year is 15. The highest number of reported fire incidents - 36 took place in 2011, and the least - 1 in 2003. The data has a growing trend.
 When looking into fire subcategories, the most reports belonged to: Structure Fires (53.3%), and Outside Fires (31.9%).