Estimated zip code population in 2022: 1,196 Zip code population in 2010: 1,087 Zip code population in 2000: 1,164
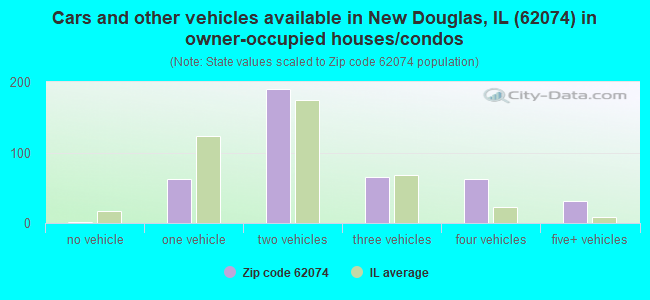
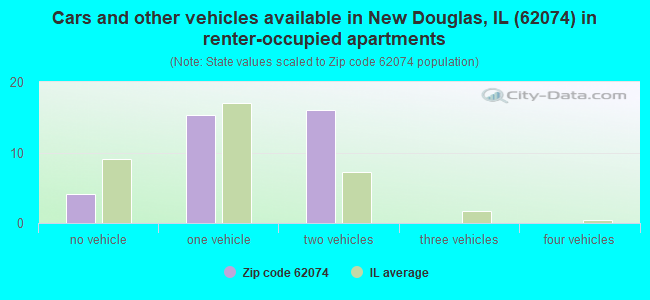
Houses and condos: 463 Renter-occupied apartments: 36
% of renters here:
8%
State:
33%
March 2022 cost of living index in zip code 62074: 94.7 (less than average, U.S. average is 100)
Land area: 41.5 sq. mi. Water area: 0.2 sq. mi.
Population density: 29 people per square mile
(very low).
OSM Map
General Map
Google Map
MSN Map
OSM Map
General Map
Google Map
MSN Map
OSM Map
General Map
Google Map
MSN Map
OSM Map
General Map
Google Map
MSN Map
Please wait while loading the map...
Real estate property taxes paid for housing units in 2022:
This zip code:
1.3% ($3,448)
Illinois:
2.0% ($4,912)
Median real estate property taxes paid for housing units with mortgages in 2022: $4,066 (1.4%) Median real estate property taxes paid for housing units with no mortgage in 2022: $2,208 (1.5%)
Business Search- 14 Million verified businesses
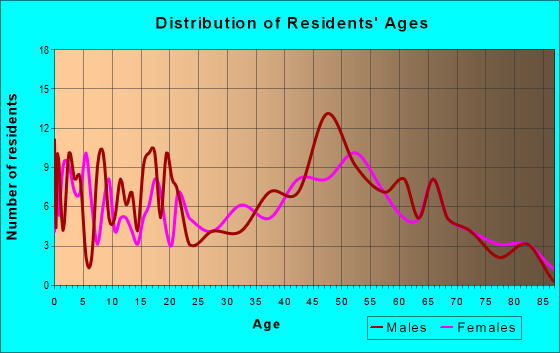
Males: 570
(47.7%)
Females: 625
(52.3%)
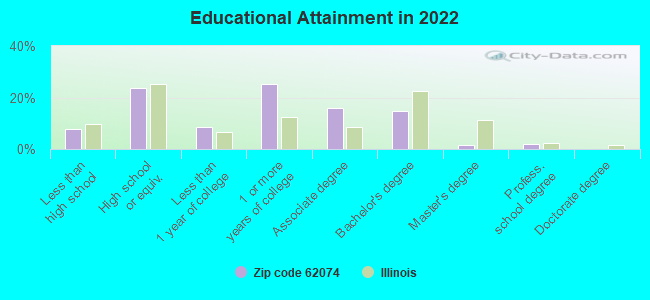
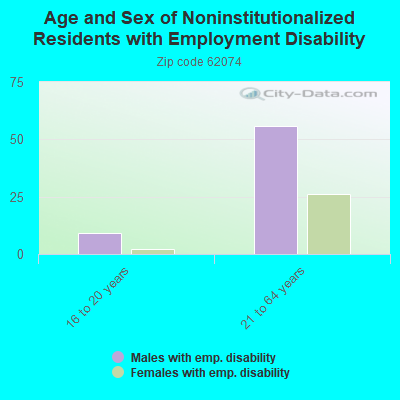
For population 25 years and over in 62074:
High school or higher: 91.0%
Bachelor's degree or higher: 18.6%
Graduate or professional degree: 4.0%
Unemployed: 0.2%
Mean travel time to work (commute): 32.6 minutes
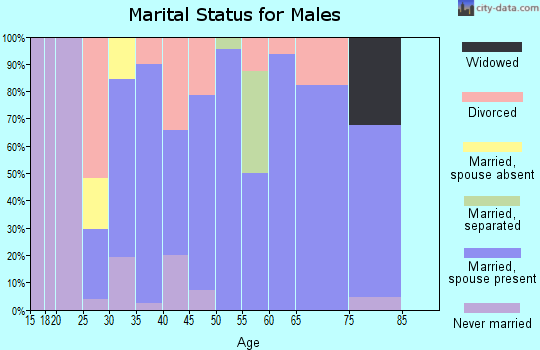
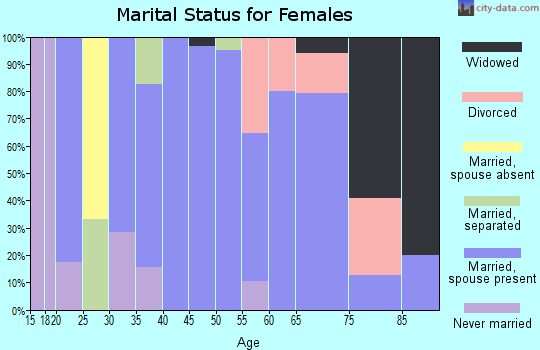
For population 15 years and over in 62074:
Never married: 16.8%
Now married: 71.0%
Separated: 0.1%
Widowed: 4.1%
Divorced: 8.0%
Zip code 62074 compared to state average:
Unemployed percentage significantly below state average.
Black race population percentage significantly below state average.
Hispanic race population percentage significantly below state average.
Median age above state average.
Foreign-born population percentage significantly below state average.
Renting percentage significantly below state average.
Length of stay since moving in significantly above state average.
Number of college students significantly below state average.
Percentage of population with a bachelor's degree or higher below state average.
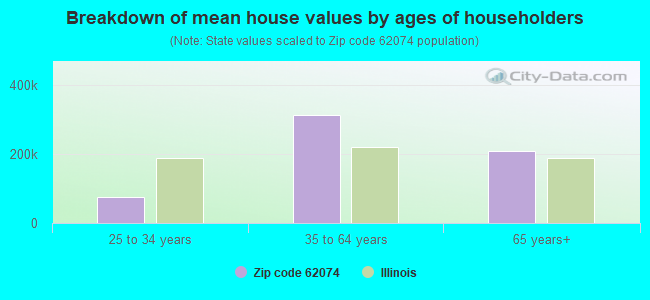
Estimated median house/condo value in 2022: $261,491
62074:
$261,491
Illinois:
$251,600
According to our research of Illinois and other state lists, there was 1 registered sex offender living in 62074 zip code as of April 26, 2024. The ratio of all residents to sex offenders in zip code 62074 is 1,491 to 1. The ratio of registered sex offenders to all residents in this zip code is lower than the state average.
Median resident age:
This zip code:
44.5 years
Illinois median age:
39.1 years
Average household size:
This zip code:
2.6 people
Illinois:
2.4 people
Averages for the 2020 tax year for zip code 62074, filed in 2021:
Average Adjusted Gross Income (AGI) in 2020: $69,117 (Individual Income Tax Returns)
Here:
$69,117
State:
$82,626
Salary/wage: $58,868 (reported on 78.7% of returns)
Here:
$58,868
State:
$66,640
(% of AGI for various income ranges: 1069.0% for AGIs below $25k, 3246.7% for AGIs $25k-50k, 6011.7% for AGIs $50k-75k, 9412.5% for AGIs $75k-100k, 18986.7% for AGIs $100k-200k)
Taxable interest for individuals: $1,414 (reported on 44.7% of returns)
This zip code:
$1,414
Illinois:
$2,376
(% of AGI for various income ranges: 38.0% for AGIs below $25k, 5.0% for AGIs $25k-50k, 73.3% for AGIs $50k-75k, 47.5% for AGIs $75k-100k, 321.7% for AGIs $100k-200k)
Ordinary dividends: $3,818 (reported on 23.4% of returns)
Here:
$3,818
State:
$9,061
(% of AGI for various income ranges: 48.0% for AGIs below $25k, 93.3% for AGIs $50k-75k, 526.7% for AGIs $100k-200k)
Net capital gain/loss in AGI: +$10,600 (reported on 19.1% of returns)
Here:
+$10,600
State:
+$31,684
(% of AGI for various income ranges: 45.0% for AGIs below $25k, 113.3% for AGIs $50k-75k, 1401.7% for AGIs $100k-200k)
Profit/loss from business: +$3,150 (reported on 8.5% of returns)
Here:
+$3,150
State:
+$12,175
(% of AGI for various income ranges: 31.0% for AGIs below $25k, 158.3% for AGIs $50k-75k)
Taxable individual retirement arrangement distribution: $15,450 (reported on 12.8% of returns)
62074:
$15,450
Illinois:
$21,613
(% of AGI for various income ranges: 301.0% for AGIs below $25k, 1565.0% for AGIs $75k-100k)
Earned income credit: $2,080 (reported on 10.6% of returns)
Here:
$2,080
State:
$2,311
(% of AGI for various income ranges: 104.0% for AGIs below $25k)
Percentage of individuals using paid preparers for their 2020 taxes: 95.7%
Here:
96%
State:
93%
(% for various income ranges: 92.9% for AGIs below $25k, 100.0% for AGIs $25k-50k, 100.0% for AGIs $50k-75k, 100.0% for AGIs $75k-100k, 90.9% for AGIs $100k-200k)
Averages for the 2012 tax year for zip code 62074, filed in 2013:
Average Adjusted Gross Income (AGI) in 2012: $50,649 (Individual Income Tax Returns)
Here:
$50,649
State:
$68,058
Salary/wage: $45,973 (reported on 75.5% of returns)
Here:
$45,973
State:
$55,396
(% of AGI for various income ranges: 62.0% for AGIs below $25k, 63.1% for AGIs $25k-50k, 69.0% for AGIs $50k-75k, 82.6% for AGIs $75k-100k, 63.9% for AGIs $100k-200k)
Taxable interest for individuals: $1,154 (reported on 49.0% of returns)
This zip code:
$1,154
Illinois:
$1,969
(% of AGI for various income ranges: 1.9% for AGIs below $25k, 1.9% for AGIs $25k-50k, 1.4% for AGIs $50k-75k, 0.2% for AGIs $75k-100k, 1.0% for AGIs $100k-200k)
Ordinary dividends: $1,955 (reported on 22.4% of returns)
Here:
$1,955
State:
$7,786
(% of AGI for various income ranges: 0.8% for AGIs $25k-50k, 1.7% for AGIs $50k-75k, 1.1% for AGIs $100k-200k)
Net capital gain/loss in AGI: +$1,388 (reported on 16.3% of returns)
Here:
+$1,388
State:
+$22,183
(% of AGI for various income ranges: 0.8% for AGIs $50k-75k, 1.5% for AGIs $75k-100k)
Profit/loss from business: +$3,567 (reported on 12.2% of returns)
Here:
+$3,567
State:
+$12,903
Taxable individual retirement arrangement distribution: $9,060 (reported on 10.2% of returns)
62074:
$9,060
Illinois:
$17,929
Total itemized deductions: $19,662 (22% of AGI, reported on 26.5% of returns)
Here:
$19,662
State:
$26,433
Here:
22.0% of AGI
State:
19.2% of AGI
(% of AGI for various income ranges: 17.5% for AGIs below $25k, 11.2% for AGIs $50k-75k, 13.8% for AGIs $75k-100k, 10.4% for AGIs $100k-200k)
Charity contributions: $1,927 (reported on 22.4% of returns)
Here:
$1,927
State:
$4,525
(% of AGI for various income ranges: 1.3% for AGIs $50k-75k, 0.9% for AGIs $75k-100k, 1.0% for AGIs $100k-200k)
Taxes paid: $7,223 (reported on 26.5% of returns)
62074:
$7,223
State:
$11,968
(% of AGI for various income ranges: 2.7% for AGIs below $25k, 3.8% for AGIs $50k-75k, 4.3% for AGIs $75k-100k, 5.3% for AGIs $100k-200k)
Earned income credit: $2,320 (reported on 10.2% of returns)
Here:
$2,320
State:
$2,349
(% of AGI for various income ranges: 3.9% for AGIs below $25k, 1.1% for AGIs $25k-50k)
Percentage of individuals using paid preparers for their 2012 taxes: 61.2%
Here:
61%
State:
57%
(% for various income ranges: 50.0% for AGIs below $25k, 60.0% for AGIs $25k-50k, 66.7% for AGIs $50k-75k, 66.7% for AGIs $75k-100k, 83.3% for AGIs $100k-200k)
Averages for the 2004 tax year for zip code 62074, filed in 2005:
Average Adjusted Gross Income (AGI) in 2004: $37,066 (Individual Income Tax Returns)
Here:
$37,066
State:
$54,625
Salary/wage: $35,027 (reported on 80.4% of returns)
Here:
$35,027
State:
$46,811
(% of AGI for various income ranges: 85.9% for AGIs below $10k, 67.1% for AGIs $10k-25k, 79.1% for AGIs $25k-50k, 79.7% for AGIs $50k-75k, 74.5% for AGIs $75k-100k, 71.1% for AGIs over 100k)
Taxable interest for individuals: $1,536 (reported on 50.6% of returns)
This zip code:
$1,536
Illinois:
$2,101
(% of AGI for various income ranges: 12.8% for AGIs below $10k, 5.2% for AGIs $10k-25k, 2.3% for AGIs $25k-50k, 0.8% for AGIs $50k-75k, 0.6% for AGIs $75k-100k, 1.9% for AGIs over 100k)
Taxable dividends: $1,216 (reported on 24.2% of returns)
Here:
$1,216
State:
$4,306
(% of AGI for various income ranges: 5.4% for AGIs below $10k, 0.7% for AGIs $10k-25k, 1.0% for AGIs $25k-50k, 0.4% for AGIs $50k-75k, 1.2% for AGIs $75k-100k)
Net capital gain/loss: +$2,660 (reported on 18.2% of returns)
Here:
+$2,660
State:
+$17,321
(% of AGI for various income ranges: -0.4% for AGIs below $10k, 1.8% for AGIs $10k-25k, 1.2% for AGIs $25k-50k, 2.2% for AGIs $50k-75k, 1.0% for AGIs $75k-100k)
Profit/loss from business: +$2,724 (reported on 11.2% of returns)
Here:
+$2,724
State:
+$11,771
(% of AGI for various income ranges: -6.7% for AGIs below $10k, 0.9% for AGIs $25k-50k, 2.5% for AGIs $50k-75k, 0.3% for AGIs $75k-100k)
IRA payment deduction: $2,000 (reported on 3.3% of returns)
62074:
$2,000
Illinois:
$3,087
Total itemized deductions: $16,496 (26% of AGI, reported on 21.9% of returns)
Here:
$16,496
State:
$20,239
Here:
26.4% of AGI
State:
19.5% of AGI
(% of AGI for various income ranges: 11.4% for AGIs $10k-25k, 7.4% for AGIs $25k-50k, 9.9% for AGIs $50k-75k, 13.0% for AGIs $75k-100k, 9.2% for AGIs over 100k)
Charity contributions deductions: $2,157 (3% of AGI, reported on 16.1% of returns)
Here:
$2,157
State:
$3,719
Here:
3.2% of AGI
State:
3.4% of AGI
(% of AGI for various income ranges: 2.2% for AGIs below $10k, 0.5% for AGIs $25k-50k, 1.2% for AGIs $50k-75k, 1.7% for AGIs $75k-100k, 0.9% for AGIs over 100k)
Total tax: $3,964 (reported on 76.4% of returns)
62074:
$3,964
State:
$9,882
(% of AGI for various income ranges: 3.1% for AGIs below $10k, 4.0% for AGIs $10k-25k, 7.0% for AGIs $25k-50k, 8.4% for AGIs $50k-75k, 11.3% for AGIs $75k-100k, 9.9% for AGIs over 100k)
Earned income credit: $1,500 (reported on 12.0% of returns)
Here:
$1,500
State:
$1,788
Percentage of individuals using paid preparers for their 2004 taxes: 69.0%
Here:
69%
State:
61%
(% for various income ranges: 56.8% for AGIs below $10k, 68.9% for AGIs $10k-25k, 70.8% for AGIs $25k-50k, 72.0% for AGIs $50k-75k, 81.8% for AGIs $75k-100k, 88.2% for AGIs over 100k)
Household received Food Stamps/SNAP in the past 12 months: 20 Household did not receive Food Stamps/SNAP in the past 12 months: 426
Women who had a birth in the past 12 months: 15 (15 now married, 0 unmarried) Women who did not have a birth in the past 12 months: 234 (158 now married, 73 unmarried)
Housing units in zip code 62074 with a mortgage: 272 (35 second mortgage, 34 both second mortgage and home equity loan) Median monthly owner costs for units with a mortgage: $1,780 Median monthly owner costs for units without a mortgage: $585
Residents with income below the poverty level in 2022:
This zip code:
8.1%
Whole state:
11.9%
Residents with income below 50% of the poverty level in 2022:
This zip code:
1.9%
Whole state:
5.7%
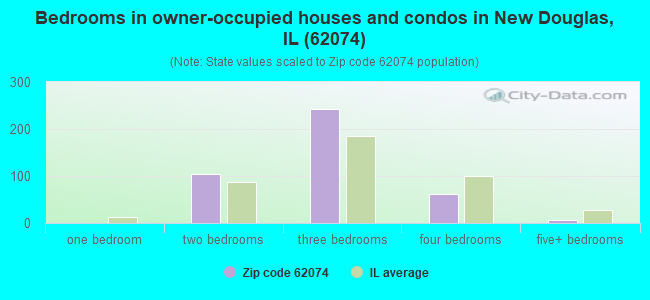
Median number of rooms in houses and condos:
Here:
6.4
State:
6.4
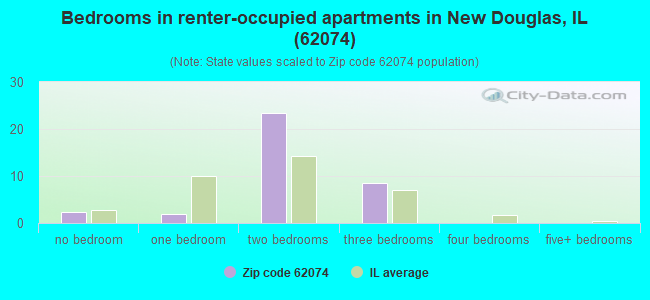
Median number of rooms in apartments:
Here:
4.2
State:
4.1
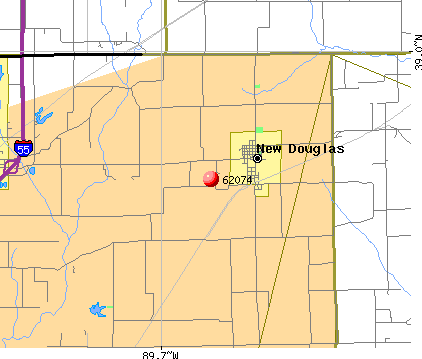
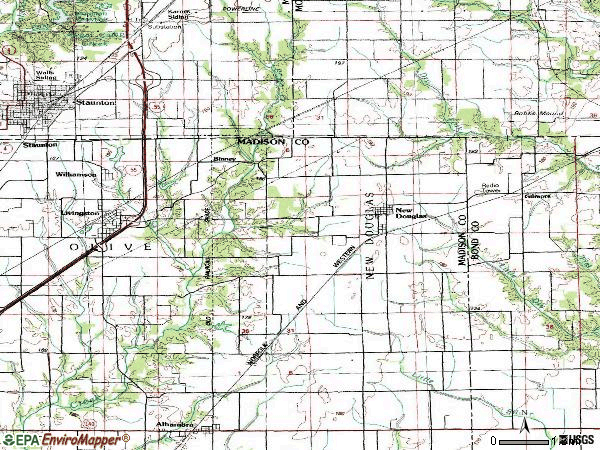
Notable locations in this zip code not listed on our city pages
Cemeteries: New Douglas City Cemetery (1), Sacred Heart Cemetery (2), Peterson Cemetery (3), Saint Ubaldus Cemetery (4). Display/hide their locations on the map
Size of family households: 166 2-persons, 66 3-persons, 73 4-persons, 31 5-persons, 2 6-persons, 1 7-or-more-persons
Size of nonfamily households: 78 1-person, 30 2-persons
290 married couples with children.
19 single-parent households (8 men, 11 women).
98.5% of residents of 62074 zip code speak English at home.
0.7% of residents speak Spanish at home (25% very well, 50% well, 25% not well).
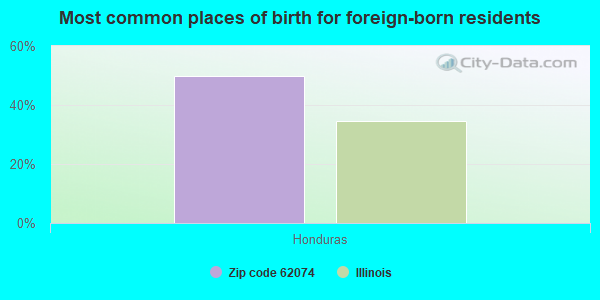
Foreign born population: 1 (0.2%) (0.0% of them are naturalized citizens)
:
0.2%
Whole state:
14.4%
50%Honduras
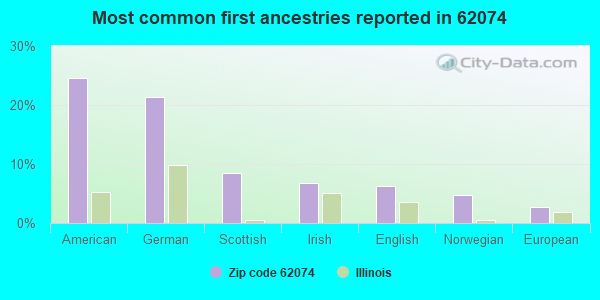
25%American
21%German
9%Scottish
7%Irish
6%English
5%Norwegian
3%European
Facilities with environmental interests located in this zip code:
OBERBECK GRAIN CO (7564 OBERBECK LANE in NEW DOUGLAS, IL)
STATE MASTER (Illinois EPA Project) - AIR PROGRAM AIR MINOR (AIRS/AFS) CRITERIA AND HAZARDOUS AIR POLLUTANT INVENTORY (Inventory of air pollution sources) Business SIC classification: GRAIN AND FIELD BEANS Alternative names: OBERBECK FEED COMPANY
NEW DOUGLAS STP (95 E HUBER ST in NEW DOUGLAS, IL)
STATE MASTER (Illinois EPA Project) - National Pollutant Discharge Elimination System Permit, National Pollutant Discharge Elimination System NON-MAJOR (Tracking pollutant discharge elimination systems) - permit Business SIC classification: SEWERAGE SYSTEMS Alternative names: NEW DOUGLAS, CITY OF, NEW DOUGLAS STP, VILLAGE OF
NEW DOUGLAS ELEM SCHOOL (P O 95, 310 S MAIN in NEW DOUGLAS, IL)
(National Center for Education Statistics) - STATE ID-4105700502006 Organizations: HIGHLAND COMM UNIT SCH DIST 5 (SCHOOL DISTRICT)
Housing units lacking complete plumbing facilities: 1.1% Housing units lacking complete kitchen facilities: 1.1%
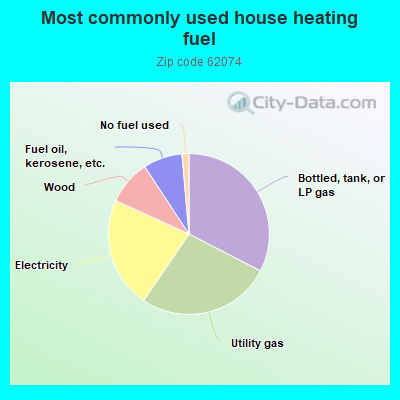
32.8%Bottled, tank, or LP gas
27.1%Utility gas
22.4%Electricity
9.0%Wood
7.9%Fuel oil, kerosene, etc.
1.4%No fuel used
Population in 1990: 2,464.
Place of birth for U.S.-born residents:
This state: 935
Northeast: 6
Midwest: 169
South: 62
West: 16
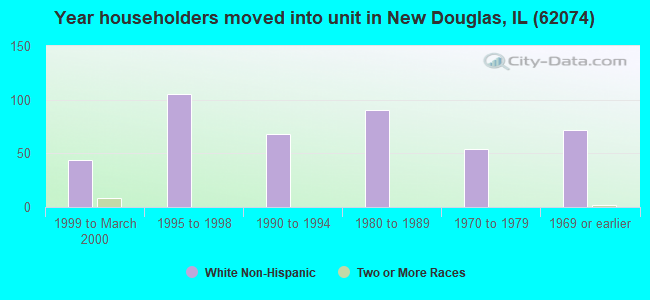
67% of the 62074 zip code residents lived in the same house 5 years ago. Out of people who lived in different houses, 41% lived in this county. Out of people who lived in different counties, 50% lived in Illinois.
99% of the 62074 zip code residents lived in the same house 1 year ago. Out of people who lived in different houses, 43% moved from this county. Out of people who lived in different houses, 29% moved from different county within same state. Out of people who lived in different houses, 29% moved from different state.
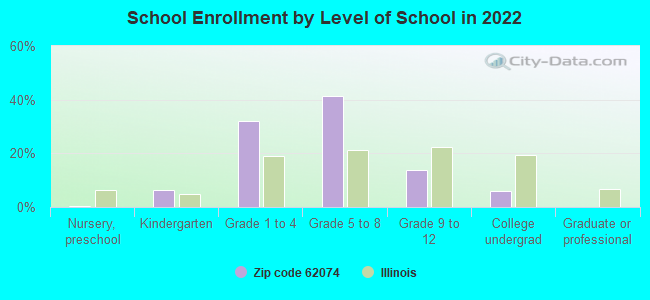
Private vs. public school enrollment:
Students in private schools in grades 1 to 8 (elementary and middle school): 3
Here:
1.4%
Illinois:
13.3%
Students in private schools in grades 9 to 12 (high school): 8
Here:
21.2%
Illinois:
9.9%
Students in private undergraduate colleges:
Here:
0.0%
Illinois:
27.4%
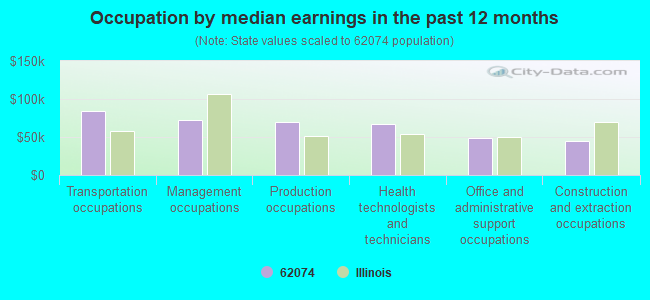
Occupation by median earnings in the past 12 months ($)
84,711Transportation occupations
72,563Management occupations
69,275Production occupations
67,106Health technologists and technicians
48,438Office and administrative support occupations
45,299Construction and extraction occupations
Top industries in this zip code by the number of employees in 2005:
Construction: Site Preparation Contractors (1-4 employees: 2 establishments)
Accommodation and Food Services: Drinking Places (Alcoholic Beverages) (1-4: 2)
Mining: Drilling Oil and Gas Wells (1-4: 1)
Construction: Highway, Street, and Bridge Construction (1-4: 1)
Real Estate and Rental and Leasing: Offices of Real Estate Appraisers (1-4: 1)
Mining: Crude Petroleum and Natural Gas Extraction (1-4: 1)
Construction: New Single-Family Housing Construction (except Operative Builders) (1-4: 1)
Fatal accident statistics in 2010:
Fatal accident count: 1
Vehicles involved in fatal accidents: 1
Fatal accidents caused by drunken drivers: 1
Fatalities: 1
Persons involved in fatal accidents: 1
Pedestrians involved in fatal accidents: 0
Home Mortgage Disclosure Act Aggregated Statistics For Year 2009 (Based on 4 partial tracts)
A) FHA, FSA/RHS & VA Home Purchase Loans
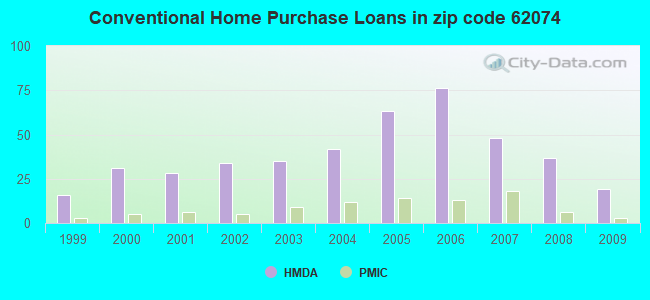
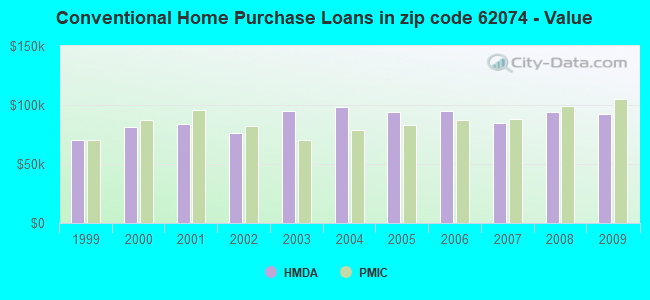
B) Conventional Home Purchase Loans
C) Refinancings
D) Home Improvement Loans
F) Non-occupant Loans on < 5 Family Dwellings (A B C & D)
G) Loans On Manufactured Home Dwelling (A B C & D)
Number
Average Value
Number
Average Value
Number
Average Value
Number
Average Value
Number
Average Value
Number
Average Value
LOANS ORIGINATED
10
$106,060
19
$92,770
147
$112,392
13
$49,092
8
$66,608
1
$32,620
APPLICATIONS APPROVED, NOT ACCEPTED
2
$118,445
2
$58,000
13
$121,572
0
$0
0
$0
1
$34,330
APPLICATIONS DENIED
1
$60,400
3
$68,720
19
$100,914
3
$51,313
1
$20,030
1
$33,190
APPLICATIONS WITHDRAWN
1
$115,010
2
$117,585
14
$121,286
2
$16,025
0
$0
1
$109,290
FILES CLOSED FOR INCOMPLETENESS
1
$64,660
0
$0
4
$57,960
0
$0
0
$0
0
$0
Aggregated Statistics For Year 2008 (Based on 4 partial tracts)
A) FHA, FSA/RHS & VA Home Purchase Loans
B) Conventional Home Purchase Loans
C) Refinancings
D) Home Improvement Loans
F) Non-occupant Loans on < 5 Family Dwellings (A B C & D)
G) Loans On Manufactured Home Dwelling (A B C & D)
Number
Average Value
Number
Average Value
Number
Average Value
Number
Average Value
Number
Average Value
Number
Average Value
LOANS ORIGINATED
11
$121,255
37
$94,478
91
$105,803
14
$28,506
13
$57,922
3
$67,123
APPLICATIONS APPROVED, NOT ACCEPTED
2
$132,815
2
$105,000
7
$114,767
4
$53,500
1
$39,480
0
$0
APPLICATIONS DENIED
3
$105,670
6
$131,030
25
$112,423
10
$34,350
4
$46,345
1
$79,560
APPLICATIONS WITHDRAWN
3
$97,303
5
$113,306
17
$116,491
2
$58,050
1
$73,810
1
$84,970
FILES CLOSED FOR INCOMPLETENESS
1
$122,510
0
$0
3
$85,327
1
$18,310
0
$0
0
$0
Aggregated Statistics For Year 2007 (Based on 4 partial tracts)
A) FHA, FSA/RHS & VA Home Purchase Loans
B) Conventional Home Purchase Loans
C) Refinancings
D) Home Improvement Loans
F) Non-occupant Loans on < 5 Family Dwellings (A B C & D)
G) Loans On Manufactured Home Dwelling (A B C & D)
Number
Average Value
Number
Average Value
Number
Average Value
Number
Average Value
Number
Average Value
Number
Average Value
LOANS ORIGINATED
3
$96,487
48
$85,025
100
$94,127
17
$35,614
12
$84,692
5
$46,974
APPLICATIONS APPROVED, NOT ACCEPTED
1
$60,020
5
$114,288
16
$103,436
1
$51,500
2
$50,540
2
$48,390
APPLICATIONS DENIED
2
$42,055
8
$86,272
42
$100,572
9
$50,480
3
$116,153
0
$0
APPLICATIONS WITHDRAWN
1
$50,930
2
$177,250
13
$83,912
3
$78,220
0
$0
0
$0
FILES CLOSED FOR INCOMPLETENESS
0
$0
0
$0
3
$92,697
0
$0
1
$38,910
0
$0
Aggregated Statistics For Year 2006 (Based on 4 partial tracts)
A) FHA, FSA/RHS & VA Home Purchase Loans
B) Conventional Home Purchase Loans
C) Refinancings
D) Home Improvement Loans
F) Non-occupant Loans on < 5 Family Dwellings (A B C & D)
G) Loans On Manufactured Home Dwelling (A B C & D)
Number
Average Value
Number
Average Value
Number
Average Value
Number
Average Value
Number
Average Value
Number
Average Value
LOANS ORIGINATED
7
$92,110
76
$95,122
101
$85,353
21
$59,449
16
$82,807
6
$79,012
APPLICATIONS APPROVED, NOT ACCEPTED
0
$0
11
$126,441
13
$91,867
5
$55,122
2
$90,410
1
$88,890
APPLICATIONS DENIED
2
$83,640
25
$82,010
40
$90,539
9
$50,370
5
$97,292
3
$59,733
APPLICATIONS WITHDRAWN
1
$28,040
8
$92,425
29
$104,664
2
$88,150
1
$76,260
0
$0
FILES CLOSED FOR INCOMPLETENESS
0
$0
3
$134,463
7
$104,776
0
$0
0
$0
0
$0
Aggregated Statistics For Year 2005 (Based on 4 partial tracts)
A) FHA, FSA/RHS & VA Home Purchase Loans
B) Conventional Home Purchase Loans
C) Refinancings
D) Home Improvement Loans
E) Loans on Dwellings For 5+ Families
F) Non-occupant Loans on < 5 Family Dwellings (A B C & D)
G) Loans On Manufactured Home Dwelling (A B C & D)
Number
Average Value
Number
Average Value
Number
Average Value
Number
Average Value
Number
Average Value
Number
Average Value
Number
Average Value
LOANS ORIGINATED
5
$67,154
63
$94,389
91
$85,044
20
$43,594
1
$96,700
12
$59,648
6
$45,702
APPLICATIONS APPROVED, NOT ACCEPTED
1
$101,280
5
$85,540
9
$85,504
1
$7,440
0
$0
2
$92,830
1
$55,500
APPLICATIONS DENIED
0
$0
21
$80,462
39
$85,404
11
$52,263
0
$0
4
$85,628
4
$73,582
APPLICATIONS WITHDRAWN
0
$0
6
$90,673
31
$113,944
6
$115,405
0
$0
1
$59,080
0
$0
FILES CLOSED FOR INCOMPLETENESS
2
$89,830
2
$76,060
6
$79,792
1
$53,890
0
$0
0
$0
0
$0
Aggregated Statistics For Year 2004 (Based on 4 partial tracts)
A) FHA, FSA/RHS & VA Home Purchase Loans
B) Conventional Home Purchase Loans
C) Refinancings
D) Home Improvement Loans
E) Loans on Dwellings For 5+ Families
F) Non-occupant Loans on < 5 Family Dwellings (A B C & D)
G) Loans On Manufactured Home Dwelling (A B C & D)
Number
Average Value
Number
Average Value
Number
Average Value
Number
Average Value
Number
Average Value
Number
Average Value
Number
Average Value
LOANS ORIGINATED
8
$80,942
42
$98,227
97
$80,018
15
$31,057
1
$85,830
13
$80,028
4
$52,090
APPLICATIONS APPROVED, NOT ACCEPTED
0
$0
6
$81,280
11
$71,601
2
$21,025
0
$0
0
$0
1
$33,190
APPLICATIONS DENIED
3
$48,280
14
$61,454
47
$74,770
12
$37,787
0
$0
2
$44,280
5
$62,256
APPLICATIONS WITHDRAWN
0
$0
4
$49,572
36
$78,124
3
$91,840
0
$0
2
$34,045
2
$71,830
FILES CLOSED FOR INCOMPLETENESS
0
$0
2
$92,460
4
$85,952
0
$0
0
$0
0
$0
0
$0
Aggregated Statistics For Year 2003 (Based on 2 partial tracts)
A) FHA, FSA/RHS & VA Home Purchase Loans
B) Conventional Home Purchase Loans
C) Refinancings
D) Home Improvement Loans
F) Non-occupant Loans on < 5 Family Dwellings (A B C & D)
Number
Average Value
Number
Average Value
Number
Average Value
Number
Average Value
Number
Average Value
LOANS ORIGINATED
3
$76,867
35
$94,642
141
$94,961
10
$40,168
12
$60,606
APPLICATIONS APPROVED, NOT ACCEPTED
0
$0
3
$107,763
14
$110,680
2
$42,630
1
$25,180
APPLICATIONS DENIED
2
$138,185
3
$113,867
23
$80,904
4
$16,308
0
$0
APPLICATIONS WITHDRAWN
0
$0
2
$103,570
15
$107,001
1
$34,330
1
$40,050
FILES CLOSED FOR INCOMPLETENESS
0
$0
0
$0
2
$94,125
0
$0
0
$0
Aggregated Statistics For Year 2002 (Based on 2 partial tracts)
A) FHA, FSA/RHS & VA Home Purchase Loans
B) Conventional Home Purchase Loans
C) Refinancings
D) Home Improvement Loans
E) Loans on Dwellings For 5+ Families
F) Non-occupant Loans on < 5 Family Dwellings (A B C & D)
Number
Average Value
Number
Average Value
Number
Average Value
Number
Average Value
Number
Average Value
Number
Average Value
LOANS ORIGINATED
6
$78,487
34
$76,019
104
$91,568
5
$28,496
0
$0
10
$49,095
APPLICATIONS APPROVED, NOT ACCEPTED
1
$14,880
3
$67,330
11
$74,386
1
$9,730
0
$0
1
$54,930
APPLICATIONS DENIED
1
$30,900
5
$103,682
27
$78,985
5
$13,160
1
$22,890
3
$53,023
APPLICATIONS WITHDRAWN
1
$27,470
1
$68,660
18
$88,468
1
$14,310
0
$0
2
$43,200
FILES CLOSED FOR INCOMPLETENESS
0
$0
0
$0
1
$68,090
0
$0
0
$0
0
$0
Aggregated Statistics For Year 2001 (Based on 2 partial tracts)
A) FHA, FSA/RHS & VA Home Purchase Loans
B) Conventional Home Purchase Loans
C) Refinancings
D) Home Improvement Loans
E) Loans on Dwellings For 5+ Families
F) Non-occupant Loans on < 5 Family Dwellings (A B C & D)
Number
Average Value
Number
Average Value
Number
Average Value
Number
Average Value
Number
Average Value
Number
Average Value
LOANS ORIGINATED
4
$80,108
28
$84,277
82
$94,574
8
$96,630
1
$31,470
6
$40,722
APPLICATIONS APPROVED, NOT ACCEPTED
0
$0
2
$58,650
19
$86,312
1
$7,440
0
$0
1
$28,610
APPLICATIONS DENIED
0
$0
9
$56,393
29
$57,575
3
$6,483
1
$58,940
1
$44,060
APPLICATIONS WITHDRAWN
1
$46,920
2
$65,515
10
$71,926
1
$8,580
0
$0
0
$0
FILES CLOSED FOR INCOMPLETENESS
0
$0
1
$68,660
1
$14,310
1
$18,880
0
$0
1
$14,310
Aggregated Statistics For Year 2000 (Based on 2 partial tracts)
A) FHA, FSA/RHS & VA Home Purchase Loans
B) Conventional Home Purchase Loans
C) Refinancings
D) Home Improvement Loans
F) Non-occupant Loans on < 5 Family Dwellings (A B C & D)
Number
Average Value
Number
Average Value
Number
Average Value
Number
Average Value
Number
Average Value
LOANS ORIGINATED
5
$64,316
31
$81,769
43
$81,904
12
$14,019
5
$53,100
APPLICATIONS APPROVED, NOT ACCEPTED
1
$42,920
6
$64,277
14
$52,111
3
$24,603
1
$37,770
APPLICATIONS DENIED
0
$0
14
$56,076
28
$57,833
10
$19,226
0
$0
APPLICATIONS WITHDRAWN
1
$60,650
2
$40,910
14
$41,403
2
$18,595
1
$8,580
FILES CLOSED FOR INCOMPLETENESS
0
$0
0
$0
3
$77,820
1
$6,870
0
$0
Aggregated Statistics For Year 1999 (Based on 1 partial tract)
A) FHA, FSA/RHS & VA Home Purchase Loans
B) Conventional Home Purchase Loans
C) Refinancings
D) Home Improvement Loans
F) Non-occupant Loans on < 5 Family Dwellings (A B C & D)
Detailed PMIC statistics for the following Tracts:4038.02
, 9571.00
2002 - 2018 National Fire Incident Reporting System (NFIRS) incidents
Based on the data from the years 2002 - 2018 the average number of fires per year is 8. The highest number of fires - 21 took place in 2010, and the least - 0 in 2005. The data has a decreasing trend.
When looking into fire subcategories, the most reports belonged to: Structure Fires (41.8%), and Outside Fires (39.6%).
Fire incident types reported to NFIRS in Zip Code 62074
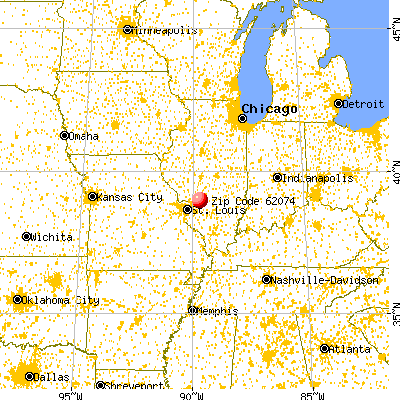


 Nearest zip codes: 62058, 62001, 62086, 62088, 62091, 62069.
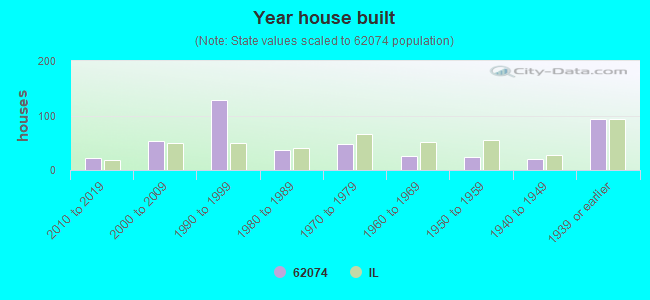


 Based on the data from the years 2002 - 2018 the average number of fires per year is 8. The highest number of fires - 21 took place in 2010, and the least - 0 in 2005. The data has a decreasing trend.
 When looking into fire subcategories, the most reports belonged to: Structure Fires (41.8%), and Outside Fires (39.6%).