Averages for the 2020 tax year for zip code 62240, filed in 2021:
Average Adjusted Gross Income (AGI) in 2020: $52,870 (Individual Income Tax Returns)
Here:
$52,870
State:
$82,626
Salary/wage: $44,267 (reported on 81.7% of returns)
Here:
$44,267
State:
$66,640
(% of AGI for various income ranges: 1106.1% for AGIs below $25k, 3692.9% for AGIs $25k-50k, 6833.8% for AGIs $50k-75k, 9300.0% for AGIs $75k-100k, 16438.0% for AGIs $100k-200k)
Taxable interest for individuals: $1,006 (reported on 22.5% of returns)
This zip code:
$1,006
Illinois:
$2,376
(% of AGI for various income ranges: 1.7% for AGIs below $25k, 12.4% for AGIs $25k-50k, 18.8% for AGIs $50k-75k, 25.0% for AGIs $75k-100k, 224.0% for AGIs $100k-200k)
Ordinary dividends: $1,910 (reported on 14.1% of returns)
Here:
$1,910
State:
$9,061
(% of AGI for various income ranges: 24.1% for AGIs $25k-50k, 57.5% for AGIs $50k-75k, 208.0% for AGIs $100k-200k)
Net capital gain/loss in AGI: +$4,850 (reported on 11.3% of returns)
Here:
+$4,850
State:
+$31,684
(% of AGI for various income ranges: 12.9% for AGIs $25k-50k, 732.0% for AGIs $100k-200k)
Profit/loss from business: +$4,175 (reported on 11.3% of returns)
Here:
+$4,175
State:
+$12,175
(% of AGI for various income ranges: 69.4% for AGIs below $25k, 91.8% for AGIs $25k-50k, 66.2% for AGIs $50k-75k)
Taxable individual retirement arrangement distribution: $13,633 (reported on 8.5% of returns)
62240:
$13,633
Illinois:
$21,613
(% of AGI for various income ranges: 160.0% for AGIs $25k-50k, 1365.0% for AGIs $75k-100k)
Earned income credit: $2,379 (reported on 19.7% of returns)
Here:
$2,379
State:
$2,311
(% of AGI for various income ranges: 115.0% for AGIs below $25k, 74.1% for AGIs $25k-50k)
Percentage of individuals using paid preparers for their 2020 taxes: 95.8%
Here:
96%
State:
93%
(% for various income ranges: 91.7% for AGIs below $25k, 100.0% for AGIs $25k-50k, 100.0% for AGIs $50k-75k, 83.3% for AGIs $75k-100k, 100.0% for AGIs $100k-200k)
Averages for the 2012 tax year for zip code 62240, filed in 2013:
Average Adjusted Gross Income (AGI) in 2012: $42,358 (Individual Income Tax Returns)
Here:
$42,358
State:
$68,058
Salary/wage: $36,157 (reported on 87.0% of returns)
Here:
$36,157
State:
$55,396
(% of AGI for various income ranges: 80.3% for AGIs below $25k, 79.7% for AGIs $25k-50k, 74.9% for AGIs $50k-75k, 78.8% for AGIs $75k-100k, 61.0% for AGIs $100k-200k)
Taxable interest for individuals: $805 (reported on 27.3% of returns)
This zip code:
$805
Illinois:
$1,969
(% of AGI for various income ranges: 0.8% for AGIs below $25k, 0.2% for AGIs $25k-50k, 0.5% for AGIs $50k-75k, 0.2% for AGIs $75k-100k, 0.9% for AGIs $100k-200k)
Ordinary dividends: $1,930 (reported on 13.0% of returns)
Here:
$1,930
State:
$7,786
(% of AGI for various income ranges: 0.7% for AGIs $25k-50k, 0.4% for AGIs $50k-75k, 0.2% for AGIs $75k-100k, 1.3% for AGIs $100k-200k)
Net capital gain/loss in AGI: +$1,286 (reported on 9.1% of returns)
Here:
+$1,286
State:
+$22,183
Profit/loss from business: +$2,922 (reported on 11.7% of returns)
Here:
+$2,922
State:
+$12,903
(% of AGI for various income ranges: 2.8% for AGIs below $25k, 1.4% for AGIs $25k-50k, 0.5% for AGIs $75k-100k)
Taxable individual retirement arrangement distribution: $15,686 (reported on 9.1% of returns)
62240:
$15,686
Illinois:
$17,929
Total itemized deductions: $17,338 (20% of AGI, reported on 16.9% of returns)
Here:
$17,338
State:
$26,433
Here:
20.1% of AGI
State:
19.2% of AGI
(% of AGI for various income ranges: 5.9% for AGIs $25k-50k, 6.9% for AGIs $50k-75k, 8.4% for AGIs $75k-100k, 10.2% for AGIs $100k-200k)
Charity contributions: $3,122 (reported on 11.7% of returns)
Here:
$3,122
State:
$4,525
(% of AGI for various income ranges: 2.1% for AGIs $50k-75k, 0.8% for AGIs $75k-100k, 1.2% for AGIs $100k-200k)
Taxes paid: $6,407 (reported on 18.2% of returns)
62240:
$6,407
State:
$11,968
(% of AGI for various income ranges: 1.5% for AGIs $25k-50k, 2.7% for AGIs $50k-75k, 3.3% for AGIs $75k-100k, 5.1% for AGIs $100k-200k)
Earned income credit: $2,300 (reported on 23.4% of returns)
Here:
$2,300
State:
$2,349
(% of AGI for various income ranges: 7.8% for AGIs below $25k, 1.2% for AGIs $25k-50k)
Percentage of individuals using paid preparers for their 2012 taxes: 62.3%
Here:
62%
State:
57%
(% for various income ranges: 58.1% for AGIs below $25k, 59.1% for AGIs $25k-50k, 80.0% for AGIs $50k-75k, 62.5% for AGIs $75k-100k, 66.7% for AGIs $100k-200k)
Averages for the 2004 tax year for zip code 62240, filed in 2005:
Average Adjusted Gross Income (AGI) in 2004: $33,791 (Individual Income Tax Returns)
Here:
$33,791
State:
$54,625
Salary/wage: $30,434 (reported on 90.5% of returns)
Here:
$30,434
State:
$46,811
(% of AGI for various income ranges: 88.3% for AGIs below $10k, 86.5% for AGIs $10k-25k, 82.9% for AGIs $25k-50k, 84.4% for AGIs $50k-75k, 85.4% for AGIs $75k-100k, 61.4% for AGIs over 100k)
Taxable interest for individuals: $928 (reported on 28.6% of returns)
This zip code:
$928
Illinois:
$2,101
(% of AGI for various income ranges: 0.7% for AGIs below $10k, 0.9% for AGIs $10k-25k, 0.5% for AGIs $25k-50k, 0.4% for AGIs $50k-75k, 0.4% for AGIs $75k-100k, 2.2% for AGIs over 100k)
Taxable dividends: $690 (reported on 14.0% of returns)
Here:
$690
State:
$4,306
(% of AGI for various income ranges: 0.3% for AGIs below $10k, 0.2% for AGIs $10k-25k, 0.2% for AGIs $25k-50k, 0.3% for AGIs $50k-75k, 0.1% for AGIs $75k-100k, 0.6% for AGIs over 100k)
Net capital gain/loss: +$3,253 (reported on 9.0% of returns)
Here:
+$3,253
State:
+$17,321
(% of AGI for various income ranges: 0.1% for AGIs $10k-25k, 0.0% for AGIs $25k-50k, 0.1% for AGIs $50k-75k, 0.0% for AGIs $75k-100k, 6.1% for AGIs over 100k)
Profit/loss from business: +$3,132 (reported on 8.2% of returns)
Here:
+$3,132
State:
+$11,771
Total itemized deductions: $13,805 (22% of AGI, reported on 18.3% of returns)
Here:
$13,805
State:
$20,239
Here:
21.5% of AGI
State:
19.5% of AGI
(% of AGI for various income ranges: 2.3% for AGIs $10k-25k, 8.1% for AGIs $25k-50k, 6.0% for AGIs $50k-75k, 12.0% for AGIs $75k-100k, 12.5% for AGIs over 100k)
Charity contributions deductions: $2,533 (4% of AGI, reported on 13.0% of returns)
Here:
$2,533
State:
$3,719
Here:
3.7% of AGI
State:
3.4% of AGI
(% of AGI for various income ranges: 0.9% for AGIs $25k-50k, 1.0% for AGIs $50k-75k, 2.1% for AGIs $75k-100k, 1.2% for AGIs over 100k)
Total tax: $4,009 (reported on 71.2% of returns)
62240:
$4,009
State:
$9,882
(% of AGI for various income ranges: 1.5% for AGIs below $10k, 3.4% for AGIs $10k-25k, 6.5% for AGIs $25k-50k, 9.3% for AGIs $50k-75k, 10.5% for AGIs $75k-100k, 15.8% for AGIs over 100k)
Earned income credit: $1,849 (reported on 23.0% of returns)
Here:
$1,849
State:
$1,788
Percentage of individuals using paid preparers for their 2004 taxes: 70.1%
Here:
70%
State:
61%
(% for various income ranges: 57.4% for AGIs below $10k, 70.0% for AGIs $10k-25k, 74.1% for AGIs $25k-50k, 75.2% for AGIs $50k-75k, 76.0% for AGIs $75k-100k, 87.5% for AGIs over 100k)
Household received Food Stamps/SNAP in the past 12 months: 181 Household did not receive Food Stamps/SNAP in the past 12 months: 481
Women who had a birth in the past 12 months: 107 (107 now married, 0 unmarried) Women who did not have a birth in the past 12 months: 335 (99 now married, 236 unmarried)
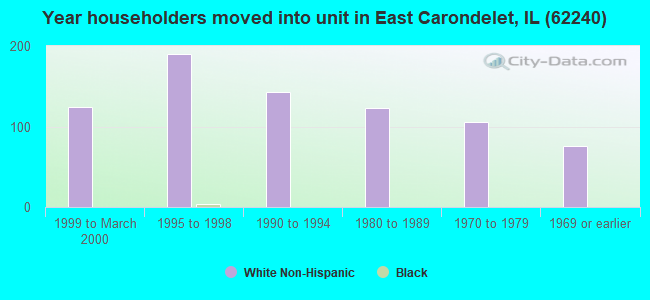
Housing units in zip code 62240 with a mortgage: 239 (4 second mortgage, 4 both second mortgage and home equity loan) Houses without a mortgage: 4
Median monthly owner costs for units with a mortgage: $947 Median monthly owner costs for units without a mortgage: $438
Residents with income below the poverty level in 2022:
This zip code:
9.1%
Whole state:
11.9%
Residents with income below 50% of the poverty level in 2022:
This zip code:
3.0%
Whole state:
5.7%
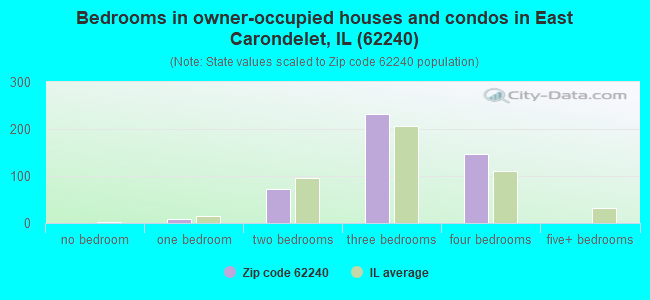
Median number of rooms in houses and condos:
Here:
6.6
State:
6.4
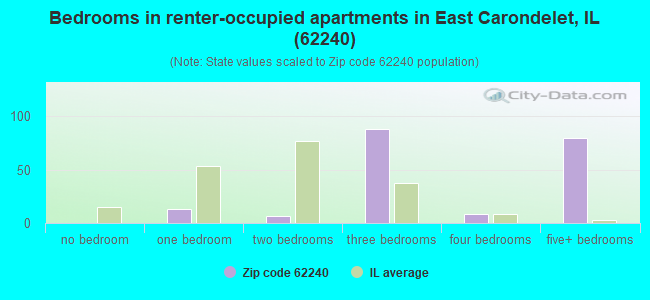
Median number of rooms in apartments:
Here:
7.2
State:
4.1
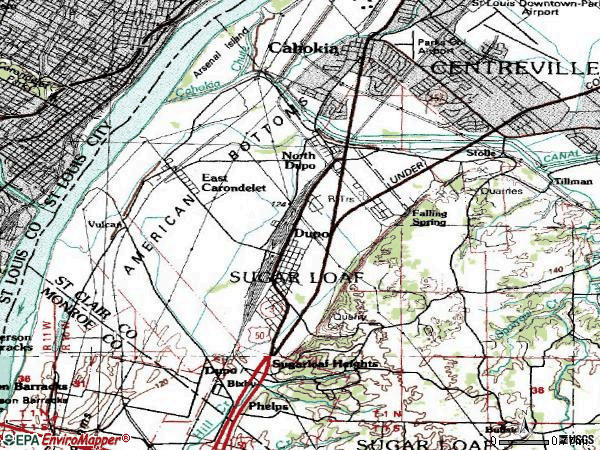
Notable locations in this zip code not listed on our city pages
Size of family households: 138 2-persons, 95 3-persons, 86 4-persons, 22 5-persons, 12 6-persons, 93 7-or-more-persons
Size of nonfamily households: 164 1-person, 42 2-persons
609 married couples with children.
189 single-parent households (6 men, 183 women).
98.9% of residents of 62240 zip code speak English at home.
0.2% of residents speak Spanish at home (100% very well).
Foreign born population: 0 (0.0%)
:
0.0%
Whole state:
14.4%
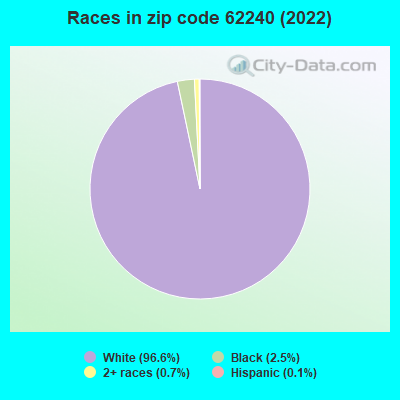
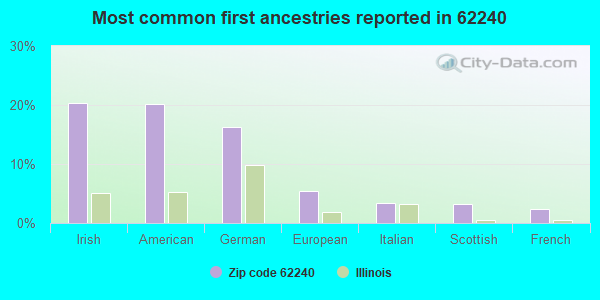
20%Irish
20%American
16%German
5%European
3%Italian
3%Scottish
2%French
Facilities with environmental interests located in this zip code:
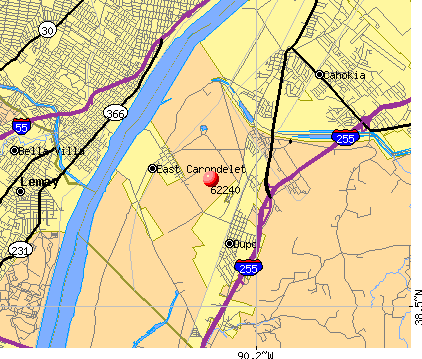
KEMPEN PAINT CO (2500 STATE ST. in EAST CARONDELET, IL)
STATE MASTER (Illinois EPA Project) - SOLID WASTE PROGRAM, HAZARDOUS WASTE PROGRAM, AIR PROGRAM AIR MINOR (AIRS/AFS) CRITERIA AND HAZARDOUS AIR POLLUTANT INVENTORY (Inventory of air pollution sources) National Pollutant Discharge Elimination System NON-MAJOR (Tracking pollutant discharge elimination systems) - permit National Pollutant Discharge Elimination System NON-MAJOR (Tracking pollutant discharge elimination systems) - permit HAZARDOUS WASTE BIENNIAL REPORTER (Resource Conservation and Recovery Act (tracking hazardous waste)) Large Quantity Generators, more that 1000 kg of hazardous waste/month (Resource Conservation and Recovery Act (tracking hazardous waste)) - notification TRI REPORTER (Tracking of toxic chemicals releasing facilities) Business SIC classification: PAINTS, VARNISHES, LACQUERS, ENAMELS, AND ALLIED PRODUCTS Business NAICS classification: PAINT AND COATING MANUFACTURING. Organizations: KEMPEN SR.?KENNETH E (CONTACT/OWNER)
RIVERWAY HARBOR SERVICE, INC. (FOOT OF DAVIS FERRY STREET ROAD in EAST CARONDELET, IL)
STATE MASTER (Illinois EPA Project) - National Pollutant Discharge Elimination System Permit National Pollutant Discharge Elimination System NON-MAJOR (Tracking pollutant discharge elimination systems) - permit Conditionally Exempt Small Quantity Generators, less than 100 kg/month of hazardous waste (Resource Conservation and Recovery Act (tracking hazardous waste)) Business SIC classification: TOWING AND TUGBOAT SERVICES Organizations: INGRAM BARGE CO. (CONTACT/OPERATOR)
, RIVERWAY PROPERTIES (CONTACT/OWNER)
Alternative names: INGRAM BARGE COMPANY
CHARLES JOHNSON CO (9TH ST in EAST CARONDELET, IL)
STATE MASTER (Illinois EPA Project) - SOLID WASTE PROGRAM TRANSPORTER (Resource Conservation and Recovery Act (tracking hazardous waste)) - notification Organizations: JOHNSON CHARLES (CONTACT/OWNER)
Alternative names: JOHNSON CHARLES
ILADA ENERGY CORP (RTE 1 in EAST CARONDELET, IL)
STATE MASTER (Illinois EPA Project) - SOLID WASTE PROGRAM TRANSPORTER (Resource Conservation and Recovery Act (tracking hazardous waste)) Organizations: ILADA ENERGY COMPANY (CONTACT/OPERATOR)
Housing units lacking complete plumbing facilities: 7.4% Housing units lacking complete kitchen facilities: 7.0%
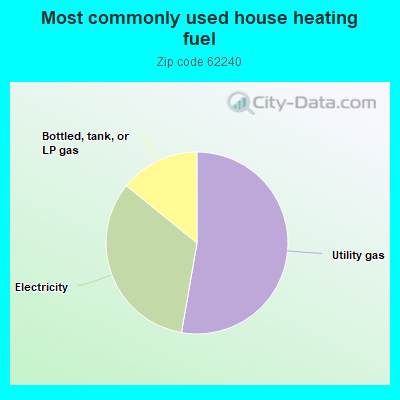
52.9%Utility gas
33.2%Electricity
14.2%Bottled, tank, or LP gas
Population in 1990: 1,579. Population change in the 1990s: +389 (+24.6%).
Place of birth for U.S.-born residents:
This state: 1,701
Midwest: 305
South: 119
West: 30
58% of the 62240 zip code residents lived in the same house 5 years ago. Out of people who lived in different houses, 66% lived in this county. Out of people who lived in different counties, 50% lived in Illinois.
80% of the 62240 zip code residents lived in the same house 1 year ago. Out of people who lived in different houses, 82% moved from this county. Out of people who lived in different houses, 5% moved from different county within same state. Out of people who lived in different houses, 7% moved from different state.
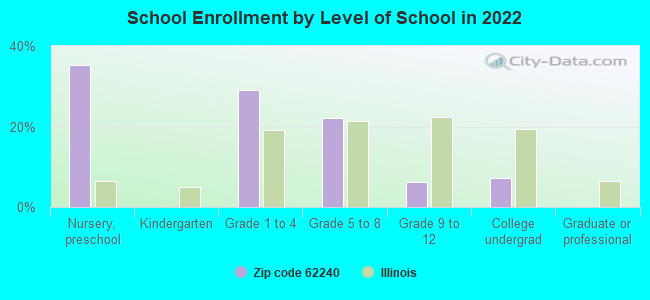
Private vs. public school enrollment:
Students in private schools in grades 1 to 8 (elementary and middle school): 5
Here:
1.3%
Illinois:
13.3%
Students in private schools in grades 9 to 12 (high school): 19
Here:
40.4%
Illinois:
9.9%
Students in private undergraduate colleges: 1
Here:
3.3%
Illinois:
27.4%
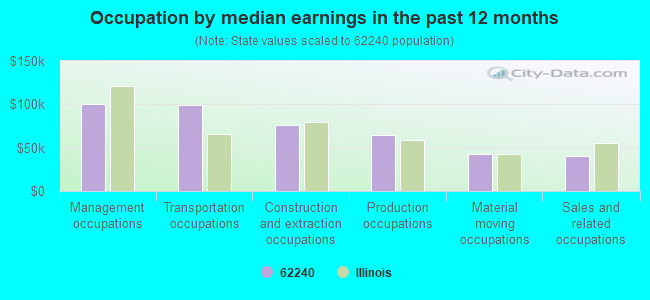
Occupation by median earnings in the past 12 months ($)
100,185Management occupations
98,754Transportation occupations
75,689Construction and extraction occupations
64,204Production occupations
42,400Material moving occupations
40,902Sales and related occupations
Companies with federal contracts located in this zip code:
ROLL OFF'S TO GO INC (2507 STATE ST in EAST CARONDELE, IL; small business)
$26,956 with Air Force for Landscaping/Groundskeeping Services. Signed on 2004-11-03. Completion date: 2004-11-12.
Top industries in this zip code by the number of employees in 2005:
Accommodation and Food Services: Full-Service Restaurants (10-19 employees: 1 establishment)
Other Services (except Public Administration): General Automotive Repair (5-9: 1, 1-4: 1)
Arts, Entertainment, and Recreation: Fitness and Recreational Sports Centers (5-9: 1)
Wholesale Trade: Jewelry, Watch, Precious Stone, and Precious Metal Merchant Wholesalers (1-4: 1)
Construction: Poured Concrete Foundation and Structure Contractors (1-4: 1)
Wholesale Trade: Paint, Varnish, and Supplies Merchant Wholesalers (1-4: 1)
Fatal accident statistics in 2010:
Fatal accident count: 1
Vehicles involved in fatal accidents: 1
Fatal accidents caused by drunken drivers: 1
Fatalities: 1
Persons involved in fatal accidents: 1
Pedestrians involved in fatal accidents: 0
Home Mortgage Disclosure Act Aggregated Statistics For Year 2009 (Based on 4 partial tracts)
A) FHA, FSA/RHS & VA Home Purchase Loans
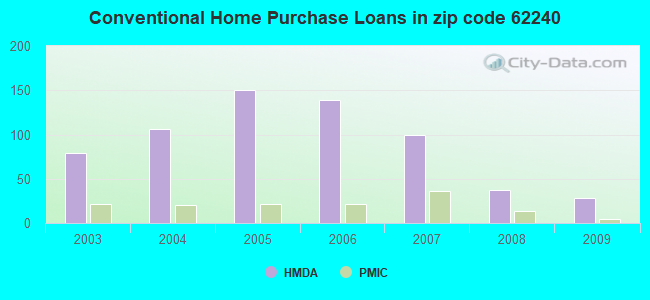
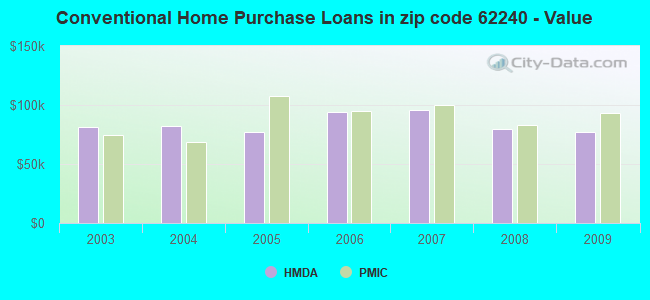
B) Conventional Home Purchase Loans
C) Refinancings
D) Home Improvement Loans
E) Loans on Dwellings For 5+ Families
F) Non-occupant Loans on < 5 Family Dwellings (A B C & D)
G) Loans On Manufactured Home Dwelling (A B C & D)
Number
Average Value
Number
Average Value
Number
Average Value
Number
Average Value
Number
Average Value
Number
Average Value
Number
Average Value
LOANS ORIGINATED
38
$103,704
28
$76,979
153
$128,859
10
$36,514
1
$85,630
17
$57,836
10
$47,045
APPLICATIONS APPROVED, NOT ACCEPTED
2
$99,895
4
$79,720
14
$126,821
4
$8,365
0
$0
0
$0
3
$69,223
APPLICATIONS DENIED
6
$124,830
21
$40,071
49
$118,124
24
$25,261
0
$0
8
$49,210
21
$41,383
APPLICATIONS WITHDRAWN
4
$143,200
5
$39,172
31
$119,469
3
$80,377
0
$0
2
$54,625
2
$19,190
FILES CLOSED FOR INCOMPLETENESS
1
$205,700
0
$0
9
$103,231
1
$29,530
0
$0
1
$29,530
1
$37,400
Aggregated Statistics For Year 2008 (Based on 4 partial tracts)
A) FHA, FSA/RHS & VA Home Purchase Loans
B) Conventional Home Purchase Loans
C) Refinancings
D) Home Improvement Loans
E) Loans on Dwellings For 5+ Families
F) Non-occupant Loans on < 5 Family Dwellings (A B C & D)
G) Loans On Manufactured Home Dwelling (A B C & D)
Number
Average Value
Number
Average Value
Number
Average Value
Number
Average Value
Number
Average Value
Number
Average Value
Number
Average Value
LOANS ORIGINATED
32
$109,584
37
$79,853
138
$104,789
17
$24,605
2
$210,620
24
$76,070
18
$45,218
APPLICATIONS APPROVED, NOT ACCEPTED
4
$111,952
1
$52,160
29
$108,330
6
$28,213
0
$0
2
$56,590
2
$60,035
APPLICATIONS DENIED
5
$110,034
30
$58,265
108
$100,315
25
$42,636
1
$2,470,340
4
$41,338
18
$42,539
APPLICATIONS WITHDRAWN
6
$103,833
5
$85,822
43
$100,137
2
$43,305
0
$0
1
$66,930
4
$70,862
FILES CLOSED FOR INCOMPLETENESS
1
$93,500
1
$112,200
15
$114,364
1
$166,330
0
$0
0
$0
0
$0
Aggregated Statistics For Year 2007 (Based on 4 partial tracts)
A) FHA, FSA/RHS & VA Home Purchase Loans
B) Conventional Home Purchase Loans
C) Refinancings
D) Home Improvement Loans
E) Loans on Dwellings For 5+ Families
F) Non-occupant Loans on < 5 Family Dwellings (A B C & D)
G) Loans On Manufactured Home Dwelling (A B C & D)
Number
Average Value
Number
Average Value
Number
Average Value
Number
Average Value
Number
Average Value
Number
Average Value
Number
Average Value
LOANS ORIGINATED
17
$108,725
99
$95,447
153
$102,775
20
$38,088
2
$1,299,145
26
$68,553
14
$47,593
APPLICATIONS APPROVED, NOT ACCEPTED
4
$74,800
22
$79,228
41
$112,679
6
$54,295
0
$0
1
$362,190
10
$52,064
APPLICATIONS DENIED
3
$92,843
40
$67,614
126
$106,661
52
$53,639
0
$0
7
$89,000
34
$42,205
APPLICATIONS WITHDRAWN
6
$99,405
12
$91,121
41
$105,501
8
$85,995
0
$0
1
$16,730
7
$55,537
FILES CLOSED FOR INCOMPLETENESS
3
$145,660
5
$101,570
20
$95,566
2
$6,395
0
$0
1
$147,630
1
$3,940
Aggregated Statistics For Year 2006 (Based on 4 partial tracts)
A) FHA, FSA/RHS & VA Home Purchase Loans
B) Conventional Home Purchase Loans
C) Refinancings
D) Home Improvement Loans
E) Loans on Dwellings For 5+ Families
F) Non-occupant Loans on < 5 Family Dwellings (A B C & D)
G) Loans On Manufactured Home Dwelling (A B C & D)
Number
Average Value
Number
Average Value
Number
Average Value
Number
Average Value
Number
Average Value
Number
Average Value
Number
Average Value
LOANS ORIGINATED
27
$130,753
139
$94,179
146
$91,881
29
$34,922
2
$433,050
30
$52,261
21
$35,712
APPLICATIONS APPROVED, NOT ACCEPTED
1
$162,390
31
$77,466
41
$94,915
9
$47,132
1
$369,070
4
$42,568
10
$33,069
APPLICATIONS DENIED
9
$80,486
75
$67,910
115
$100,637
33
$29,287
0
$0
7
$37,400
39
$38,863
APPLICATIONS WITHDRAWN
4
$73,815
29
$74,188
69
$106,764
4
$104,818
0
$0
3
$62,333
4
$61,758
FILES CLOSED FOR INCOMPLETENESS
0
$0
9
$94,483
19
$85,884
0
$0
0
$0
2
$54,130
0
$0
Aggregated Statistics For Year 2005 (Based on 4 partial tracts)
A) FHA, FSA/RHS & VA Home Purchase Loans
B) Conventional Home Purchase Loans
C) Refinancings
D) Home Improvement Loans
E) Loans on Dwellings For 5+ Families
F) Non-occupant Loans on < 5 Family Dwellings (A B C & D)
G) Loans On Manufactured Home Dwelling (A B C & D)
Number
Average Value
Number
Average Value
Number
Average Value
Number
Average Value
Number
Average Value
Number
Average Value
Number
Average Value
LOANS ORIGINATED
17
$119,841
150
$77,037
175
$85,946
37
$41,735
3
$638,090
29
$54,674
23
$48,782
APPLICATIONS APPROVED, NOT ACCEPTED
1
$118,100
28
$88,191
34
$69,097
7
$58,349
0
$0
1
$86,610
11
$52,163
APPLICATIONS DENIED
17
$55,231
98
$61,543
125
$80,807
18
$29,198
0
$0
10
$32,183
84
$42,180
APPLICATIONS WITHDRAWN
4
$116,628
51
$94,888
76
$101,891
11
$159,977
0
$0
9
$83,657
4
$44,535
FILES CLOSED FOR INCOMPLETENESS
0
$0
4
$118,595
23
$109,717
1
$44,290
0
$0
0
$0
1
$71,850
Aggregated Statistics For Year 2004 (Based on 4 partial tracts)
A) FHA, FSA/RHS & VA Home Purchase Loans
B) Conventional Home Purchase Loans
C) Refinancings
D) Home Improvement Loans
E) Loans on Dwellings For 5+ Families
F) Non-occupant Loans on < 5 Family Dwellings (A B C & D)
G) Loans On Manufactured Home Dwelling (A B C & D)
Number
Average Value
Number
Average Value
Number
Average Value
Number
Average Value
Number
Average Value
Number
Average Value
Number
Average Value
LOANS ORIGINATED
28
$91,249
106
$82,524
188
$81,511
29
$35,465
1
$338,560
18
$48,226
17
$41,684
APPLICATIONS APPROVED, NOT ACCEPTED
2
$86,610
19
$65,838
39
$79,443
3
$26,247
0
$0
1
$29,530
18
$60,528
APPLICATIONS DENIED
5
$94,286
54
$47,716
117
$75,926
22
$30,108
0
$0
9
$53,038
37
$43,305
APPLICATIONS WITHDRAWN
0
$0
9
$91,749
75
$103,131
7
$81,549
0
$0
5
$49,014
4
$108,015
FILES CLOSED FOR INCOMPLETENESS
1
$113,180
3
$80,703
20
$85,232
1
$49,210
0
$0
2
$84,150
3
$57,410
Aggregated Statistics For Year 2003 (Based on 4 partial tracts)
A) FHA, FSA/RHS & VA Home Purchase Loans
B) Conventional Home Purchase Loans
C) Refinancings
D) Home Improvement Loans
F) Non-occupant Loans on < 5 Family Dwellings (A B C & D)
Detailed PMIC statistics for the following Tracts:5031.00
2002 - 2018 National Fire Incident Reporting System (NFIRS) incidents
Based on the data from the years 2002 - 2018 the average number of fires per year is 17. The highest number of fires - 30 took place in 2011, and the least - 2 in 2016. The data has a decreasing trend.
When looking into fire subcategories, the most reports belonged to: Structure Fires (45.1%), and Outside Fires (45.1%).
Fire incident types reported to NFIRS in Zip Code 62240


 Nearest zip codes: 62239, 62206, 62236, 62260, 63111, 62207.
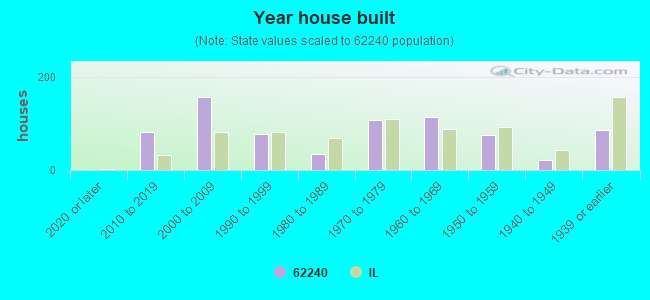


 Based on the data from the years 2002 - 2018 the average number of fires per year is 17. The highest number of fires - 30 took place in 2011, and the least - 2 in 2016. The data has a decreasing trend.
 When looking into fire subcategories, the most reports belonged to: Structure Fires (45.1%), and Outside Fires (45.1%).