Estimated zip code population in 2022: 4,937 Zip code population in 2010: 5,637 Zip code population in 2000: 5,526
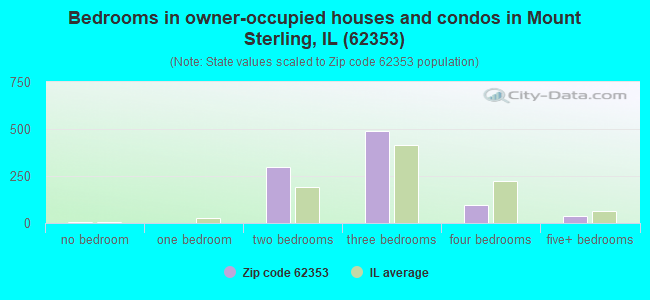
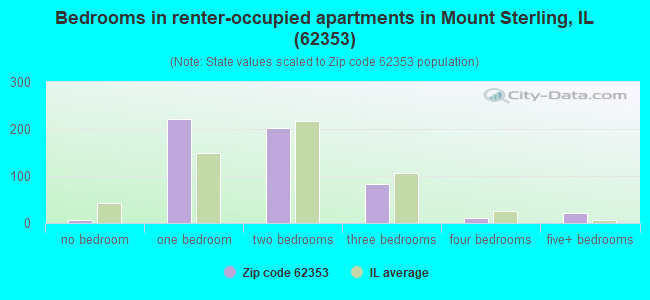
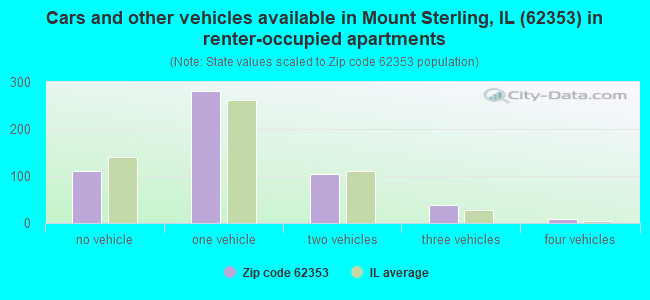
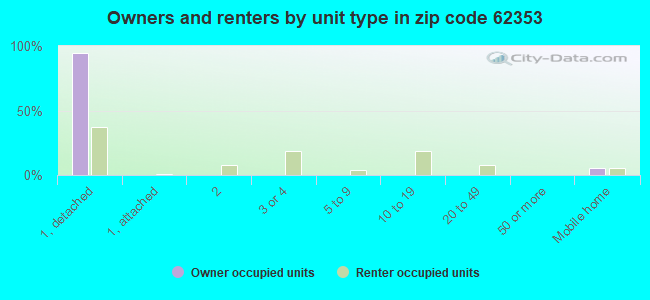
Houses and condos: 1,622 Renter-occupied apartments: 545
% of renters here:
37%
State:
33%
March 2022 cost of living index in zip code 62353: 74.2 (low, U.S. average is 100)
Land area: 187.3 sq. mi. Water area: 0.2 sq. mi.
Population density: 26 people per square mile
(very low).
OSM Map
General Map
Google Map
MSN Map
OSM Map
General Map
Google Map
MSN Map
OSM Map
General Map
Google Map
MSN Map
OSM Map
General Map
Google Map
MSN Map
Please wait while loading the map...
Real estate property taxes paid for housing units in 2022:
This zip code:
1.4% ($1,822)
Illinois:
2.0% ($4,912)
Median real estate property taxes paid for housing units with mortgages in 2022: $2,027 (1.4%) Median real estate property taxes paid for housing units with no mortgage in 2022: $1,560 (1.4%)
Business Search- 14 Million verified businesses
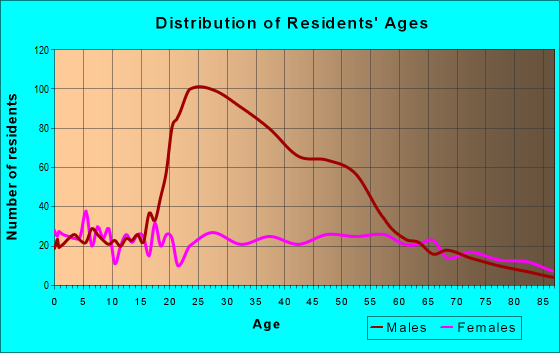
Males: 3,389
(68.6%)
Females: 1,548
(31.4%)
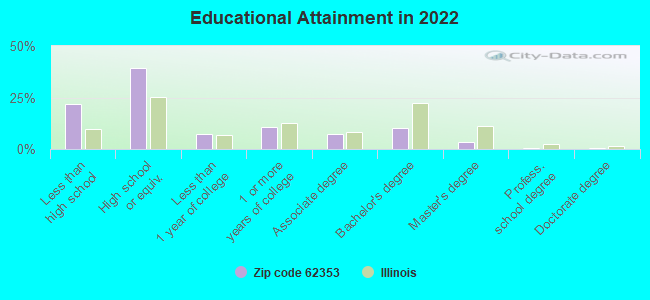
For population 25 years and over in 62353:
High school or higher: 76.4%
Bachelor's degree or higher: 13.7%
Graduate or professional degree: 3.9%
Unemployed: 1.9%
Mean travel time to work (commute): 13.9 minutes
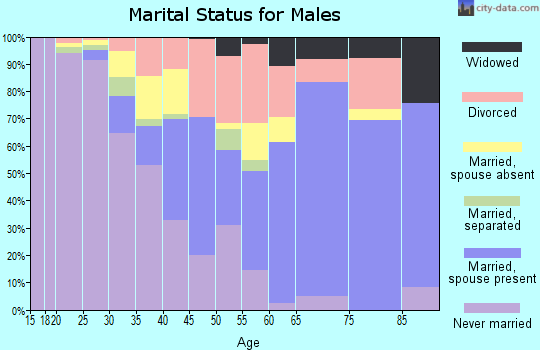
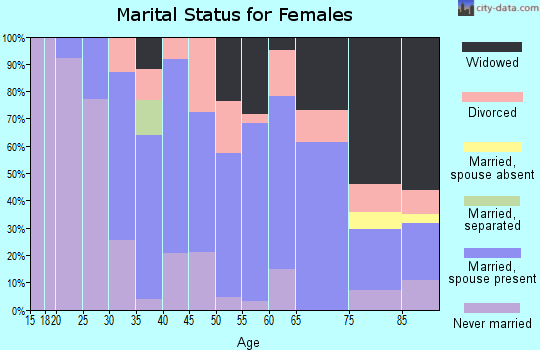
For population 15 years and over in 62353:
Never married: 49.0%
Now married: 29.7%
Separated: 1.6%
Widowed: 6.1%
Divorced: 13.6%
Zip code 62353 compared to state average:
Median house value below state average.
Unemployed percentage below state average.
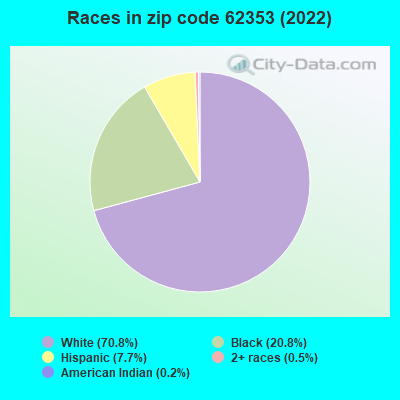
Hispanic race population percentage below state average.
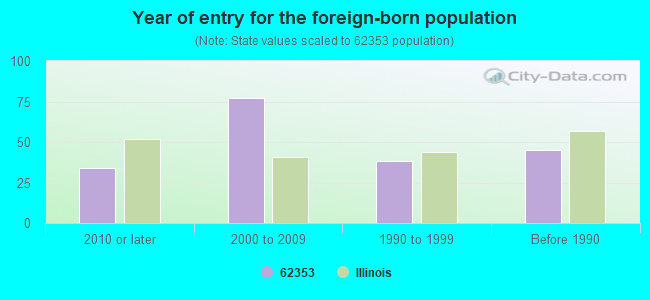
Foreign-born population percentage significantly below state average.
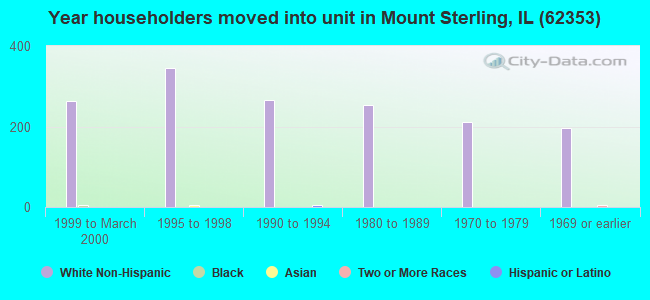
Length of stay since moving in significantly above state average.
Number of college students below state average.
Percentage of population with a bachelor's degree or higher significantly below state average.
Estimated median house/condo value in 2022: $129,746
62353:
$129,746
Illinois:
$251,600
According to our research of Illinois and other state lists, there were 3 registered sex offenders living in 62353 zip code as of April 27, 2024. The ratio of all residents to sex offenders in zip code 62353 is 1,857 to 1. The ratio of registered sex offenders to all residents in this zip code is lower than the state average.
Median resident age:
This zip code:
37.3 years
Illinois median age:
39.1 years
Average household size:
This zip code:
2.2 people
Illinois:
2.4 people
Averages for the 2020 tax year for zip code 62353, filed in 2021:
Average Adjusted Gross Income (AGI) in 2020: $56,884 (Individual Income Tax Returns)
Here:
$56,884
State:
$82,626
Salary/wage: $49,057 (reported on 76.2% of returns)
Here:
$49,057
State:
$66,640
(% of AGI for various income ranges: 1247.7% for AGIs below $25k, 3786.0% for AGIs $25k-50k, 6875.3% for AGIs $50k-75k, 9547.7% for AGIs $75k-100k, 15514.3% for AGIs $100k-200k)
Taxable interest for individuals: $1,132 (reported on 45.9% of returns)
This zip code:
$1,132
Illinois:
$2,376
(% of AGI for various income ranges: 34.3% for AGIs below $25k, 38.7% for AGIs $25k-50k, 55.9% for AGIs $50k-75k, 167.7% for AGIs $75k-100k, 215.7% for AGIs $100k-200k)
Ordinary dividends: $3,719 (reported on 15.1% of returns)
Here:
$3,719
State:
$9,061
(% of AGI for various income ranges: 20.3% for AGIs below $25k, 22.0% for AGIs $25k-50k, 34.1% for AGIs $50k-75k, 40.8% for AGIs $75k-100k, 520.7% for AGIs $100k-200k)
Net capital gain/loss in AGI: +$11,721 (reported on 16.3% of returns)
Here:
+$11,721
State:
+$31,684
(% of AGI for various income ranges: 25.3% for AGIs below $25k, 80.3% for AGIs $25k-50k, 110.0% for AGIs $50k-75k, 215.4% for AGIs $75k-100k, 499.3% for AGIs $100k-200k)
Profit/loss from business: +$11,336 (reported on 14.5% of returns)
Here:
+$11,336
State:
+$12,175
(% of AGI for various income ranges: 96.7% for AGIs below $25k, 165.7% for AGIs $25k-50k, 175.9% for AGIs $50k-75k, 295.4% for AGIs $75k-100k, 974.3% for AGIs $100k-200k)
Taxable individual retirement arrangement distribution: $11,446 (reported on 7.6% of returns)
62353:
$11,446
Illinois:
$21,613
(% of AGI for various income ranges: 54.7% for AGIs below $25k, 75.7% for AGIs $25k-50k, 151.2% for AGIs $50k-75k, 135.4% for AGIs $75k-100k, 474.3% for AGIs $100k-200k)
Total itemized deductions: $33,580 (reported on 2.9% of returns)
Here:
$33,580
State:
$34,948
(% of AGI for various income ranges: 455.9% for AGIs $50k-75k, 645.7% for AGIs $100k-200k)
Charity contributions: $9,825 (reported on 2.3% of returns)
Here:
$9,825
State:
$13,122
(% of AGI for various income ranges: 280.7% for AGIs $100k-200k)
Taxes paid: $6,860 (reported on 2.9% of returns)
62353:
$6,860
State:
$8,563
(% of AGI for various income ranges: 87.1% for AGIs $50k-75k, 139.3% for AGIs $100k-200k)
Earned income credit: $2,009 (reported on 12.8% of returns)
Here:
$2,009
State:
$2,311
(% of AGI for various income ranges: 94.0% for AGIs below $25k, 53.3% for AGIs $25k-50k)
Percentage of individuals using paid preparers for their 2020 taxes: 91.9%
Here:
92%
State:
93%
(% for various income ranges: 79.3% for AGIs below $25k, 97.4% for AGIs $25k-50k, 96.3% for AGIs $50k-75k, 100.0% for AGIs $75k-100k, 100.0% for AGIs $100k-200k, 100.0% for AGIs over 200k)
Averages for the 2012 tax year for zip code 62353, filed in 2013:
Average Adjusted Gross Income (AGI) in 2012: $50,278 (Individual Income Tax Returns)
Here:
$50,278
State:
$68,058
Salary/wage: $40,491 (reported on 81.3% of returns)
Here:
$40,491
State:
$55,396
(% of AGI for various income ranges: 69.2% for AGIs below $25k, 76.6% for AGIs $25k-50k, 76.6% for AGIs $50k-75k, 73.8% for AGIs $75k-100k, 49.0% for AGIs $100k-200k)
Taxable interest for individuals: $1,132 (reported on 41.5% of returns)
This zip code:
$1,132
Illinois:
$1,969
(% of AGI for various income ranges: 2.2% for AGIs below $25k, 0.6% for AGIs $25k-50k, 1.1% for AGIs $50k-75k, 0.5% for AGIs $75k-100k, 1.0% for AGIs $100k-200k)
Ordinary dividends: $2,315 (reported on 15.8% of returns)
Here:
$2,315
State:
$7,786
(% of AGI for various income ranges: 1.2% for AGIs below $25k, 1.1% for AGIs $25k-50k, 0.3% for AGIs $50k-75k, 0.4% for AGIs $75k-100k, 0.8% for AGIs $100k-200k)
Net capital gain/loss in AGI: +$8,855 (reported on 12.9% of returns)
Here:
+$8,855
State:
+$22,183
(% of AGI for various income ranges: 1.2% for AGIs below $25k, 1.3% for AGIs $25k-50k, 1.2% for AGIs $50k-75k, 1.1% for AGIs $75k-100k, 4.1% for AGIs $100k-200k)
Profit/loss from business: +$8,559 (reported on 15.8% of returns)
Here:
+$8,559
State:
+$12,903
(% of AGI for various income ranges: 5.6% for AGIs below $25k, 2.9% for AGIs $25k-50k, 1.9% for AGIs $50k-75k, 2.0% for AGIs $75k-100k, 2.6% for AGIs $100k-200k)
Taxable individual retirement arrangement distribution: $7,538 (reported on 9.4% of returns)
62353:
$7,538
Illinois:
$17,929
(% of AGI for various income ranges: 3.9% for AGIs below $25k, 1.2% for AGIs $25k-50k, 1.5% for AGIs $50k-75k, 1.5% for AGIs $100k-200k)
Total itemized deductions: $19,806 (19% of AGI, reported on 21.1% of returns)
Here:
$19,806
State:
$26,433
Here:
19.2% of AGI
State:
19.2% of AGI
(% of AGI for various income ranges: 7.5% for AGIs below $25k, 5.6% for AGIs $25k-50k, 6.9% for AGIs $50k-75k, 7.8% for AGIs $75k-100k, 10.9% for AGIs $100k-200k)
Charity contributions: $3,412 (reported on 15.2% of returns)
Here:
$3,412
State:
$4,525
(% of AGI for various income ranges: 0.6% for AGIs below $25k, 0.7% for AGIs $25k-50k, 0.9% for AGIs $50k-75k, 0.9% for AGIs $75k-100k, 1.4% for AGIs $100k-200k)
Taxes paid: $6,373 (reported on 21.6% of returns)
62353:
$6,373
State:
$11,968
(% of AGI for various income ranges: 1.2% for AGIs below $25k, 1.4% for AGIs $25k-50k, 2.1% for AGIs $50k-75k, 2.7% for AGIs $75k-100k, 4.2% for AGIs $100k-200k)
Earned income credit: $2,012 (reported on 15.2% of returns)
Here:
$2,012
State:
$2,349
(% of AGI for various income ranges: 4.7% for AGIs below $25k, 1.0% for AGIs $25k-50k)
Percentage of individuals using paid preparers for their 2012 taxes: 76.0%
Here:
76%
State:
57%
(% for various income ranges: 70.8% for AGIs below $25k, 73.3% for AGIs $25k-50k, 76.9% for AGIs $50k-75k, 88.9% for AGIs $75k-100k, 88.2% for AGIs $100k-200k)
Averages for the 2004 tax year for zip code 62353, filed in 2005:
Average Adjusted Gross Income (AGI) in 2004: $35,326 (Individual Income Tax Returns)
Here:
$35,326
State:
$54,625
Salary/wage: $31,628 (reported on 83.2% of returns)
Here:
$31,628
State:
$46,811
(% of AGI for various income ranges: 121.4% for AGIs below $10k, 71.4% for AGIs $10k-25k, 81.1% for AGIs $25k-50k, 82.8% for AGIs $50k-75k, 77.0% for AGIs $75k-100k, 48.2% for AGIs over 100k)
Taxable interest for individuals: $1,922 (reported on 49.0% of returns)
This zip code:
$1,922
Illinois:
$2,101
(% of AGI for various income ranges: 14.7% for AGIs below $10k, 4.7% for AGIs $10k-25k, 1.9% for AGIs $25k-50k, 1.7% for AGIs $50k-75k, 3.0% for AGIs $75k-100k, 2.1% for AGIs over 100k)
Taxable dividends: $3,143 (reported on 17.5% of returns)
Here:
$3,143
State:
$4,306
(% of AGI for various income ranges: 4.2% for AGIs below $10k, 1.1% for AGIs $10k-25k, 0.5% for AGIs $25k-50k, 0.1% for AGIs $50k-75k, 0.2% for AGIs $75k-100k, 6.1% for AGIs over 100k)
Net capital gain/loss: +$4,933 (reported on 16.6% of returns)
Here:
+$4,933
State:
+$17,321
(% of AGI for various income ranges: 1.9% for AGIs below $10k, 0.4% for AGIs $10k-25k, 1.4% for AGIs $25k-50k, 2.4% for AGIs $50k-75k, 2.8% for AGIs $75k-100k, 4.4% for AGIs over 100k)
Profit/loss from business: +$6,707 (reported on 15.3% of returns)
Here:
+$6,707
State:
+$11,771
(% of AGI for various income ranges: 1.4% for AGIs below $10k, 5.7% for AGIs $10k-25k, 2.5% for AGIs $25k-50k, 1.6% for AGIs $50k-75k, 0.7% for AGIs $75k-100k, 5.5% for AGIs over 100k)
Profit/loss from farming: +$589 (reported on 12.2% of returns)
Here:
+$589
State:
+$2,327
(% of AGI for various income ranges: -8.1% for AGIs below $10k, -1.3% for AGIs $10k-25k, 0.8% for AGIs $25k-50k, 1.7% for AGIs $50k-75k, -0.9% for AGIs $75k-100k, 0.2% for AGIs over 100k)
IRA payment deduction: $3,520 (reported on 2.9% of returns)
62353:
$3,520
Illinois:
$3,087
Total itemized deductions: $16,471 (22% of AGI, reported on 15.3% of returns)
Here:
$16,471
State:
$20,239
Here:
22.1% of AGI
State:
19.5% of AGI
(% of AGI for various income ranges: 15.0% for AGIs below $10k, 9.6% for AGIs $10k-25k, 4.7% for AGIs $25k-50k, 6.7% for AGIs $50k-75k, 5.4% for AGIs $75k-100k, 10.4% for AGIs over 100k)
Charity contributions deductions: $3,277 (4% of AGI, reported on 12.0% of returns)
Here:
$3,277
State:
$3,719
Here:
4.0% of AGI
State:
3.4% of AGI
(% of AGI for various income ranges: 1.2% for AGIs below $10k, 1.1% for AGIs $10k-25k, 0.4% for AGIs $25k-50k, 0.8% for AGIs $50k-75k, 1.1% for AGIs $75k-100k, 2.6% for AGIs over 100k)
Total tax: $4,675 (reported on 73.6% of returns)
62353:
$4,675
State:
$9,882
(% of AGI for various income ranges: 5.4% for AGIs below $10k, 4.5% for AGIs $10k-25k, 7.1% for AGIs $25k-50k, 8.1% for AGIs $50k-75k, 10.6% for AGIs $75k-100k, 18.8% for AGIs over 100k)
Earned income credit: $1,333 (reported on 12.4% of returns)
Here:
$1,333
State:
$1,788
Percentage of individuals using paid preparers for their 2004 taxes: 75.3%
Here:
75%
State:
61%
(% for various income ranges: 71.9% for AGIs below $10k, 74.1% for AGIs $10k-25k, 72.6% for AGIs $25k-50k, 79.4% for AGIs $50k-75k, 86.6% for AGIs $75k-100k, 91.5% for AGIs over 100k)
Household received Food Stamps/SNAP in the past 12 months: 211 Household did not receive Food Stamps/SNAP in the past 12 months: 1,265
Women who had a birth in the past 12 months: 104 (28 now married, 75 unmarried) Women who did not have a birth in the past 12 months: 581 (230 now married, 351 unmarried)
Housing units in zip code 62353 with a mortgage: 495 (43 second mortgage, 26 both second mortgage and home equity loan) Median monthly owner costs for units with a mortgage: $1,042 Median monthly owner costs for units without a mortgage: $425
Residents with income below the poverty level in 2022:
This zip code:
9.9%
Whole state:
11.9%
Residents with income below 50% of the poverty level in 2022:
This zip code:
7.6%
Whole state:
5.7%
Median number of rooms in houses and condos:
Here:
5.9
State:
6.4
Median number of rooms in apartments:
Here:
4.1
State:
4.1
Notable locations in this zip code not listed on our city pages
Notable locations in zip code 62353: Two Rivers Camp (A), Old Siloam Picnic Area (B), Buckhorn Townhall (C), Missouri Townhall (D), Mount Sterling Public Library (E), Brown County Ambulance Service (F), Brown County Fire Protection District (G), Mount Sterling Fire Department (H). Display/hide their locations on the map
Streams, rivers, and creeks: Missouri Creek (A), North Fork Shelby Creek (B), Dry Fork (C), Wells Fork (D), Doby Branch (E), South Fork Shelby Creek (F), Purpus Creek (G), South Branch (H), Town Branch (I). Display/hide their locations on the map
435 married couples with children.
278 single-parent households (119 men, 159 women).
92.8% of residents of 62353 zip code speak English at home.
5.6% of residents speak Spanish at home (69% very well, 13% well, 18% not well).
0.5% of residents speak other Indo-European language at home (91% very well, 9% not well).
0.1% of residents speak Asian or Pacific Island language at home (100% very well).
0.3% of residents speak other language at home (64% very well, 36% not well).
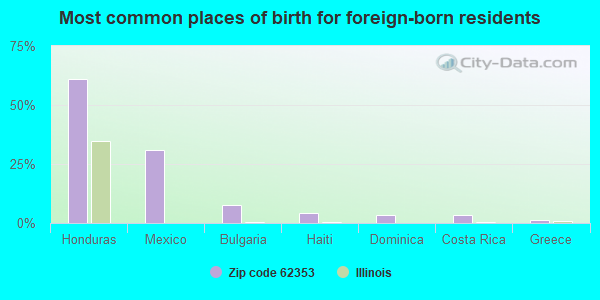
Foreign born population: 167 (3.4%) (80.4% of them are naturalized citizens)
This zip code:
3.4%
Whole state:
14.4%
61%Honduras
31%Mexico
8%Bulgaria
4%Haiti
4%Dominica
4%Costa Rica
1%Greece
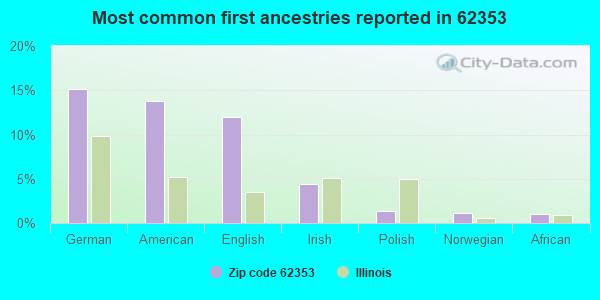
15%German
14%American
12%English
4%Irish
1%Polish
1%Norwegian
1%African
Year of entry for the foreign-born population
342010 or later
772000 to 2009
381990 to 1999
45Before 1990
Major facilities with environmental interests located in this zip code:
ILLINOIS AYERS OIL CO (W RAILROAD ST in MT STERLING, IL)
STATE MASTER (Illinois EPA Project) - AIR PROGRAM AIR MINOR (AIRS/AFS) Business SIC classification: PETROLEUM BULK STATIONS AND TERMINALS
CLINARD READY MIX (ROUTE 24 W in MOUNT STERLING, IL)
STATE MASTER (Illinois EPA Project) - AIR PROGRAM AIR MINOR (AIRS/AFS) CRITERIA AND HAZARDOUS AIR POLLUTANT INVENTORY (Inventory of air pollution sources) National Pollutant Discharge Elimination System NON-MAJOR (Tracking pollutant discharge elimination systems) - permit Business SIC classification: READY-MIXED CONCRETE Organizations: CLINARD READY MIX CO. (CONTACT/OWNER)
, CLINARD READY MIX, CO. (CONTACT/OWNER)
Alternative names: CLINARD READY MIX-MT. STERLING
MT. STERLING NORTHEAST STP (RURAL ROUTE 1 in MOUNT STERLING, IL)
STATE MASTER (Illinois EPA Project) - National Pollutant Discharge Elimination System Permit National Pollutant Discharge Elimination System NON-MAJOR (Tracking pollutant discharge elimination systems) - permit National Pollutant Discharge Elimination System NON-MAJOR (Tracking pollutant discharge elimination systems) - permit Business SIC classification: SEWERAGE SYSTEMS Alternative names: MT. STERLING STP
HOLLEMBEAK CONCRETE INC (402 PITTSFIELD RD in MOUNT STERLING, IL)
STATE MASTER (Illinois EPA Project) - AIR PROGRAM AIR MINOR (AIRS/AFS) Business SIC classification: READY-MIXED CONCRETE Alternative names: T. F. HOLLEMBEAK AND SON
MOORMAN GARAGE (221 W. CHESTNUT in MT. STERLING, IL)
STATE MASTER (Illinois EPA Project) - SOLID WASTE PROGRAM, SCRAP TIRE MANAGEMENT National Pollutant Discharge Elimination System NON-MAJOR (Tracking pollutant discharge elimination systems) - permit Organizations: MOORMAN'S GARAGE (CONTACT/OWNER)
MOBIL OIL CORP (224 W MAIN in MOUNT STERLING, IL)
STATE MASTER (Illinois EPA Project) - AIR PROGRAM AIR MINOR (AIRS/AFS) Business SIC classification: PETROLEUM BULK STATIONS AND TERMINALS Alternative names: EXXON MOBIL OIL CORPORATION
MOUNT STERLING SOUTHEAST STP (RR 4 STATE RT 107 PITTSFIELD R in MOUNT STERLING, IL)
STATE MASTER (Illinois EPA Project) - National Pollutant Discharge Elimination System Permit National Pollutant Discharge Elimination System NON-MAJOR (Tracking pollutant discharge elimination systems) - permit Business SIC classification: SEWERAGE SYSTEMS Alternative names: MT. STERLING SOUTHEAST STP
MT STERLING RADIATOR & WELDING (105 SW CROSS in MT STERLING, IL)
STATE MASTER (Illinois EPA Project) - HAZARDOUS WASTE PROGRAM Conditionally Exempt Small Quantity Generators, less than 100 kg/month of hazardous waste (Resource Conservation and Recovery Act (tracking hazardous waste))
CLAYTON CAMP POINT WTP (U.S. HIGHWAY 24 in MOUNT STERLING, IL)
STATE MASTER (Illinois EPA Project) - National Pollutant Discharge Elimination System Permit National Pollutant Discharge Elimination System NON-MAJOR (Tracking pollutant discharge elimination systems) - permit Business SIC classification: WATER SUPPLY
KROPP SALES & SERVICE (200 W MAIN ST in MOUNT STERLING, IL)
STATE MASTER (Illinois EPA Project) - SOLID WASTE PROGRAM, SCRAP TIRE MANAGEMENT Conditionally Exempt Small Quantity Generators, less than 100 kg/month of hazardous waste (Resource Conservation and Recovery Act (tracking hazardous waste)) - notification Organizations: KROPP MICHAEL (CONTACT/OWNER)
NORTH GRADE/BROWN CO JR HIGH (501 NW CROSS ST in MOUNT STERLING, IL)
(National Center for Education Statistics) - STATE ID-4600500102002 Organizations: BROWN COUNTY C U SCH DIST 1 (SCHOOL DISTRICT)
RONS TIRE SVC (HWY 99 TO 107 in MOUNT STERLING, IL)
(Resource Conservation and Recovery Act (tracking hazardous waste)) Organizations: WELLMAN RON (CONTACT/OWNER)
ILDOT BRG 005 0001 (RTE 24 OVER LAMOINE RIVER in MOUNT STERLING, IL)
Conditionally Exempt Small Quantity Generators, less than 100 kg/month of hazardous waste (Resource Conservation and Recovery Act (tracking hazardous waste)) - notification
Housing units lacking complete plumbing facilities: 1.3% Housing units lacking complete kitchen facilities: 2.3%
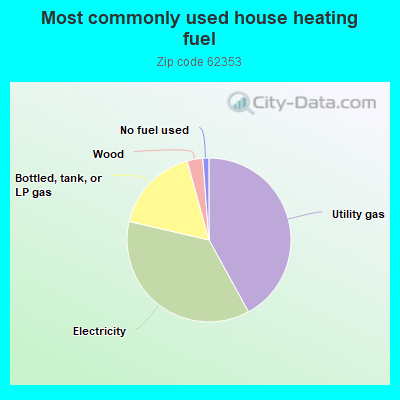
42.1%Utility gas
36.7%Electricity
17.1%Bottled, tank, or LP gas
3.1%Wood
1.2%No fuel used
Population in 1990: 4,058. Population change in the 1990s: +1,468 (+36.2%).
Place of birth for U.S.-born residents:
This state: 4,093
Northeast: 8
Midwest: 319
South: 175
West: 119
51% of the 62353 zip code residents lived in the same house 5 years ago. Out of people who lived in different houses, 26% lived in this county. Out of people who lived in different counties, 50% lived in Illinois.
85% of the 62353 zip code residents lived in the same house 1 year ago. Out of people who lived in different houses, 24% moved from this county. Out of people who lived in different houses, 74% moved from different county within same state. Out of people who lived in different houses, 6% moved from different state.
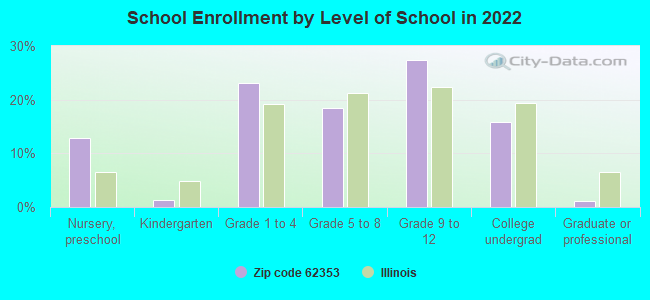
Private vs. public school enrollment:
Students in private schools in grades 1 to 8 (elementary and middle school): 33
Here:
10.5%
Illinois:
13.3%
Students in private schools in grades 9 to 12 (high school): 19
Here:
9.6%
Illinois:
9.9%
Students in private undergraduate colleges: 25
Here:
21.0%
Illinois:
27.4%
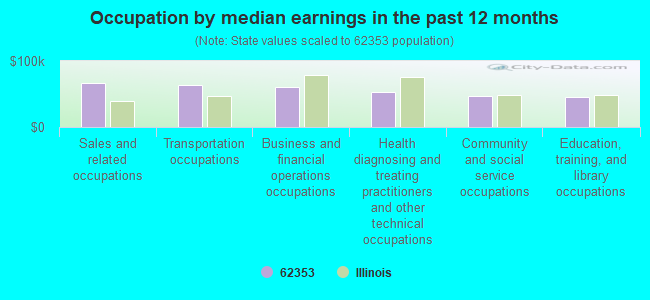
Occupation by median earnings in the past 12 months ($)
67,181Sales and related occupations
63,630Transportation occupations
60,978Business and financial operations occupations
52,644Health diagnosing and treating practitioners and other technical occupations
46,953Community and social service occupations
45,480Education, training, and library occupations
Companies with federal contracts located in this zip code:
DAVE CLINARD TRUCK SERVICE, IN (HWY 24 WEST in MT STERLING, IL; small business) : $5,016 in 2 contractsfrom 2001 to 2002
$4,930 with U.S. Army Corps of Engineers - civil program financing only for Miscellaneous Items. Signed on 2001-10-30. Completion date: 2001-10-22.
$86, same as above.Signed on 2002-01-14. Completion date: 2001-10-22.
Top industries in this zip code by the number of employees in 2005:
Wholesale Trade: General Line Grocery Merchant Wholesalers (500-999 employees: 1 establishment)
Health Care and Social Assistance: Child Day Care Services (100-249: 1, 1-4: 1)
Wholesale Trade: Petroleum and Petroleum Products Merchant Wholesalers (except Bulk Stations and Terminals) (50-99: 1)
Health Care and Social Assistance: Nursing Care Facilities (50-99: 1)
Health Care and Social Assistance: Other Individual and Family Services (50-99: 1)
Accommodation and Food Services: Limited-Service Restaurants (10-19: 2, 5-9: 3)
Other Services (except Public Administration): Religious Organizations (20-49: 1, 5-9: 1, 1-4: 4)
People in group quarters in 2010:
2,059 people in state prisons
51 people in nursing facilities/skilled-nursing facilities
People in group quarters in 2000:
1,912 people in state prisons
60 people in nursing homes
Fatal accident statistics in 2013:
Fatal accident count: 1
Vehicles involved in fatal accidents: 1
Fatal accidents caused by drunken drivers: 0
Fatalities: 1
Persons involved in fatal accidents: 2
Pedestrians involved in fatal accidents: 0
Fatal accident statistics in 2010:
Fatal accident count: 1
Vehicles involved in fatal accidents: 2
Fatal accidents caused by drunken drivers: 0
Fatalities: 1
Persons involved in fatal accidents: 3
Pedestrians involved in fatal accidents: 0
2002 - 2018 National Fire Incident Reporting System (NFIRS) incidents
According to the data from the years 2002 - 2018 the average number of fire incidents per year is 25. The highest number of reported fires - 49 took place in 2014, and the least - 12 in 2017. The data has a rising trend.
When looking into fire subcategories, the most incidents belonged to: Outside Fires (50.2%), and Structure Fires (33.8%).
Fire incident types reported to NFIRS in Zip Code 62353
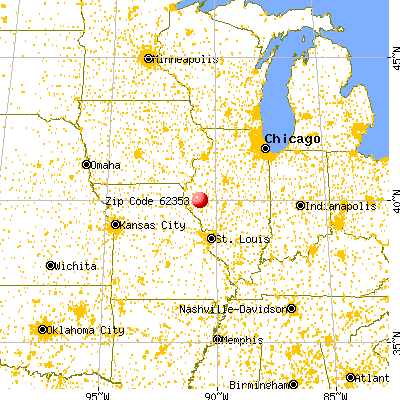


 Nearest zip codes: 62375, 62378, 62323, 62362, 62319, 62324.


 According to the data from the years 2002 - 2018 the average number of fire incidents per year is 25. The highest number of reported fires - 49 took place in 2014, and the least - 12 in 2017. The data has a rising trend.
 When looking into fire subcategories, the most incidents belonged to: Outside Fires (50.2%), and Structure Fires (33.8%).