Estimated zip code population in 2022: 1,278 Zip code population in 2010: 1,246 Zip code population in 2000: 948
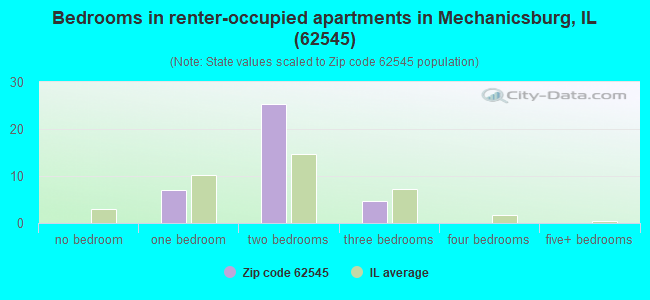
Houses and condos: 615 Renter-occupied apartments: 37
% of renters here:
6%
State:
33%
March 2022 cost of living index in zip code 62545: 85.0 (less than average, U.S. average is 100)
Land area: 27.7 sq. mi. Water area: 0.2 sq. mi.
Population density: 46 people per square mile
(very low).
OSM Map
General Map
Google Map
MSN Map
OSM Map
General Map
Google Map
MSN Map
OSM Map
General Map
Google Map
MSN Map
OSM Map
General Map
Google Map
MSN Map
Please wait while loading the map...
Real estate property taxes paid for housing units in 2022:
This zip code:
1.4% ($2,593)
Illinois:
2.0% ($4,912)
Median real estate property taxes paid for housing units with mortgages in 2022: $2,992 (1.5%) Median real estate property taxes paid for housing units with no mortgage in 2022: $2,325 (1.5%)
Business Search- 14 Million verified businesses
Males: 644
(50.4%)
Females: 633
(49.6%)
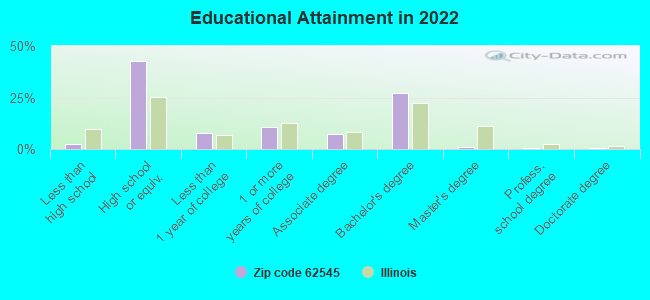
For population 25 years and over in 62545:
High school or higher: 97.2%
Bachelor's degree or higher: 29.1%
Graduate or professional degree: 2.0%
Unemployed: 1.6%
Mean travel time to work (commute): 27.6 minutes
For population 15 years and over in 62545:
Never married: 27.0%
Now married: 50.0%
Separated: 2.4%
Widowed: 7.1%
Divorced: 13.5%
Zip code 62545 compared to state average:
Unemployed percentage significantly below state average.
Black race population percentage significantly below state average.
Hispanic race population percentage significantly below state average.
Median age significantly above state average.
Foreign-born population percentage significantly below state average.
Renting percentage significantly below state average.
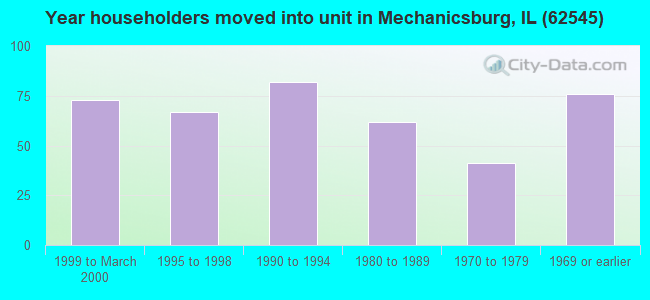
Length of stay since moving in significantly above state average.
Averages for the 2020 tax year for zip code 62545, filed in 2021:
Average Adjusted Gross Income (AGI) in 2020: $67,810 (Individual Income Tax Returns)
Here:
$67,810
State:
$82,626
Salary/wage: $56,975 (reported on 82.3% of returns)
Here:
$56,975
State:
$66,640
(% of AGI for various income ranges: 1147.5% for AGIs below $25k, 2895.5% for AGIs $25k-50k, 5653.8% for AGIs $50k-75k, 8243.3% for AGIs $75k-100k, 18782.5% for AGIs $100k-200k)
Taxable interest for individuals: $777 (reported on 41.9% of returns)
This zip code:
$777
Illinois:
$2,376
(% of AGI for various income ranges: 4.2% for AGIs below $25k, 52.7% for AGIs $25k-50k, 15.0% for AGIs $50k-75k, 31.7% for AGIs $75k-100k, 135.0% for AGIs $100k-200k)
Ordinary dividends: $2,600 (reported on 17.7% of returns)
Here:
$2,600
State:
$9,061
(% of AGI for various income ranges: 49.2% for AGIs below $25k, 61.3% for AGIs $50k-75k, 222.5% for AGIs $100k-200k)
Net capital gain/loss in AGI: +$3,627 (reported on 17.7% of returns)
Here:
+$3,627
State:
+$31,684
(% of AGI for various income ranges: 20.0% for AGIs below $25k, 46.2% for AGIs $50k-75k, 422.5% for AGIs $100k-200k)
Profit/loss from business: +$2,867 (reported on 9.7% of returns)
Here:
+$2,867
State:
+$12,175
(% of AGI for various income ranges: 50.8% for AGIs below $25k, 185.0% for AGIs $75k-100k)
Taxable individual retirement arrangement distribution: $14,520 (reported on 8.1% of returns)
62545:
$14,520
Illinois:
$21,613
(% of AGI for various income ranges: 250.9% for AGIs $25k-50k, 562.5% for AGIs $100k-200k)
Total itemized deductions: $23,100 (reported on 4.8% of returns)
Here:
$23,100
State:
$34,948
(% of AGI for various income ranges: 866.2% for AGIs $100k-200k)
Taxes paid: $7,700 (reported on 4.8% of returns)
62545:
$7,700
State:
$8,563
(% of AGI for various income ranges: 288.8% for AGIs $100k-200k)
Earned income credit: $1,812 (reported on 12.9% of returns)
Here:
$1,812
State:
$2,311
(% of AGI for various income ranges: 56.7% for AGIs below $25k, 70.0% for AGIs $25k-50k)
Percentage of individuals using paid preparers for their 2020 taxes: 95.2%
Here:
95%
State:
93%
(% for various income ranges: 93.8% for AGIs below $25k, 92.3% for AGIs $25k-50k, 100.0% for AGIs $50k-75k, 100.0% for AGIs $75k-100k, 93.3% for AGIs $100k-200k)
Averages for the 2012 tax year for zip code 62545, filed in 2013:
Average Adjusted Gross Income (AGI) in 2012: $54,405 (Individual Income Tax Returns)
Here:
$54,405
State:
$68,058
Salary/wage: $46,377 (reported on 86.9% of returns)
Here:
$46,377
State:
$55,396
(% of AGI for various income ranges: 72.3% for AGIs below $25k, 77.9% for AGIs $25k-50k, 72.0% for AGIs $50k-75k, 79.1% for AGIs $75k-100k, 71.0% for AGIs $100k-200k)
Taxable interest for individuals: $452 (reported on 37.7% of returns)
This zip code:
$452
Illinois:
$1,969
(% of AGI for various income ranges: 2.2% for AGIs below $25k, 0.2% for AGIs $25k-50k, 0.2% for AGIs $50k-75k, 0.2% for AGIs $75k-100k)
Ordinary dividends: $1,667 (reported on 14.8% of returns)
Here:
$1,667
State:
$7,786
(% of AGI for various income ranges: 1.9% for AGIs below $25k, 1.0% for AGIs $50k-75k, 0.3% for AGIs $100k-200k)
Profit/loss from business: +$6,971 (reported on 11.5% of returns)
Here:
+$6,971
State:
+$12,903
Taxable individual retirement arrangement distribution: $6,420 (reported on 8.2% of returns)
62545:
$6,420
Illinois:
$17,929
Total itemized deductions: $17,071 (18% of AGI, reported on 27.9% of returns)
Here:
$17,071
State:
$26,433
Here:
17.7% of AGI
State:
19.2% of AGI
(% of AGI for various income ranges: 10.1% for AGIs $25k-50k, 9.3% for AGIs $50k-75k, 7.4% for AGIs $75k-100k, 10.4% for AGIs $100k-200k)
Charity contributions: $2,464 (reported on 18.0% of returns)
Here:
$2,464
State:
$4,525
(% of AGI for various income ranges: 1.0% for AGIs $25k-50k, 0.6% for AGIs $75k-100k, 1.4% for AGIs $100k-200k)
Taxes paid: $7,329 (reported on 27.9% of returns)
62545:
$7,329
State:
$11,968
(% of AGI for various income ranges: 2.7% for AGIs $25k-50k, 3.6% for AGIs $50k-75k, 3.2% for AGIs $75k-100k, 5.3% for AGIs $100k-200k)
Earned income credit: $2,138 (reported on 13.1% of returns)
Here:
$2,138
State:
$2,349
(% of AGI for various income ranges: 5.3% for AGIs below $25k, 0.8% for AGIs $25k-50k)
Percentage of individuals using paid preparers for their 2012 taxes: 59.0%
Here:
59%
State:
57%
(% for various income ranges: 47.6% for AGIs below $25k, 57.1% for AGIs $25k-50k, 77.8% for AGIs $50k-75k, 62.5% for AGIs $75k-100k, 66.7% for AGIs $100k-200k)
Averages for the 2004 tax year for zip code 62545, filed in 2005:
Average Adjusted Gross Income (AGI) in 2004: $38,149 (Individual Income Tax Returns)
Here:
$38,149
State:
$54,625
Salary/wage: $35,061 (reported on 87.9% of returns)
Here:
$35,061
State:
$46,811
(% of AGI for various income ranges: 102.8% for AGIs below $10k, 73.6% for AGIs $10k-25k, 79.7% for AGIs $25k-50k, 84.7% for AGIs $50k-75k, 85.3% for AGIs $75k-100k, 69.3% for AGIs over 100k)
Taxable interest for individuals: $771 (reported on 39.9% of returns)
This zip code:
$771
Illinois:
$2,101
(% of AGI for various income ranges: 2.4% for AGIs below $10k, 2.6% for AGIs $10k-25k, 0.7% for AGIs $25k-50k, 0.7% for AGIs $50k-75k, 0.3% for AGIs $75k-100k, 0.1% for AGIs over 100k)
Taxable dividends: $607 (reported on 18.5% of returns)
Here:
$607
State:
$4,306
(% of AGI for various income ranges: 0.2% for AGIs below $10k, 0.8% for AGIs $10k-25k, 0.5% for AGIs $25k-50k, 0.2% for AGIs $50k-75k, 0.1% for AGIs $75k-100k, 0.1% for AGIs over 100k)
Net capital gain/loss: +$2,077 (reported on 11.2% of returns)
Here:
+$2,077
State:
+$17,321
(% of AGI for various income ranges: -0.2% for AGIs below $10k, 0.3% for AGIs $25k-50k, 1.8% for AGIs $50k-75k, 0.0% for AGIs $75k-100k)
Profit/loss from business: +$4,425 (reported on 13.8% of returns)
Here:
+$4,425
State:
+$11,771
(% of AGI for various income ranges: 8.2% for AGIs below $10k, 2.5% for AGIs $10k-25k, 1.8% for AGIs $25k-50k, 0.1% for AGIs $50k-75k, 3.3% for AGIs $75k-100k)
Profit/loss from farming: +$526 (reported on 3.3% of returns)
Here:
+$526
State:
+$2,327
Total itemized deductions: $12,500 (20% of AGI, reported on 20.7% of returns)
Here:
$12,500
State:
$20,239
Here:
19.5% of AGI
State:
19.5% of AGI
(% of AGI for various income ranges: 5.8% for AGIs $10k-25k, 6.2% for AGIs $25k-50k, 6.3% for AGIs $50k-75k, 9.1% for AGIs $75k-100k, 7.3% for AGIs over 100k)
Charity contributions deductions: $1,824 (3% of AGI, reported on 14.7% of returns)
Here:
$1,824
State:
$3,719
Here:
2.6% of AGI
State:
3.4% of AGI
(% of AGI for various income ranges: 0.4% for AGIs $25k-50k, 0.4% for AGIs $50k-75k, 1.7% for AGIs $75k-100k, 1.0% for AGIs over 100k)
Total tax: $4,422 (reported on 77.7% of returns)
62545:
$4,422
State:
$9,882
(% of AGI for various income ranges: 2.2% for AGIs below $10k, 4.2% for AGIs $10k-25k, 7.2% for AGIs $25k-50k, 8.5% for AGIs $50k-75k, 10.4% for AGIs $75k-100k, 16.5% for AGIs over 100k)
Earned income credit: $1,908 (reported on 13.1% of returns)
Here:
$1,908
State:
$1,788
Percentage of individuals using paid preparers for their 2004 taxes: 59.1%
Here:
59%
State:
61%
(% for various income ranges: 50.5% for AGIs below $10k, 58.1% for AGIs $10k-25k, 59.0% for AGIs $25k-50k, 62.9% for AGIs $50k-75k, 64.2% for AGIs $75k-100k, 78.3% for AGIs over 100k)
Household received Food Stamps/SNAP in the past 12 months: 42 Household did not receive Food Stamps/SNAP in the past 12 months: 536
Women who had a birth in the past 12 months: 7 (7 now married, 0 unmarried) Women who did not have a birth in the past 12 months: 269 (151 now married, 116 unmarried)
Housing units in zip code 62545 with a mortgage: 310 (34 second mortgage, 32 both second mortgage and home equity loan) Houses without a mortgage: 9
Median monthly owner costs for units with a mortgage: $1,455 Median monthly owner costs for units without a mortgage: $602
Residents with income below the poverty level in 2022:
This zip code:
6.5%
Whole state:
11.9%
Residents with income below 50% of the poverty level in 2022:
This zip code:
3.2%
Whole state:
5.7%
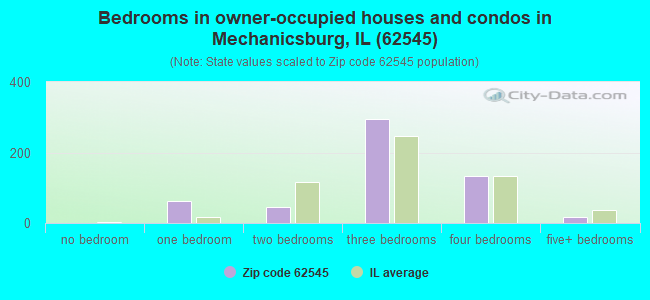
Median number of rooms in houses and condos:
Here:
6.2
State:
6.4
Median number of rooms in apartments:
Here:
4.3
State:
4.1
Notable locations in this zip code not listed on our city pages
Size of family households: 144 2-persons, 83 3-persons, 60 4-persons, 33 5-persons, 2 6-persons
Size of nonfamily households: 198 1-person, 64 2-persons
152 married couples with children.
20 single-parent households (5 men, 15 women).
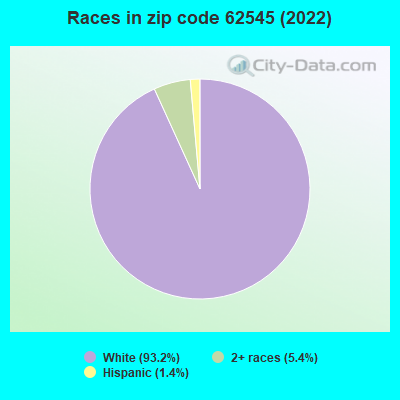
99.5% of residents of 62545 zip code speak English at home.
0.1% of residents speak Spanish at home (100% well).
Foreign born population: 0 (0.0%)
:
0.0%
Whole state:
14.4%
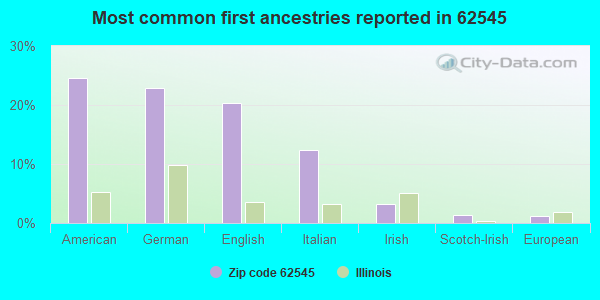
25%American
23%German
20%English
12%Italian
3%Irish
1%Scotch-Irish
1%European
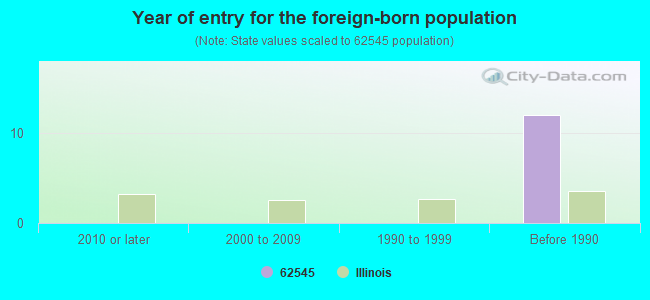
Year of entry for the foreign-born population
02010 or later
02000 to 2009
01990 to 1999
12Before 1990
Facilities with environmental interests located in this zip code:
MECHANICSBURG BUFFALO WC WTP (600 SOUTH CHURCH STREET in MECHANICSBURG, IL)
STATE MASTER (Illinois EPA Project) - National Pollutant Discharge Elimination System Permit National Pollutant Discharge Elimination System NON-MAJOR (Tracking pollutant discharge elimination systems) - permit Business SIC classification: WATER SUPPLY
SANG-CHRIS SAND&GRAVEL, LLC (2850 YOUNG ROAD in MECHANICSBURG, IL)
STATE MASTER (Illinois EPA Project) - National Pollutant Discharge Elimination System Permit National Pollutant Discharge Elimination System NON-MAJOR (Tracking pollutant discharge elimination systems) - permit Business SIC classification: CONSTRUCTION SAND AND GRAVEL
MECHANICSBURG FARMERS GRAIN COMPANY (305 NORTH 1ST STREET in MECHANICSBURG, IL)
AIR MINOR (AIRS/AFS) CRITERIA AND HAZARDOUS AIR POLLUTANT INVENTORY (Inventory of air pollution sources) Business SIC classification: GRAIN AND FIELD BEANS
CHRISTIAN CNTY BRIDGE # 3003 (COUNTY HIGHWAY # 3 in ROBY, IL)
Conditionally Exempt Small Quantity Generators, less than 100 kg/month of hazardous waste (Resource Conservation and Recovery Act (tracking hazardous waste)) - notification Organizations: CHRISTIAN COUNTY (CONTACT/OWNER)
Housing units lacking complete plumbing facilities: 3.6% Housing units lacking complete kitchen facilities: 3.0%
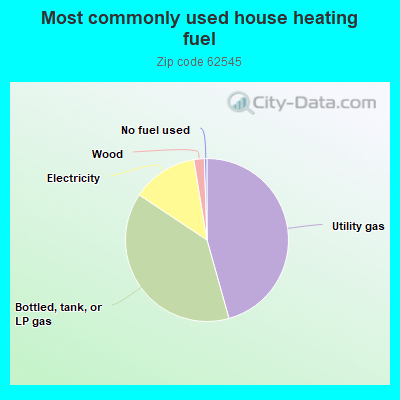
45.8%Utility gas
38.8%Bottled, tank, or LP gas
13.1%Electricity
2.1%Wood
0.5%No fuel used
Population in 1990: 2,228.
Place of birth for U.S.-born residents:
This state: 1,083
Midwest: 97
South: 44
West: 33
70% of the 62545 zip code residents lived in the same house 5 years ago. Out of people who lived in different houses, 63% lived in this county. Out of people who lived in different counties, 50% lived in Illinois.
96% of the 62545 zip code residents lived in the same house 1 year ago. Out of people who lived in different houses, 17% moved from this county. Out of people who lived in different houses, 36% moved from different county within same state. Out of people who lived in different houses, 55% moved from different state.
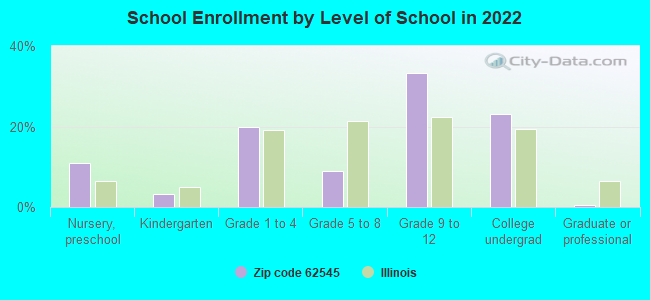
Private vs. public school enrollment:
Students in private schools in grades 1 to 8 (elementary and middle school):
Here:
0.0%
Illinois:
13.3%
Students in private schools in grades 9 to 12 (high school): 14
Here:
20.3%
Illinois:
9.9%
Students in private undergraduate colleges: 8
Here:
17.1%
Illinois:
27.4%
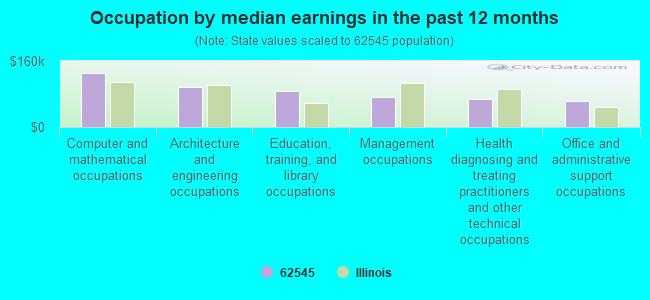
Occupation by median earnings in the past 12 months ($)
132,041Computer and mathematical occupations
96,274Architecture and engineering occupations
88,160Education, training, and library occupations
72,602Management occupations
66,682Health diagnosing and treating practitioners and other technical occupations
63,970Office and administrative support occupations
Top industries in this zip code by the number of employees in 2005:
Mining: Crude Petroleum and Natural Gas Extraction (20-49 employees: 1 establishment)
Health Care and Social Assistance: Homes for the Elderly (20-49: 1)
Mining: Construction Sand and Gravel Mining (10-19: 1)
Construction: Plumbing, Heating, and Air-Conditioning Contractors (5-9: 1)
Construction: Other Heavy and Civil Engineering Construction (5-9: 1)
Wholesale Trade: Grain and Field Bean Merchant Wholesalers (5-9: 1)
Construction: New Single-Family Housing Construction (except Operative Builders) (1-4: 1)
Fatal accident statistics in 2011:
Fatal accident count: 1
Vehicles involved in fatal accidents: 1
Fatal accidents caused by drunken drivers: 1
Fatalities: 1
Persons involved in fatal accidents: 1
Pedestrians involved in fatal accidents: 0
2002 - 2018 National Fire Incident Reporting System (NFIRS) incidents
According to the data from the years 2002 - 2018 the average number of fire incidents per year is 11. The highest number of fire incidents - 23 took place in 2013, and the least - 1 in 2004. The data has a growing trend.
When looking into fire subcategories, the most reports belonged to: Structure Fires (45.5%), and Outside Fires (39.7%).
Fire incident types reported to NFIRS in Zip Code 62545

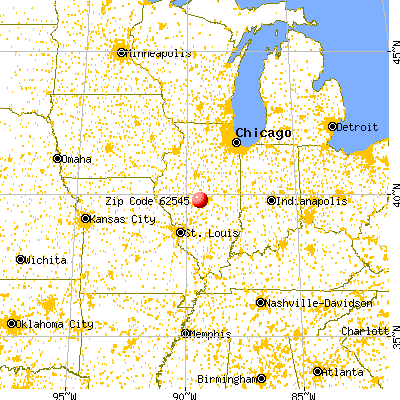


 Nearest zip codes: 62531, 62520, 62515, 62563, 62547, 62561.
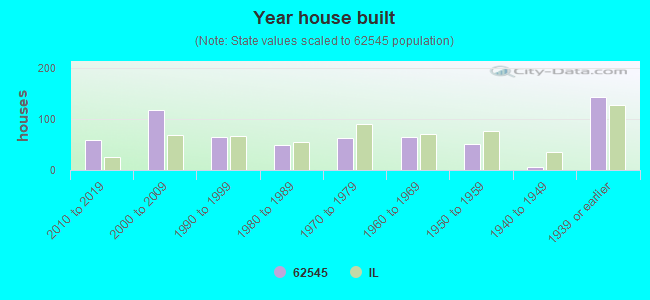


 According to the data from the years 2002 - 2018 the average number of fire incidents per year is 11. The highest number of fire incidents - 23 took place in 2013, and the least - 1 in 2004. The data has a growing trend.
 When looking into fire subcategories, the most reports belonged to: Structure Fires (45.5%), and Outside Fires (39.7%).