Estimated zip code population in 2022: 1,542 Zip code population in 2010: 1,630 Zip code population in 2000: 1,755
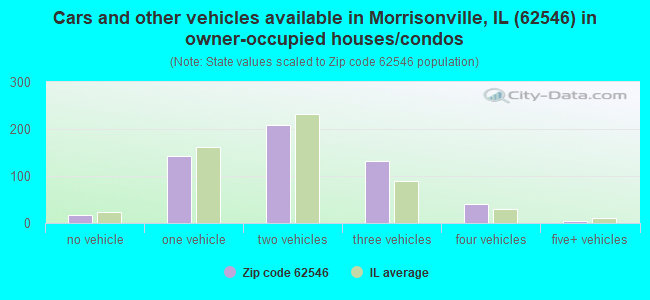
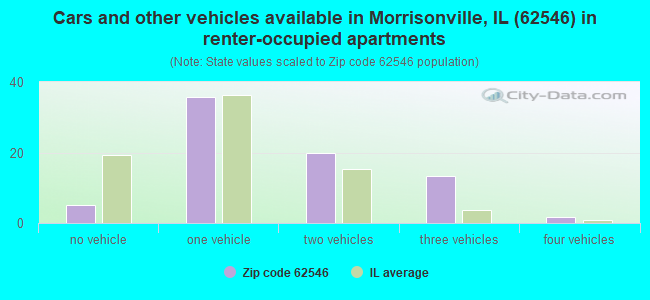
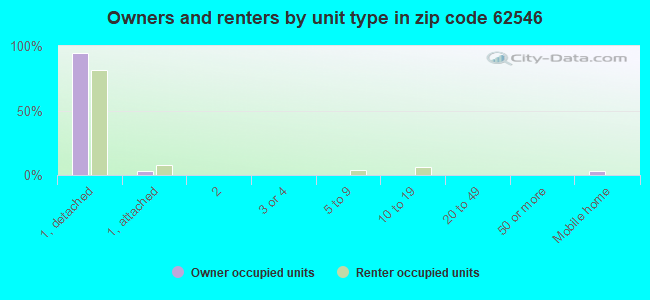
Houses and condos: 679 Renter-occupied apartments: 76
% of renters here:
12%
State:
33%
March 2022 cost of living index in zip code 62546: 83.8 (less than average, U.S. average is 100)
Land area: 114.5 sq. mi. Water area: 0.0 sq. mi.
Population density: 13 people per square mile
(very low).
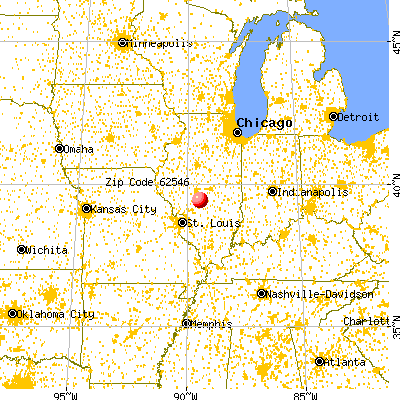
OSM Map
General Map
Google Map
MSN Map
OSM Map
General Map
Google Map
MSN Map
OSM Map
General Map
Google Map
MSN Map
OSM Map
General Map
Google Map
MSN Map
Please wait while loading the map...
Real estate property taxes paid for housing units in 2022:
This zip code:
1.9% ($2,333)
Illinois:
2.0% ($4,912)
Median real estate property taxes paid for housing units with mortgages in 2022: $2,392 (1.6%) Median real estate property taxes paid for housing units with no mortgage in 2022: $2,204 (2.0%)
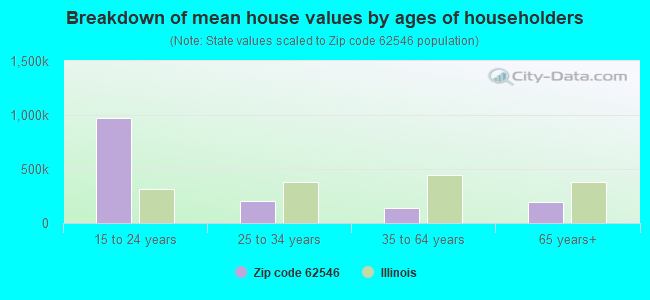
Estimated median house/condo value in 2022: $125,642
62546:
$125,642
Illinois:
$251,600
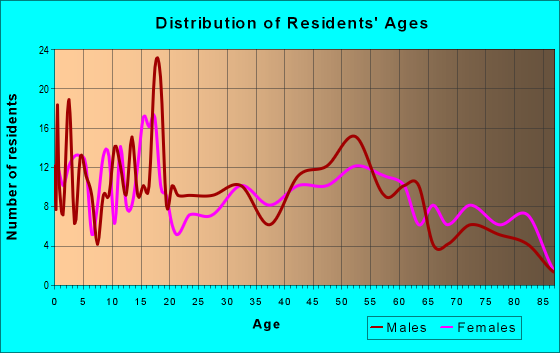
Median resident age:
This zip code:
43.2 years
Illinois median age:
39.1 years
Average household size:
This zip code:
2.5 people
Illinois:
2.4 people
Averages for the 2020 tax year for zip code 62546, filed in 2021:
Average Adjusted Gross Income (AGI) in 2020: $65,492 (Individual Income Tax Returns)
Here:
$65,492
State:
$82,626
Salary/wage: $50,454 (reported on 80.8% of returns)
Here:
$50,454
State:
$66,640
(% of AGI for various income ranges: 1160.8% for AGIs below $25k, 3400.0% for AGIs $25k-50k, 6455.0% for AGIs $50k-75k, 11684.0% for AGIs $75k-100k, 16466.2% for AGIs $100k-200k)
Taxable interest for individuals: $1,047 (reported on 43.8% of returns)
This zip code:
$1,047
Illinois:
$2,376
(% of AGI for various income ranges: 24.6% for AGIs below $25k, 44.2% for AGIs $25k-50k, 125.0% for AGIs $50k-75k, 36.0% for AGIs $75k-100k, 165.0% for AGIs $100k-200k)
Ordinary dividends: $1,856 (reported on 24.7% of returns)
Here:
$1,856
State:
$9,061
(% of AGI for various income ranges: 24.6% for AGIs below $25k, 29.2% for AGIs $25k-50k, 140.0% for AGIs $50k-75k, 34.0% for AGIs $75k-100k, 172.5% for AGIs $100k-200k)
Net capital gain/loss in AGI: +$5,255 (reported on 15.1% of returns)
Here:
+$5,255
State:
+$31,684
(% of AGI for various income ranges: 14.6% for AGIs below $25k, 170.0% for AGIs $50k-75k, 528.8% for AGIs $100k-200k)
Profit/loss from business: +$8,890 (reported on 13.7% of returns)
Here:
+$8,890
State:
+$12,175
(% of AGI for various income ranges: 103.8% for AGIs below $25k, 200.0% for AGIs $50k-75k, 742.5% for AGIs $100k-200k)
Taxable individual retirement arrangement distribution: $6,500 (reported on 6.8% of returns)
62546:
$6,500
Illinois:
$21,613
(% of AGI for various income ranges: 98.5% for AGIs below $25k, 246.2% for AGIs $50k-75k)
Earned income credit: $2,178 (reported on 12.3% of returns)
Here:
$2,178
State:
$2,311
(% of AGI for various income ranges: 85.4% for AGIs below $25k, 70.8% for AGIs $25k-50k)
Percentage of individuals using paid preparers for their 2020 taxes: 95.9%
Here:
96%
State:
93%
(% for various income ranges: 94.7% for AGIs below $25k, 100.0% for AGIs $25k-50k, 91.7% for AGIs $50k-75k, 100.0% for AGIs $75k-100k, 94.1% for AGIs $100k-200k)
Averages for the 2012 tax year for zip code 62546, filed in 2013:
Average Adjusted Gross Income (AGI) in 2012: $55,154 (Individual Income Tax Returns)
Here:
$55,154
State:
$68,058
Salary/wage: $41,243 (reported on 80.3% of returns)
Here:
$41,243
State:
$55,396
(% of AGI for various income ranges: 68.5% for AGIs below $25k, 73.5% for AGIs $25k-50k, 75.8% for AGIs $50k-75k, 69.9% for AGIs $75k-100k, 41.8% for AGIs $100k-200k)
Taxable interest for individuals: $1,297 (reported on 47.4% of returns)
This zip code:
$1,297
Illinois:
$1,969
(% of AGI for various income ranges: 3.1% for AGIs below $25k, 1.2% for AGIs $25k-50k, 0.5% for AGIs $50k-75k, 2.1% for AGIs $75k-100k, 0.6% for AGIs $100k-200k)
Ordinary dividends: $1,330 (reported on 26.3% of returns)
Here:
$1,330
State:
$7,786
(% of AGI for various income ranges: 1.3% for AGIs below $25k, 0.4% for AGIs $25k-50k, 0.6% for AGIs $50k-75k, 0.7% for AGIs $75k-100k, 0.6% for AGIs $100k-200k)
Net capital gain/loss in AGI: +$900 (reported on 13.2% of returns)
Here:
+$900
State:
+$22,183
(% of AGI for various income ranges: 0.5% for AGIs below $25k, 0.4% for AGIs $100k-200k)
Profit/loss from business: +$9,808 (reported on 15.8% of returns)
Here:
+$9,808
State:
+$12,903
(% of AGI for various income ranges: 5.2% for AGIs below $25k, 3.3% for AGIs $25k-50k, 3.4% for AGIs $50k-75k, 3.1% for AGIs $100k-200k)
Taxable individual retirement arrangement distribution: $6,283 (reported on 7.9% of returns)
62546:
$6,283
Illinois:
$17,929
Total itemized deductions: $16,767 (17% of AGI, reported on 19.7% of returns)
Here:
$16,767
State:
$26,433
Here:
16.8% of AGI
State:
19.2% of AGI
(% of AGI for various income ranges: 9.3% for AGIs $25k-50k, 6.0% for AGIs $50k-75k, 6.1% for AGIs $75k-100k, 5.7% for AGIs $100k-200k)
Charity contributions: $2,500 (reported on 11.8% of returns)
Here:
$2,500
State:
$4,525
(% of AGI for various income ranges: 0.9% for AGIs $25k-50k, 0.6% for AGIs $75k-100k, 0.7% for AGIs $100k-200k)
Taxes paid: $6,807 (reported on 19.7% of returns)
62546:
$6,807
State:
$11,968
(% of AGI for various income ranges: 2.1% for AGIs $25k-50k, 2.2% for AGIs $50k-75k, 2.7% for AGIs $75k-100k, 3.0% for AGIs $100k-200k)
Earned income credit: $2,209 (reported on 14.5% of returns)
Here:
$2,209
State:
$2,349
(% of AGI for various income ranges: 5.4% for AGIs below $25k, 1.3% for AGIs $25k-50k)
Percentage of individuals using paid preparers for their 2012 taxes: 68.4%
Here:
68%
State:
57%
(% for various income ranges: 61.5% for AGIs below $25k, 70.6% for AGIs $25k-50k, 69.2% for AGIs $50k-75k, 66.7% for AGIs $75k-100k, 81.8% for AGIs $100k-200k)
Averages for the 2004 tax year for zip code 62546, filed in 2005:
Average Adjusted Gross Income (AGI) in 2004: $36,807 (Individual Income Tax Returns)
Here:
$36,807
State:
$54,625
Salary/wage: $30,397 (reported on 80.2% of returns)
Here:
$30,397
State:
$46,811
(% of AGI for various income ranges: 108.0% for AGIs below $10k, 62.1% for AGIs $10k-25k, 73.0% for AGIs $25k-50k, 68.9% for AGIs $50k-75k, 70.1% for AGIs $75k-100k, 45.9% for AGIs over 100k)
Taxable interest for individuals: $1,519 (reported on 54.4% of returns)
This zip code:
$1,519
Illinois:
$2,101
(% of AGI for various income ranges: 9.0% for AGIs below $10k, 4.1% for AGIs $10k-25k, 1.2% for AGIs $25k-50k, 2.5% for AGIs $50k-75k, 1.1% for AGIs $75k-100k, 2.2% for AGIs over 100k)
Taxable dividends: $1,150 (reported on 27.5% of returns)
Here:
$1,150
State:
$4,306
(% of AGI for various income ranges: 5.9% for AGIs below $10k, 1.6% for AGIs $10k-25k, 0.4% for AGIs $25k-50k, 1.0% for AGIs $50k-75k, 0.6% for AGIs $75k-100k, 0.4% for AGIs over 100k)
Net capital gain/loss: +$2,187 (reported on 16.2% of returns)
Here:
+$2,187
State:
+$17,321
(% of AGI for various income ranges: -1.3% for AGIs below $10k, -0.1% for AGIs $10k-25k, 0.5% for AGIs $25k-50k, 0.3% for AGIs $50k-75k, 1.5% for AGIs $75k-100k, 3.3% for AGIs over 100k)
Profit/loss from business: +$7,391 (reported on 16.1% of returns)
Here:
+$7,391
State:
+$11,771
(% of AGI for various income ranges: 9.2% for AGIs below $10k, 3.7% for AGIs $10k-25k, 3.0% for AGIs $25k-50k, 5.7% for AGIs $50k-75k, 0.3% for AGIs $75k-100k, 1.1% for AGIs over 100k)
Profit/loss from farming: +$12,421 (reported on 11.5% of returns)
Here:
+$12,421
State:
+$2,327
(% of AGI for various income ranges: 2.3% for AGIs below $10k, 3.9% for AGIs $10k-25k, 2.8% for AGIs $25k-50k, -0.2% for AGIs $50k-75k, 3.1% for AGIs $75k-100k, 13.6% for AGIs over 100k)
IRA payment deduction: $2,931 (reported on 3.5% of returns)
62546:
$2,931
Illinois:
$3,087
Total itemized deductions: $13,328 (24% of AGI, reported on 15.5% of returns)
Here:
$13,328
State:
$20,239
Here:
23.7% of AGI
State:
19.5% of AGI
(% of AGI for various income ranges: 18.2% for AGIs below $10k, 9.1% for AGIs $10k-25k, 4.3% for AGIs $25k-50k, 5.3% for AGIs $50k-75k, 5.6% for AGIs $75k-100k, 3.9% for AGIs over 100k)
Charity contributions deductions: $2,345 (4% of AGI, reported on 10.5% of returns)
Here:
$2,345
State:
$3,719
Here:
3.8% of AGI
State:
3.4% of AGI
(% of AGI for various income ranges: 0.7% for AGIs $10k-25k, 0.6% for AGIs $25k-50k, 0.8% for AGIs $50k-75k, 0.7% for AGIs $75k-100k, 0.5% for AGIs over 100k)
Total tax: $4,796 (reported on 75.5% of returns)
62546:
$4,796
State:
$9,882
(% of AGI for various income ranges: 3.3% for AGIs below $10k, 4.5% for AGIs $10k-25k, 7.5% for AGIs $25k-50k, 9.5% for AGIs $50k-75k, 11.6% for AGIs $75k-100k, 16.8% for AGIs over 100k)
Earned income credit: $1,692 (reported on 13.0% of returns)
Here:
$1,692
State:
$1,788
Percentage of individuals using paid preparers for their 2004 taxes: 71.4%
Here:
71%
State:
61%
(% for various income ranges: 66.5% for AGIs below $10k, 69.2% for AGIs $10k-25k, 72.1% for AGIs $25k-50k, 77.6% for AGIs $50k-75k, 71.7% for AGIs $75k-100k, 78.9% for AGIs over 100k)
Household received Food Stamps/SNAP in the past 12 months: 65 Household did not receive Food Stamps/SNAP in the past 12 months: 552
Women who had a birth in the past 12 months: 33 (5 now married, 28 unmarried) Women who did not have a birth in the past 12 months: 233 (131 now married, 100 unmarried)
Housing units in zip code 62546 with a mortgage: 246 (5 second mortgage, 5 both second mortgage and home equity loan) Houses without a mortgage: 9
Median monthly owner costs for units with a mortgage: $1,234 Median monthly owner costs for units without a mortgage: $490
Residents with income below the poverty level in 2022:
This zip code:
10.6%
Whole state:
11.9%
Residents with income below 50% of the poverty level in 2022:
This zip code:
2.2%
Whole state:
5.7%
Median number of rooms in houses and condos:
Here:
6.3
State:
6.4
Median number of rooms in apartments:
Here:
5.2
State:
4.1
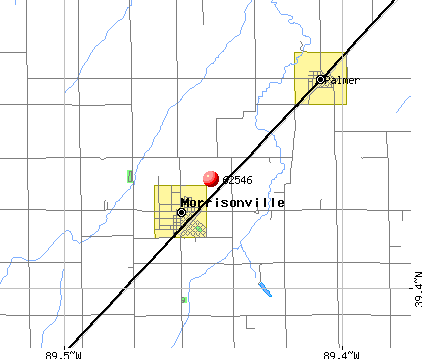
Notable locations in this zip code not listed on our city pages
Notable locations in zip code 62546: Bloome Farms (A), Vancil Farm (B), Morrisonville Community Ambulance Service (C), Morrisonville - Palmer Volunteer Fire District (D). Display/hide their locations on the map
Churches in zip code 62546 include: First Baptist Church (A), Saint Maurice Catholic Church (B), United Methodist Church of Morrisonville (C). Display/hide their locations on the map
Size of family households: 257 2-persons, 45 3-persons, 93 4-persons, 31 5-persons, 5 6-persons, 5 7-or-more-persons
Size of nonfamily households: 163 1-person, 18 2-persons
212 married couples with children.
127 single-parent households (65 men, 62 women).
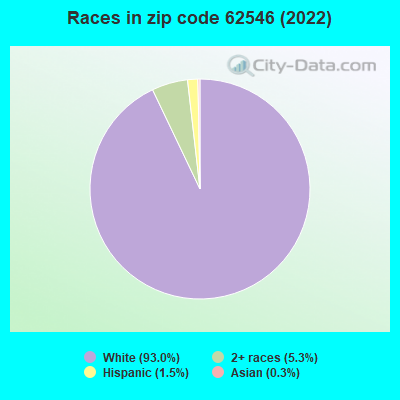
98.3% of residents of 62546 zip code speak English at home.
0.8% of residents speak Spanish at home (73% very well, 27% not well).
0.2% of residents speak other Indo-European language at home (100% very well).
0.2% of residents speak Asian or Pacific Island language at home (100% well).
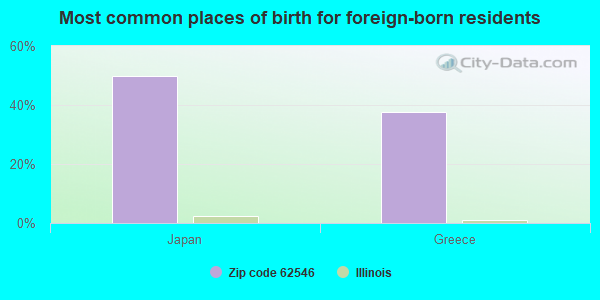
Foreign born population: 8 (0.5%) (100.0% of them are naturalized citizens)
This zip code:
0.5%
Whole state:
14.4%
50%Japan
38%Greece
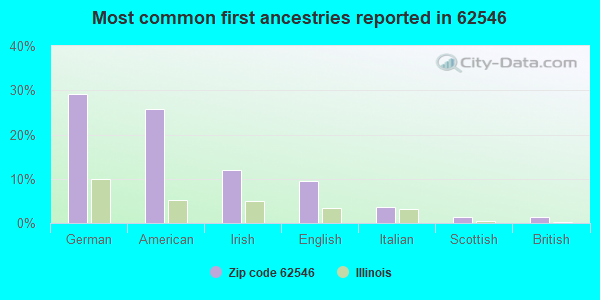
29%German
26%American
12%Irish
10%English
4%Italian
1%Scottish
1%British
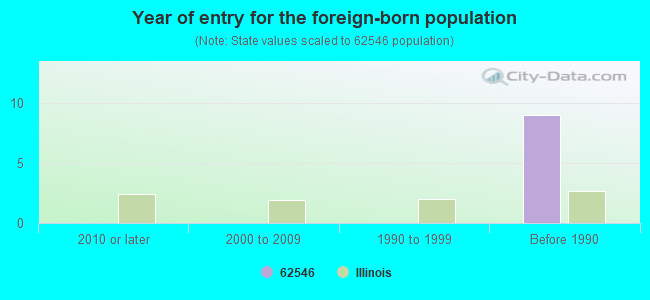
Year of entry for the foreign-born population
02010 or later
02000 to 2009
01990 to 1999
9Before 1990
Major facilities with environmental interests located in this zip code:
MORRISONVILLE FARMERS COOP (702 VANDEVEER ST in MORRISONVILLE, IL)
STATE MASTER (Illinois EPA Project) - AIR PROGRAM AIR MINOR (AIRS/AFS) CRITERIA AND HAZARDOUS AIR POLLUTANT INVENTORY (Inventory of air pollution sources) COMMUNITY WATER SYSTEM (SDWIS) - SDWIS-IL0210300 14663, WATER TREATMENT PLANT Business SIC classification: GRAIN AND FIELD BEANS
MORRISONVILLE JR HIGH SCHOOL (P O BOX 13 in MORRISONVILLE, IL)
(Geographic Names Information System) (National Center for Education Statistics) - STATE ID-1001100101001 (National Center for Education Statistics) - STATE ID-1001100100002 Organizations: MORRISONVILLE C U SCH DIST 1 (SCHOOL DISTRICT)
MORRISONVILLE STP (CARRIE STREET in MORRISONVILLE, IL)
STATE MASTER (Illinois EPA Project) - National Pollutant Discharge Elimination System Permit, National Pollutant Discharge Elimination System NON-MAJOR (Tracking pollutant discharge elimination systems) - permit National Pollutant Discharge Elimination System NON-MAJOR (Tracking pollutant discharge elimination systems) - permit Business SIC classification: SEWERAGE SYSTEMS Alternative names: MORRISONVILLE STP, VILLAGE OF, MORRISONVILLE, VILLAGE OF
POGGENPOHL REDI-MIX (6TH AND SMITH in MORRISONVILLE, IL)
STATE MASTER (Illinois EPA Project) - AIR PROGRAM AIR MINOR (AIRS/AFS) CRITERIA AND HAZARDOUS AIR POLLUTANT INVENTORY (Inventory of air pollution sources) Business SIC classification: READY-MIXED CONCRETE Business NAICS classification: READY-MIX CONCRETE MANUFACTURING.
MIDSTATE GRAIN INC (10 MI S TAYLORVILLE ON NOKOMIS in MORRISONVILLE, IL)
STATE MASTER (Illinois EPA Project) - National Pollutant Discharge Elimination System Permit National Pollutant Discharge Elimination System NON-MAJOR (Tracking pollutant discharge elimination systems) - permit Organizations: MID-STATE GRAIN, INC. (CONTACT/OWNER)
Alternative names: MID-STATE GRAIN, INC.
CHRISTIAN COUNTY FARMERS SUPPLY CO (RT 48 in MORRISONVILLE, IL)
STATE MASTER (Illinois EPA Project) - AIR PROGRAM AIR MINOR (AIRS/AFS) CRITERIA AND HAZARDOUS AIR POLLUTANT INVENTORY (Inventory of air pollution sources) Business SIC classification: PETROLEUM BULK STATIONS AND TERMINALS
MORRISONVILLE ELEM SCHOOL (P O BOX 13 in MORRISONVILLE, IL)
(National Center for Education Statistics) - STATE ID-1001100102001 Organizations: MORRISONVILLE C U SCH DIST 1 (SCHOOL DISTRICT)
CHRISMONT SAFE SCHOOL (PO BOX 187 in MORRISONVILLE, IL)
(National Center for Education Statistics) - STATE ID-1000000009301 Organizations: CHRISTIAN/MONTGOMERY ROE (SCHOOL DISTRICT)
KAISER AGRICULTURAL CHEMICALS (CO HWY 1 & 10 in MORRISONVILLE, IL)
(Resource Conservation and Recovery Act (tracking hazardous waste))
CHRISTIAN COUNTY FARMERS SUPPLY CO (1/2 MI E ON CITY BLACKTOP in MORRISONVILLE, IL)
(Resource Conservation and Recovery Act (tracking hazardous waste))
H & H TRANSPORT, INC. (AT COUNTY ROAD 2400 & 1650 E. in MORRISONVILLE, IL)
National Pollutant Discharge Elimination System NON-MAJOR (Tracking pollutant discharge elimination systems) - permit
RAYMOND O'BRIEN (CTY. RD 900 N & CTY. RD 400 E. in MORRISONVILLE, IL)
National Pollutant Discharge Elimination System NON-MAJOR (Tracking pollutant discharge elimination systems) - permit Alternative names: O'BRIEN, RAYMOND
MARSCH LOUIS (PO BOX 42 RTE 48 SO in MORRISONVILLE, IL)
Small Quantity Generators, between 100 kg and 1000 kg of hazardous waste/month (Resource Conservation and Recovery Act (tracking hazardous waste)) - notification
Housing units lacking complete plumbing facilities: 1.3% Housing units lacking complete kitchen facilities: 1.3%
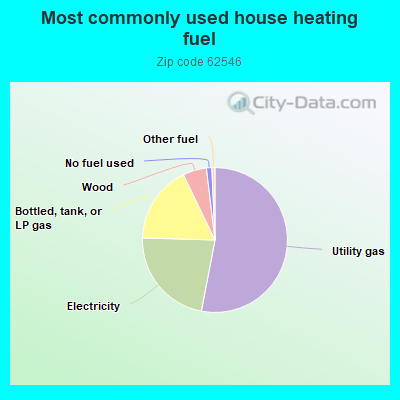
53.4%Utility gas
22.6%Electricity
17.5%Bottled, tank, or LP gas
5.3%Wood
1.2%No fuel used
0.7%Other fuel
Population in 1990: 1,418. Population change in the 1990s: +337 (+23.8%).
Place of birth for U.S.-born residents:
This state: 1,419
Northeast: 38
Midwest: 53
South: 11
West: 3
69% of the 62546 zip code residents lived in the same house 5 years ago. Out of people who lived in different houses, 65% lived in this county. Out of people who lived in different counties, 50% lived in Illinois.
92% of the 62546 zip code residents lived in the same house 1 year ago. Out of people who lived in different houses, 91% moved from this county. Out of people who lived in different houses, 2% moved from different county within same state.
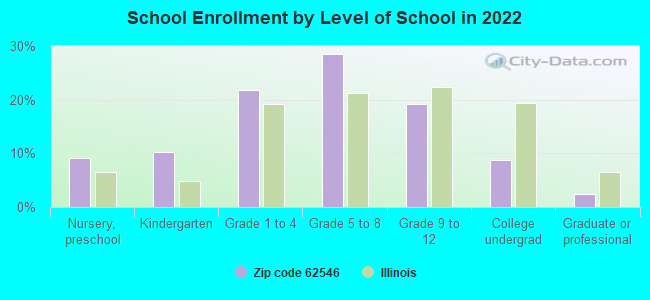
Private vs. public school enrollment:
Students in private schools in grades 1 to 8 (elementary and middle school): 11
Here:
6.7%
Illinois:
13.3%
Students in private schools in grades 9 to 12 (high school):
Here:
0.0%
Illinois:
9.9%
Students in private undergraduate colleges: 3
Here:
12.3%
Illinois:
27.4%
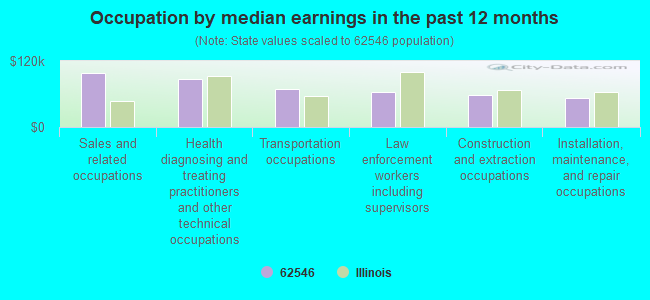
Occupation by median earnings in the past 12 months ($)
98,395Sales and related occupations
87,438Health diagnosing and treating practitioners and other technical occupations
68,720Transportation occupations
63,510Law enforcement workers including supervisors
57,689Construction and extraction occupations
52,524Installation, maintenance, and repair occupations
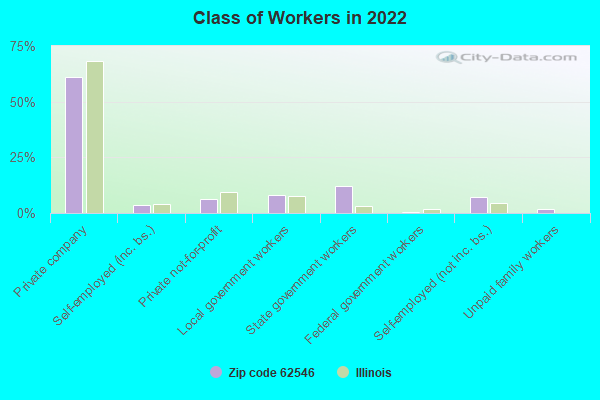
Top industries in this zip code by the number of employees in 2005:
Construction: Highway, Street, and Bridge Construction (10-19: 1)
Other Services (except Public Administration): Religious Organizations (5-9: 1, 1-4: 1)
Finance and Insurance: Commercial Banking (5-9: 1, 1-4: 1)
Health Care and Social Assistance: Ambulance Services (5-9: 1)
Educational Services: Elementary and Secondary Schools (5-9: 1)
Wholesale Trade: Grain and Field Bean Merchant Wholesalers (5-9: 1)
Fatal accident statistics in 2011:
Fatal accident count: 1
Vehicles involved in fatal accidents: 1
Fatal accidents caused by drunken drivers: 0
Fatalities: 1
Persons involved in fatal accidents: 1
Pedestrians involved in fatal accidents: 1
Fatal accident statistics in 2010:
Fatal accident count: 1
Vehicles involved in fatal accidents: 2
Fatal accidents caused by drunken drivers: 1
Fatalities: 1
Persons involved in fatal accidents: 2
Pedestrians involved in fatal accidents: 0
2002 - 2018 National Fire Incident Reporting System (NFIRS) incidents
According to the data from the years 2002 - 2018 the average number of fire incidents per year is 9. The highest number of fire incidents - 16 took place in 2018, and the least - 1 in 2004. The data has a growing trend.
When looking into fire subcategories, the most reports belonged to: Outside Fires (50.6%), and Structure Fires (32.7%).
Fire incident types reported to NFIRS in Zip Code 62546


 Nearest zip codes: 62556, 62538, 62540, 62570, 62517, 62533.


 According to the data from the years 2002 - 2018 the average number of fire incidents per year is 9. The highest number of fire incidents - 16 took place in 2018, and the least - 1 in 2004. The data has a growing trend.
 When looking into fire subcategories, the most reports belonged to: Outside Fires (50.6%), and Structure Fires (32.7%).