Estimated zip code population in 2022: 5,590 Zip code population in 2010: 5,111 Zip code population in 2000: 3,739
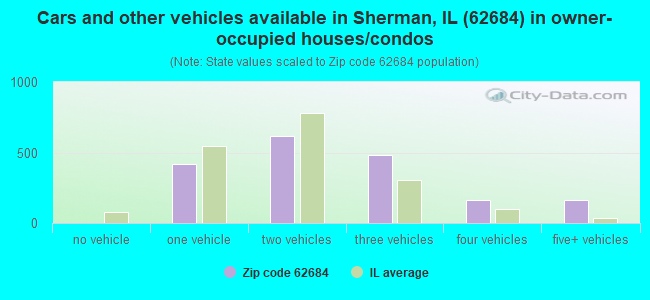
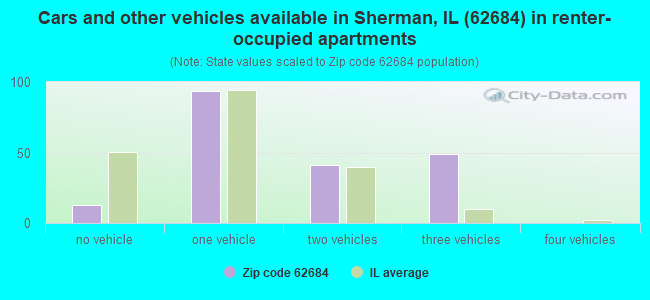
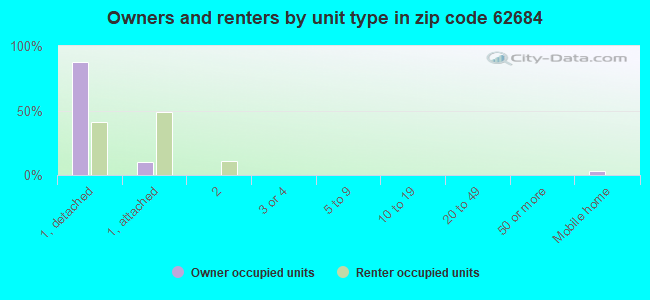
Houses and condos: 2,050 Renter-occupied apartments: 196
% of renters here:
10%
State:
33%
March 2022 cost of living index in zip code 62684: 81.9 (low, U.S. average is 100)
Land area: 25.1 sq. mi. Water area: 0.1 sq. mi.
Population density: 223 people per square mile
(very low).
OSM Map
General Map
Google Map
MSN Map
OSM Map
General Map
Google Map
MSN Map
OSM Map
General Map
Google Map
MSN Map
OSM Map
General Map
Google Map
MSN Map
Please wait while loading the map...
Real estate property taxes paid for housing units in 2022:
This zip code:
1.9% ($5,657)
Illinois:
2.0% ($4,912)
Median real estate property taxes paid for housing units with mortgages in 2022: $6,293 (2.0%) Median real estate property taxes paid for housing units with no mortgage in 2022: $3,993 (1.7%)
Business Search- 14 Million verified businesses
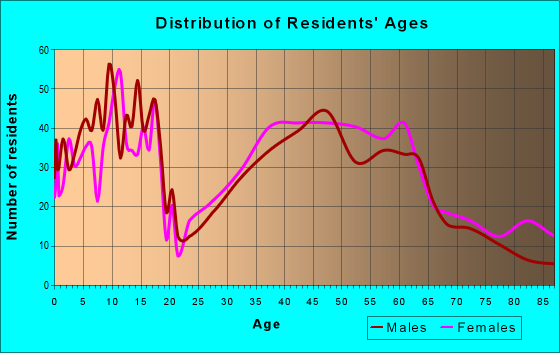
Males: 2,601
(46.5%)
Females: 2,988
(53.5%)
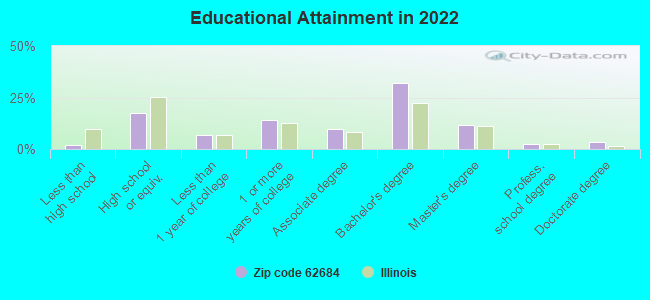
For population 25 years and over in 62684:
High school or higher: 98.4%
Bachelor's degree or higher: 49.8%
Graduate or professional degree: 17.6%
Unemployed: 1.5%
Mean travel time to work (commute): 19.7 minutes
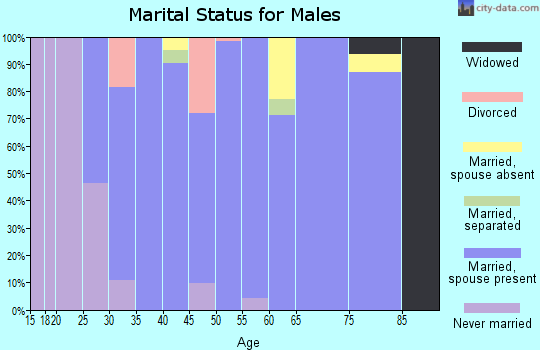
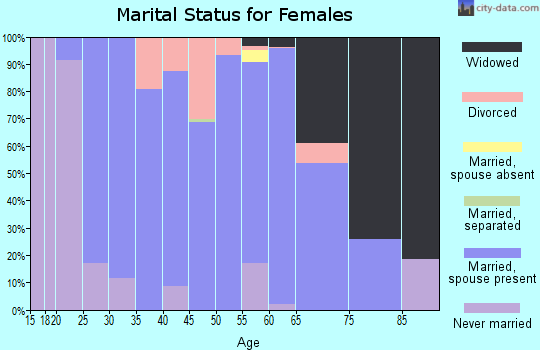
For population 15 years and over in 62684:
Never married: 21.7%
Now married: 62.5%
Separated: 0.4%
Widowed: 7.2%
Divorced: 8.2%
Zip code 62684 compared to state average:
Median household income above state average.
Unemployed percentage significantly below state average.
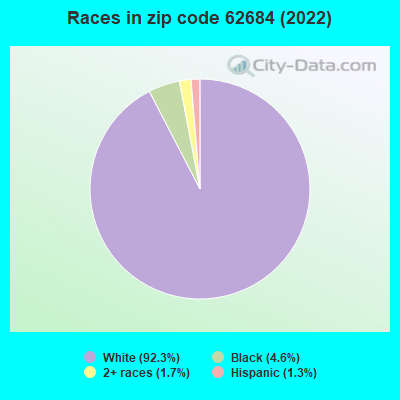
Black race population percentage significantly below state average.
Hispanic race population percentage significantly below state average.
Foreign-born population percentage significantly below state average.
Renting percentage significantly below state average.
Length of stay since moving in significantly above state average.
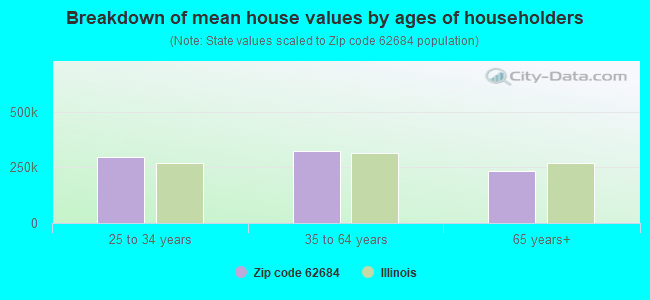
Estimated median house/condo value in 2022: $291,166
62684:
$291,166
Illinois:
$251,600
According to our research of Illinois and other state lists, there was 1 registered sex offender living in 62684 zip code as of April 27, 2024. The ratio of all residents to sex offenders in zip code 62684 is 5,661 to 1. The ratio of registered sex offenders to all residents in this zip code is much lower than the state average.
Median resident age:
This zip code:
42.2 years
Illinois median age:
39.1 years
Average household size:
This zip code:
2.7 people
Illinois:
2.4 people
Averages for the 2020 tax year for zip code 62684, filed in 2021:
Average Adjusted Gross Income (AGI) in 2020: $93,360 (Individual Income Tax Returns)
Here:
$93,360
State:
$82,626
Salary/wage: $79,082 (reported on 79.8% of returns)
Here:
$79,082
State:
$66,640
(% of AGI for various income ranges: 1093.5% for AGIs below $25k, 3124.1% for AGIs $25k-50k, 5172.6% for AGIs $50k-75k, 7836.7% for AGIs $75k-100k, 16617.3% for AGIs $100k-200k, 50536.2% for AGIs over 200k)
Taxable interest for individuals: $791 (reported on 55.5% of returns)
This zip code:
$791
Illinois:
$2,376
(% of AGI for various income ranges: 18.1% for AGIs below $25k, 33.4% for AGIs $25k-50k, 43.0% for AGIs $50k-75k, 64.2% for AGIs $75k-100k, 106.2% for AGIs $100k-200k, 263.8% for AGIs over 200k)
Ordinary dividends: $3,627 (reported on 29.3% of returns)
Here:
$3,627
State:
$9,061
(% of AGI for various income ranges: 40.3% for AGIs below $25k, 65.9% for AGIs $25k-50k, 118.5% for AGIs $50k-75k, 156.2% for AGIs $75k-100k, 207.1% for AGIs $100k-200k, 955.0% for AGIs over 200k)
Net capital gain/loss in AGI: +$10,413 (reported on 23.6% of returns)
Here:
+$10,413
State:
+$31,684
(% of AGI for various income ranges: 13.0% for AGIs below $25k, 44.8% for AGIs $25k-50k, 50.0% for AGIs $50k-75k, 139.2% for AGIs $75k-100k, 311.2% for AGIs $100k-200k, 5393.8% for AGIs over 200k)
Profit/loss from business: +$14,327 (reported on 14.1% of returns)
Here:
+$14,327
State:
+$12,175
(% of AGI for various income ranges: 97.8% for AGIs below $25k, 69.0% for AGIs $25k-50k, 149.6% for AGIs $50k-75k, 138.8% for AGIs $75k-100k, 349.8% for AGIs $100k-200k, 2903.8% for AGIs over 200k)
Taxable individual retirement arrangement distribution: $18,483 (reported on 11.4% of returns)
62684:
$18,483
Illinois:
$21,613
(% of AGI for various income ranges: 43.2% for AGIs below $25k, 140.3% for AGIs $25k-50k, 267.4% for AGIs $50k-75k, 347.5% for AGIs $75k-100k, 584.6% for AGIs $100k-200k, 770.0% for AGIs over 200k)
Total itemized deductions: $27,432 (reported on 8.4% of returns)
Here:
$27,432
State:
$34,948
(% of AGI for various income ranges: 373.8% for AGIs $25k-50k, 378.3% for AGIs $75k-100k, 495.8% for AGIs $100k-200k, 2078.8% for AGIs over 200k)
Charity contributions: $12,013 (reported on 5.7% of returns)
Here:
$12,013
State:
$13,122
(% of AGI for various income ranges: 27.2% for AGIs $25k-50k, 43.3% for AGIs $75k-100k, 187.5% for AGIs $100k-200k, 898.8% for AGIs over 200k)
Taxes paid: $8,064 (reported on 8.4% of returns)
62684:
$8,064
State:
$8,563
(% of AGI for various income ranges: 68.3% for AGIs $25k-50k, 120.8% for AGIs $75k-100k, 169.2% for AGIs $100k-200k, 592.5% for AGIs over 200k)
Earned income credit: $1,844 (reported on 6.1% of returns)
Here:
$1,844
State:
$2,311
(% of AGI for various income ranges: 39.2% for AGIs below $25k, 51.7% for AGIs $25k-50k)
Percentage of individuals using paid preparers for their 2020 taxes: 94.7%
Here:
95%
State:
93%
(% for various income ranges: 93.0% for AGIs below $25k, 94.6% for AGIs $25k-50k, 94.3% for AGIs $50k-75k, 97.0% for AGIs $75k-100k, 95.0% for AGIs $100k-200k, 95.2% for AGIs over 200k)
Averages for the 2012 tax year for zip code 62684, filed in 2013:
Average Adjusted Gross Income (AGI) in 2012: $82,358 (Individual Income Tax Returns)
Here:
$82,358
State:
$68,058
Salary/wage: $65,157 (reported on 81.8% of returns)
Here:
$65,157
State:
$55,396
(% of AGI for various income ranges: 66.4% for AGIs below $25k, 67.4% for AGIs $25k-50k, 69.2% for AGIs $50k-75k, 74.6% for AGIs $75k-100k, 77.4% for AGIs $100k-200k, 34.1% for AGIs over 200k)
Taxable interest for individuals: $1,023 (reported on 52.2% of returns)
This zip code:
$1,023
Illinois:
$1,969
(% of AGI for various income ranges: 1.8% for AGIs below $25k, 1.4% for AGIs $25k-50k, 0.8% for AGIs $50k-75k, 0.3% for AGIs $75k-100k, 0.5% for AGIs $100k-200k, 0.7% for AGIs over 200k)
Ordinary dividends: $3,462 (reported on 28.9% of returns)
Here:
$3,462
State:
$7,786
(% of AGI for various income ranges: 2.6% for AGIs below $25k, 2.2% for AGIs $25k-50k, 0.6% for AGIs $50k-75k, 0.9% for AGIs $75k-100k, 0.8% for AGIs $100k-200k, 1.9% for AGIs over 200k)
Net capital gain/loss in AGI: +$15,278 (reported on 21.3% of returns)
Here:
+$15,278
State:
+$22,183
(% of AGI for various income ranges: 0.8% for AGIs $25k-50k, 0.7% for AGIs $75k-100k, 0.5% for AGIs $100k-200k, 15.2% for AGIs over 200k)
Profit/loss from business: +$11,568 (reported on 13.4% of returns)
Here:
+$11,568
State:
+$12,903
(% of AGI for various income ranges: 5.1% for AGIs below $25k, 1.8% for AGIs $25k-50k, 2.2% for AGIs $50k-75k, 1.5% for AGIs $75k-100k, 2.8% for AGIs $100k-200k)
Taxable individual retirement arrangement distribution: $12,974 (reported on 12.3% of returns)
62684:
$12,974
Illinois:
$17,929
(% of AGI for various income ranges: 4.8% for AGIs below $25k, 3.1% for AGIs $25k-50k, 1.7% for AGIs $50k-75k, 2.7% for AGIs $75k-100k, 2.4% for AGIs $100k-200k)
Total itemized deductions: $20,554 (16% of AGI, reported on 46.6% of returns)
Here:
$20,554
State:
$26,433
Here:
15.8% of AGI
State:
19.2% of AGI
(% of AGI for various income ranges: 12.5% for AGIs below $25k, 11.7% for AGIs $25k-50k, 12.7% for AGIs $50k-75k, 12.7% for AGIs $75k-100k, 13.1% for AGIs $100k-200k, 8.0% for AGIs over 200k)
Charity contributions: $3,493 (reported on 39.1% of returns)
Here:
$3,493
State:
$4,525
(% of AGI for various income ranges: 0.8% for AGIs below $25k, 1.1% for AGIs $25k-50k, 1.6% for AGIs $50k-75k, 1.8% for AGIs $75k-100k, 1.9% for AGIs $100k-200k, 1.5% for AGIs over 200k)
Taxes paid: $9,511 (reported on 46.6% of returns)
62684:
$9,511
State:
$11,968
(% of AGI for various income ranges: 3.2% for AGIs below $25k, 3.6% for AGIs $25k-50k, 4.9% for AGIs $50k-75k, 5.5% for AGIs $75k-100k, 6.5% for AGIs $100k-200k, 4.5% for AGIs over 200k)
Earned income credit: $2,133 (reported on 5.9% of returns)
Here:
$2,133
State:
$2,349
(% of AGI for various income ranges: 3.5% for AGIs below $25k, 0.6% for AGIs $25k-50k)
Percentage of individuals using paid preparers for their 2012 taxes: 52.2%
Here:
52%
State:
57%
(% for various income ranges: 47.1% for AGIs below $25k, 55.3% for AGIs $25k-50k, 51.4% for AGIs $50k-75k, 52.6% for AGIs $75k-100k, 51.6% for AGIs $100k-200k, 80.0% for AGIs over 200k)
Averages for the 2004 tax year for zip code 62684, filed in 2005:
Average Adjusted Gross Income (AGI) in 2004: $59,628 (Individual Income Tax Returns)
Here:
$59,628
State:
$54,625
Salary/wage: $50,748 (reported on 84.8% of returns)
Here:
$50,748
State:
$46,811
(% of AGI for various income ranges: 133.2% for AGIs below $10k, 63.4% for AGIs $10k-25k, 74.0% for AGIs $25k-50k, 79.6% for AGIs $50k-75k, 80.1% for AGIs $75k-100k, 62.4% for AGIs over 100k)
Taxable interest for individuals: $1,224 (reported on 61.8% of returns)
This zip code:
$1,224
Illinois:
$2,101
(% of AGI for various income ranges: 7.2% for AGIs below $10k, 4.2% for AGIs $10k-25k, 2.2% for AGIs $25k-50k, 1.0% for AGIs $50k-75k, 0.9% for AGIs $75k-100k, 0.9% for AGIs over 100k)
Taxable dividends: $1,597 (reported on 33.5% of returns)
Here:
$1,597
State:
$4,306
(% of AGI for various income ranges: 4.6% for AGIs below $10k, 2.9% for AGIs $10k-25k, 1.0% for AGIs $25k-50k, 0.5% for AGIs $50k-75k, 0.5% for AGIs $75k-100k, 1.0% for AGIs over 100k)
Net capital gain/loss: +$2,099 (reported on 22.9% of returns)
Here:
+$2,099
State:
+$17,321
(% of AGI for various income ranges: -1.6% for AGIs below $10k, -1.2% for AGIs $10k-25k, 1.1% for AGIs $25k-50k, 0.1% for AGIs $50k-75k, 0.9% for AGIs $75k-100k, 1.3% for AGIs over 100k)
Profit/loss from business: +$8,705 (reported on 15.5% of returns)
Here:
+$8,705
State:
+$11,771
(% of AGI for various income ranges: 0.5% for AGIs below $10k, 3.2% for AGIs $10k-25k, 2.8% for AGIs $25k-50k, 2.5% for AGIs $50k-75k, 2.0% for AGIs $75k-100k, 2.0% for AGIs over 100k)
Profit/loss from farming: +$2,718 (reported on 1.9% of returns)
Here:
+$2,718
State:
+$2,327
IRA payment deduction: $2,970 (reported on 3.2% of returns)
62684:
$2,970
Illinois:
$3,087
(% of AGI for various income ranges: 0.4% for AGIs $25k-50k, 0.2% for AGIs $50k-75k, 0.1% for AGIs $75k-100k, 0.1% for AGIs over 100k)
Self-employed pension: $13,692 (reported on 0.6% of returns)
Here:
$13,692
Illinois:
$16,965
Total itemized deductions: $16,475 (18% of AGI, reported on 45.7% of returns)
Here:
$16,475
State:
$20,239
Here:
18.5% of AGI
State:
19.5% of AGI
(% of AGI for various income ranges: 14.1% for AGIs $10k-25k, 14.2% for AGIs $25k-50k, 13.5% for AGIs $50k-75k, 13.0% for AGIs $75k-100k, 11.5% for AGIs over 100k)
Charity contributions deductions: $3,266 (4% of AGI, reported on 39.7% of returns)
Here:
$3,266
State:
$3,719
Here:
3.5% of AGI
State:
3.4% of AGI
(% of AGI for various income ranges: 1.2% for AGIs $10k-25k, 1.3% for AGIs $25k-50k, 1.9% for AGIs $50k-75k, 1.8% for AGIs $75k-100k, 3.0% for AGIs over 100k)
Total tax: $8,671 (reported on 83.5% of returns)
62684:
$8,671
State:
$9,882
(% of AGI for various income ranges: 2.1% for AGIs below $10k, 4.4% for AGIs $10k-25k, 7.2% for AGIs $25k-50k, 8.8% for AGIs $50k-75k, 10.3% for AGIs $75k-100k, 17.7% for AGIs over 100k)
Earned income credit: $1,510 (reported on 4.7% of returns)
Here:
$1,510
State:
$1,788
Percentage of individuals using paid preparers for their 2004 taxes: 52.6%
Here:
53%
State:
61%
(% for various income ranges: 39.3% for AGIs below $10k, 55.6% for AGIs $10k-25k, 57.1% for AGIs $25k-50k, 53.4% for AGIs $50k-75k, 52.4% for AGIs $75k-100k, 57.1% for AGIs over 100k)
Household received Food Stamps/SNAP in the past 12 months: 73 Household did not receive Food Stamps/SNAP in the past 12 months: 1,951
Women who had a birth in the past 12 months: 33 (33 now married, 0 unmarried) Women who did not have a birth in the past 12 months: 1,525 (807 now married, 711 unmarried)
Housing units in zip code 62684 with a mortgage: 1,328 (153 second mortgage, 151 both second mortgage and home equity loan) Median monthly owner costs for units with a mortgage: $1,852 Median monthly owner costs for units without a mortgage: $679
Residents with income below the poverty level in 2022:
This zip code:
0.3%
Whole state:
11.9%
Residents with income below 50% of the poverty level in 2022:
This zip code:
0.3%
Whole state:
5.7%
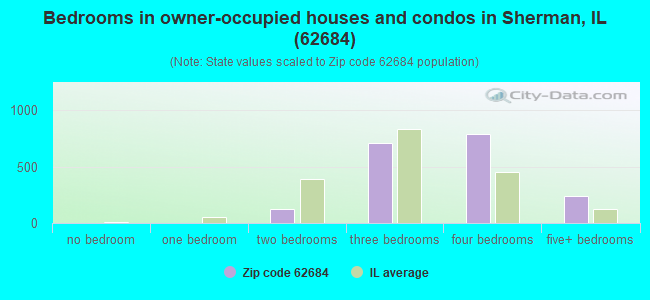
Median number of rooms in houses and condos:
Here:
7.3
State:
6.4
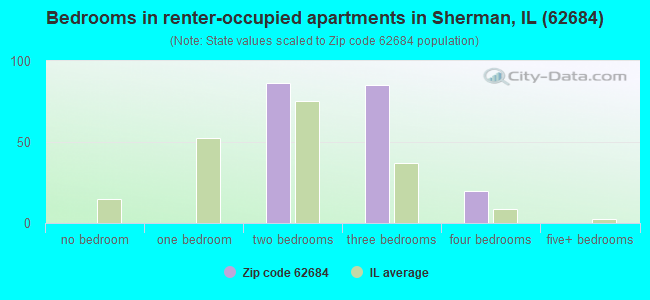
Median number of rooms in apartments:
Here:
4.8
State:
4.1
Notable locations in this zip code not listed on our city pages
In group quarters: 105 (-1 institutionalized population)
Size of family households: 591 2-persons, 383 3-persons, 452 4-persons, 146 5-persons, 34 6-persons
Size of nonfamily households: 411 1-person, 15 2-persons
1,162 married couples with children.
124 single-parent households (69 men, 55 women).
98.4% of residents of 62684 zip code speak English at home.
1.1% of residents speak Spanish at home (35% very well, 21% well, 44% not well).
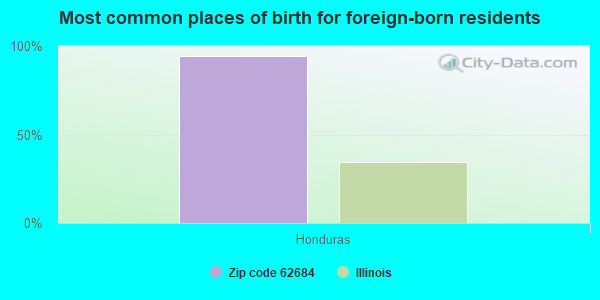
Foreign born population: 18 (0.3%) (100.0% of them are naturalized citizens)
This zip code:
0.3%
Whole state:
14.4%
94%Honduras
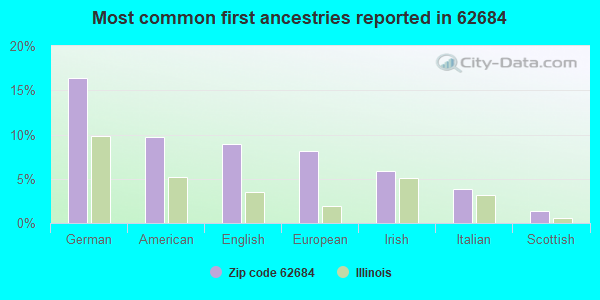
16%German
10%American
9%English
8%European
6%Irish
4%Italian
1%Scottish
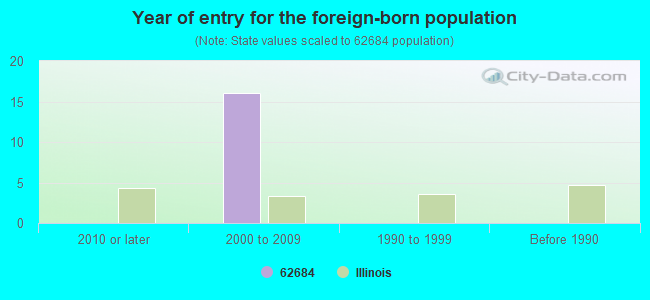
Year of entry for the foreign-born population
02010 or later
162000 to 2009
01990 to 1999
0Before 1990
Facilities with environmental interests located in this zip code:
DELONG DISPOSAL & RECYCLING CO (HWY. 124 - 2 2/10 MI. NO. in SHERMAN, IL)
STATE MASTER (Illinois EPA Project) - National Pollutant Discharge Elimination System Permit National Pollutant Discharge Elimination System NON-MAJOR (Tracking pollutant discharge elimination systems) - permit
ILDOT BRG 084 0019 AND 0018 (I55 OVER SANGAMON RIVER in SHERMAN, IL)
Small Quantity Generators, between 100 kg and 1000 kg of hazardous waste/month (Resource Conservation and Recovery Act (tracking hazardous waste)) - notification
ILDOT BRG 084 0020 (FAI 55 OVER BUS I 55 AND ICGRR in SHERMAN, IL)
Small Quantity Generators, between 100 kg and 1000 kg of hazardous waste/month (Resource Conservation and Recovery Act (tracking hazardous waste)) - notification
ILDOT BRG 084 0022 AND 0023 (I55 OVER FANCY CREEK in SHERMAN, IL)
Small Quantity Generators, between 100 kg and 1000 kg of hazardous waste/month (Resource Conservation and Recovery Act (tracking hazardous waste)) - notification
ILDOT BRIDGE 084 0021 (INTERSEC I55 AND BUS 55 in SHERMAN, IL)
Small Quantity Generators, between 100 kg and 1000 kg of hazardous waste/month (Resource Conservation and Recovery Act (tracking hazardous waste)) - notification
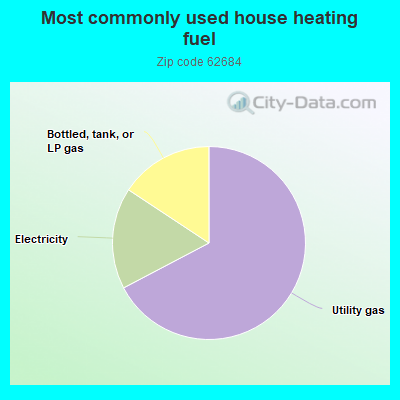
67.3%Utility gas
17.0%Electricity
15.7%Bottled, tank, or LP gas
Population in 1990: 2,185. Population change in the 1990s: +1,554 (+71.1%).
Place of birth for U.S.-born residents:
This state: 4,832
Northeast: 113
Midwest: 349
South: 150
West: 102
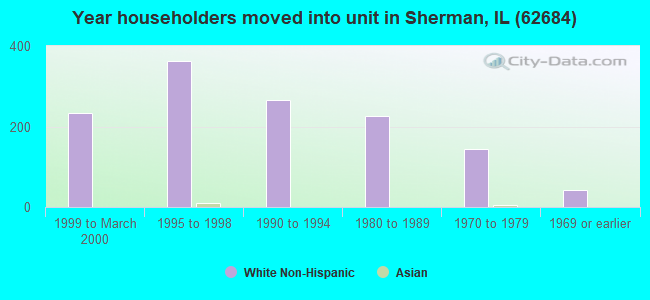
54% of the 62684 zip code residents lived in the same house 5 years ago. Out of people who lived in different houses, 74% lived in this county. Out of people who lived in different counties, 50% lived in Illinois.
92% of the 62684 zip code residents lived in the same house 1 year ago. Out of people who lived in different houses, 42% moved from this county. Out of people who lived in different houses, 59% moved from different county within same state.
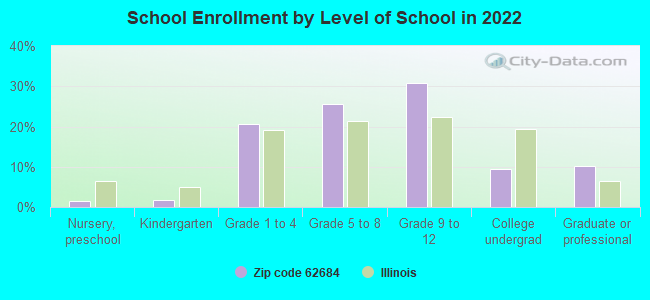
Private vs. public school enrollment:
Students in private schools in grades 1 to 8 (elementary and middle school): 28
Here:
3.9%
Illinois:
13.3%
Students in private schools in grades 9 to 12 (high school):
Here:
0.0%
Illinois:
9.9%
Students in private undergraduate colleges: 36
Here:
25.0%
Illinois:
27.4%
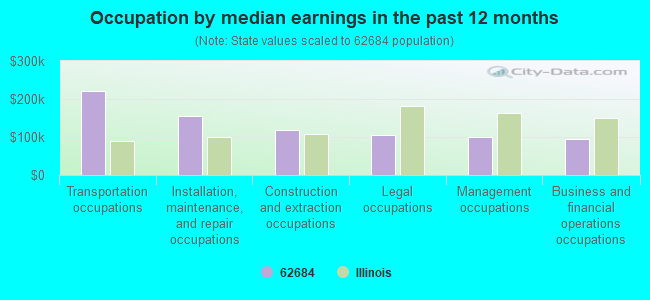
Occupation by median earnings in the past 12 months ($)
221,695Transportation occupations
154,243Installation, maintenance, and repair occupations
117,124Construction and extraction occupations
105,291Legal occupations
98,881Management occupations
93,959Business and financial operations occupations
Companies with federal contracts located in this zip code:
STONEHILL INVESTMENT (NO PHYSICAL ADDRESS in SHERMAN, IL; small business)
$37,711 with Animal and Plant Health Inspection Service for Lease or Rental of Facilities -- Office Buildings. Signed on 2003-01-15. Completion date: 2007-12-15.
Top industries in this zip code by the number of employees in 2005:
Health Care and Social Assistance: Nursing Care Facilities (100-249 employees: 1 establishment)
Accommodation and Food Services: Limited-Service Restaurants (50-99: 1, 10-19: 1)
Health Care and Social Assistance: Child Day Care Services (20-49: 1, 10-19: 1)
Other Services (except Public Administration): Religious Organizations (20-49: 1, 5-9: 1, 1-4: 2)
Accommodation and Food Services: Full-Service Restaurants (20-49: 1, 1-4: 1)
Construction: Electrical Contractors (20-49: 1)
Construction: Drywall and Insulation Contractors (20-49: 1)
Finance and Insurance: Commercial Banking (10-19: 1, 1-4: 1)
Construction: New Single-Family Housing Construction (except Operative Builders) (5-9: 1, 1-4: 5)
Construction: Masonry Contractors (10-19: 1)
People in group quarters in 2010:
192 people in nursing facilities/skilled-nursing facilities
People in group quarters in 2000:
100 people in other noninstitutional group quarters
92 people in nursing homes
3 people in homes for the mentally retarded
Fatal accident statistics in 2011:
Fatal accident count: 1
Vehicles involved in fatal accidents: 2
Fatal accidents caused by drunken drivers: 0
Fatalities: 1
Persons involved in fatal accidents: 2
Pedestrians involved in fatal accidents: 0
Fatal accident statistics in 2010:
Fatal accident count: 1
Vehicles involved in fatal accidents: 2
Fatal accidents caused by drunken drivers: 0
Fatalities: 1
Persons involved in fatal accidents: 2
Pedestrians involved in fatal accidents: 0
Home Mortgage Disclosure Act Aggregated Statistics For Year 2009 (Based on 4 partial tracts)
A) FHA, FSA/RHS & VA Home Purchase Loans
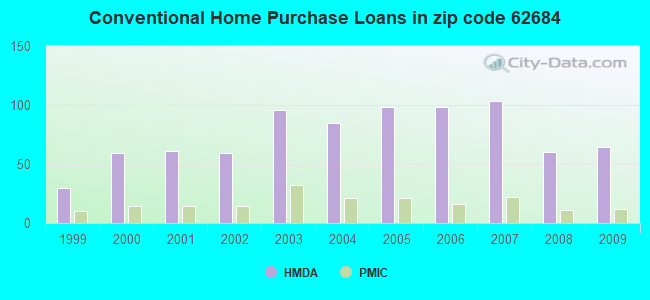
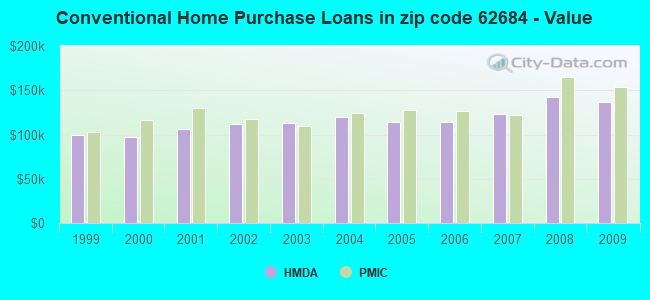
B) Conventional Home Purchase Loans
C) Refinancings
D) Home Improvement Loans
F) Non-occupant Loans on < 5 Family Dwellings (A B C & D)
G) Loans On Manufactured Home Dwelling (A B C & D)
Number
Average Value
Number
Average Value
Number
Average Value
Number
Average Value
Number
Average Value
Number
Average Value
LOANS ORIGINATED
20
$136,866
64
$137,023
368
$133,956
22
$76,114
12
$104,362
2
$58,065
APPLICATIONS APPROVED, NOT ACCEPTED
0
$0
2
$199,320
34
$159,314
3
$17,157
2
$127,700
0
$0
APPLICATIONS DENIED
5
$100,786
4
$126,158
40
$138,373
5
$63,878
3
$94,000
1
$56,760
APPLICATIONS WITHDRAWN
3
$79,423
3
$111,163
27
$160,795
2
$85,035
0
$0
0
$0
FILES CLOSED FOR INCOMPLETENESS
0
$0
0
$0
4
$144,720
0
$0
0
$0
0
$0
Aggregated Statistics For Year 2008 (Based on 4 partial tracts)
A) FHA, FSA/RHS & VA Home Purchase Loans
B) Conventional Home Purchase Loans
C) Refinancings
D) Home Improvement Loans
F) Non-occupant Loans on < 5 Family Dwellings (A B C & D)
G) Loans On Manufactured Home Dwelling (A B C & D)
Number
Average Value
Number
Average Value
Number
Average Value
Number
Average Value
Number
Average Value
Number
Average Value
LOANS ORIGINATED
14
$143,129
60
$142,768
154
$132,152
25
$41,988
13
$101,432
1
$81,070
APPLICATIONS APPROVED, NOT ACCEPTED
0
$0
4
$181,590
20
$146,421
2
$58,305
0
$0
0
$0
APPLICATIONS DENIED
2
$176,000
3
$57,427
37
$132,345
7
$78,461
2
$78,435
1
$22,110
APPLICATIONS WITHDRAWN
1
$121,470
2
$209,225
20
$127,870
0
$0
1
$184,380
0
$0
FILES CLOSED FOR INCOMPLETENESS
0
$0
2
$155,480
3
$128,337
1
$58,960
0
$0
0
$0
Aggregated Statistics For Year 2007 (Based on 4 partial tracts)
A) FHA, FSA/RHS & VA Home Purchase Loans
B) Conventional Home Purchase Loans
C) Refinancings
D) Home Improvement Loans
F) Non-occupant Loans on < 5 Family Dwellings (A B C & D)
G) Loans On Manufactured Home Dwelling (A B C & D)
Number
Average Value
Number
Average Value
Number
Average Value
Number
Average Value
Number
Average Value
Number
Average Value
LOANS ORIGINATED
5
$123,800
103
$123,021
108
$117,045
30
$34,971
12
$104,636
1
$35,870
APPLICATIONS APPROVED, NOT ACCEPTED
0
$0
6
$106,682
9
$90,797
4
$56,045
0
$0
0
$0
APPLICATIONS DENIED
1
$91,100
10
$104,117
34
$102,946
11
$49,951
1
$57,480
1
$86,860
APPLICATIONS WITHDRAWN
0
$0
4
$95,122
17
$146,958
6
$40,123
0
$0
0
$0
FILES CLOSED FOR INCOMPLETENESS
0
$0
2
$95,150
5
$141,828
0
$0
1
$76,440
0
$0
Aggregated Statistics For Year 2006 (Based on 4 partial tracts)
A) FHA, FSA/RHS & VA Home Purchase Loans
B) Conventional Home Purchase Loans
C) Refinancings
D) Home Improvement Loans
E) Loans on Dwellings For 5+ Families
F) Non-occupant Loans on < 5 Family Dwellings (A B C & D)
G) Loans On Manufactured Home Dwelling (A B C & D)
Number
Average Value
Number
Average Value
Number
Average Value
Number
Average Value
Number
Average Value
Number
Average Value
Number
Average Value
LOANS ORIGINATED
3
$112,370
98
$114,574
96
$112,561
30
$36,119
1
$155,440
12
$91,418
2
$45,090
APPLICATIONS APPROVED, NOT ACCEPTED
0
$0
6
$80,723
11
$90,367
2
$39,460
0
$0
0
$0
1
$82,340
APPLICATIONS DENIED
0
$0
7
$118,984
38
$107,841
7
$70,810
0
$0
1
$38,490
2
$52,565
APPLICATIONS WITHDRAWN
0
$0
6
$140,438
34
$137,081
1
$66,850
0
$0
1
$107,470
0
$0
FILES CLOSED FOR INCOMPLETENESS
0
$0
1
$113,120
9
$146,768
1
$39,440
0
$0
0
$0
0
$0
Aggregated Statistics For Year 2005 (Based on 4 partial tracts)
A) FHA, FSA/RHS & VA Home Purchase Loans
B) Conventional Home Purchase Loans
C) Refinancings
D) Home Improvement Loans
F) Non-occupant Loans on < 5 Family Dwellings (A B C & D)
G) Loans On Manufactured Home Dwelling (A B C & D)
Number
Average Value
Number
Average Value
Number
Average Value
Number
Average Value
Number
Average Value
Number
Average Value
LOANS ORIGINATED
5
$166,414
98
$113,955
132
$106,694
25
$40,493
14
$101,167
3
$41,547
APPLICATIONS APPROVED, NOT ACCEPTED
0
$0
9
$107,723
11
$115,051
0
$0
1
$39,030
0
$0
APPLICATIONS DENIED
0
$0
13
$133,930
41
$112,156
10
$37,975
1
$99,990
1
$20,980
APPLICATIONS WITHDRAWN
0
$0
10
$128,335
32
$123,222
1
$220,540
1
$137,050
0
$0
FILES CLOSED FOR INCOMPLETENESS
0
$0
2
$49,040
7
$141,367
1
$36,620
0
$0
0
$0
Aggregated Statistics For Year 2004 (Based on 4 partial tracts)
A) FHA, FSA/RHS & VA Home Purchase Loans
B) Conventional Home Purchase Loans
C) Refinancings
D) Home Improvement Loans
F) Non-occupant Loans on < 5 Family Dwellings (A B C & D)
G) Loans On Manufactured Home Dwelling (A B C & D)
Number
Average Value
Number
Average Value
Number
Average Value
Number
Average Value
Number
Average Value
Number
Average Value
LOANS ORIGINATED
4
$144,015
85
$119,655
153
$106,635
20
$27,715
11
$85,562
1
$47,600
APPLICATIONS APPROVED, NOT ACCEPTED
0
$0
5
$135,460
14
$123,749
2
$27,350
1
$107,390
1
$50,490
APPLICATIONS DENIED
1
$115,960
11
$94,618
47
$116,078
9
$35,950
2
$73,345
2
$36,975
APPLICATIONS WITHDRAWN
0
$0
4
$109,800
24
$133,486
1
$18,650
0
$0
0
$0
FILES CLOSED FOR INCOMPLETENESS
0
$0
1
$126,700
4
$110,088
0
$0
0
$0
0
$0
Aggregated Statistics For Year 2003 (Based on 4 partial tracts)
A) FHA, FSA/RHS & VA Home Purchase Loans
B) Conventional Home Purchase Loans
C) Refinancings
D) Home Improvement Loans
F) Non-occupant Loans on < 5 Family Dwellings (A B C & D)
Number
Average Value
Number
Average Value
Number
Average Value
Number
Average Value
Number
Average Value
LOANS ORIGINATED
10
$106,629
96
$112,727
500
$107,810
16
$23,792
19
$79,065
APPLICATIONS APPROVED, NOT ACCEPTED
1
$113,990
8
$108,041
31
$108,142
2
$28,840
0
$0
APPLICATIONS DENIED
2
$117,135
11
$91,523
55
$105,333
5
$31,952
1
$127,330
APPLICATIONS WITHDRAWN
1
$80,970
9
$112,001
29
$109,636
1
$36,190
1
$121,770
FILES CLOSED FOR INCOMPLETENESS
0
$0
2
$71,355
3
$119,147
0
$0
0
$0
Aggregated Statistics For Year 2002 (Based on 2 partial tracts)
A) FHA, FSA/RHS & VA Home Purchase Loans
B) Conventional Home Purchase Loans
C) Refinancings
D) Home Improvement Loans
F) Non-occupant Loans on < 5 Family Dwellings (A B C & D)
Number
Average Value
Number
Average Value
Number
Average Value
Number
Average Value
Number
Average Value
LOANS ORIGINATED
5
$98,206
59
$112,212
337
$113,662
14
$25,354
11
$83,675
APPLICATIONS APPROVED, NOT ACCEPTED
0
$0
5
$149,674
18
$129,303
2
$11,585
0
$0
APPLICATIONS DENIED
1
$128,180
11
$84,796
31
$103,625
6
$11,503
1
$54,720
APPLICATIONS WITHDRAWN
0
$0
8
$100,572
22
$107,541
2
$96,135
0
$0
FILES CLOSED FOR INCOMPLETENESS
0
$0
1
$129,660
3
$123,087
0
$0
0
$0
Aggregated Statistics For Year 2001 (Based on 2 partial tracts)
A) FHA, FSA/RHS & VA Home Purchase Loans
B) Conventional Home Purchase Loans
C) Refinancings
D) Home Improvement Loans
F) Non-occupant Loans on < 5 Family Dwellings (A B C & D)
Number
Average Value
Number
Average Value
Number
Average Value
Number
Average Value
Number
Average Value
LOANS ORIGINATED
4
$112,528
61
$106,771
238
$103,930
26
$34,624
9
$80,140
APPLICATIONS APPROVED, NOT ACCEPTED
0
$0
3
$121,443
14
$72,224
1
$63,100
0
$0
APPLICATIONS DENIED
0
$0
8
$68,528
23
$89,983
3
$14,460
0
$0
APPLICATIONS WITHDRAWN
0
$0
5
$133,504
14
$99,727
1
$20,710
0
$0
FILES CLOSED FOR INCOMPLETENESS
0
$0
0
$0
4
$116,470
0
$0
0
$0
Aggregated Statistics For Year 2000 (Based on 2 partial tracts)
A) FHA, FSA/RHS & VA Home Purchase Loans
B) Conventional Home Purchase Loans
C) Refinancings
D) Home Improvement Loans
F) Non-occupant Loans on < 5 Family Dwellings (A B C & D)
Number
Average Value
Number
Average Value
Number
Average Value
Number
Average Value
Number
Average Value
LOANS ORIGINATED
3
$105,010
59
$97,355
43
$91,881
23
$24,264
4
$64,338
APPLICATIONS APPROVED, NOT ACCEPTED
0
$0
5
$106,192
6
$72,388
3
$11,340
0
$0
APPLICATIONS DENIED
0
$0
5
$76,218
13
$70,082
2
$22,185
2
$21,200
APPLICATIONS WITHDRAWN
0
$0
2
$88,740
6
$92,273
2
$18,240
0
$0
FILES CLOSED FOR INCOMPLETENESS
0
$0
0
$0
1
$88,250
0
$0
0
$0
Aggregated Statistics For Year 1999 (Based on 1 partial tract)
A) FHA, FSA/RHS & VA Home Purchase Loans
B) Conventional Home Purchase Loans
C) Refinancings
D) Home Improvement Loans
F) Non-occupant Loans on < 5 Family Dwellings (A B C & D)
Detailed PMIC statistics for the following Tracts:0037.00
, 0038.02
2002 - 2018 National Fire Incident Reporting System (NFIRS) incidents
Based on the data from the years 2002 - 2018 the average number of fires per year is 31. The highest number of fire incidents - 55 took place in 2007, and the least - 16 in 2016. The data has a decreasing trend.
When looking into fire subcategories, the most incidents belonged to: Outside Fires (48.0%), and Structure Fires (33.3%).
Fire incident types reported to NFIRS in Zip Code 62684


 Nearest zip codes: 62707, 62693, 62561, 62625, 62702, 62613.
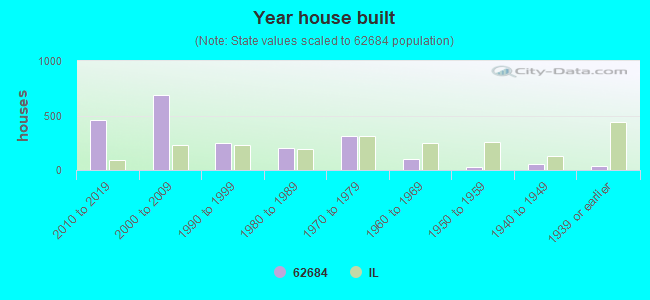


 Based on the data from the years 2002 - 2018 the average number of fires per year is 31. The highest number of fire incidents - 55 took place in 2007, and the least - 16 in 2016. The data has a decreasing trend.
 When looking into fire subcategories, the most incidents belonged to: Outside Fires (48.0%), and Structure Fires (33.3%).