Estimated zip code population in 2022: 2,322 Zip code population in 2010: 2,426 Zip code population in 2000: 2,550
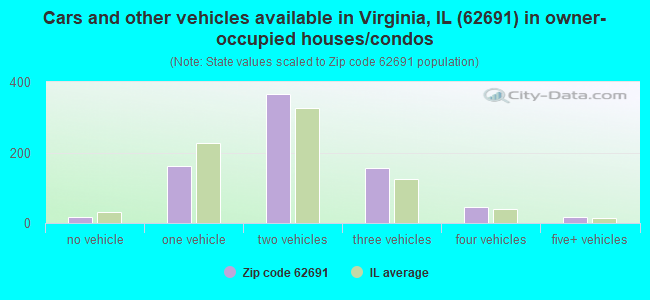
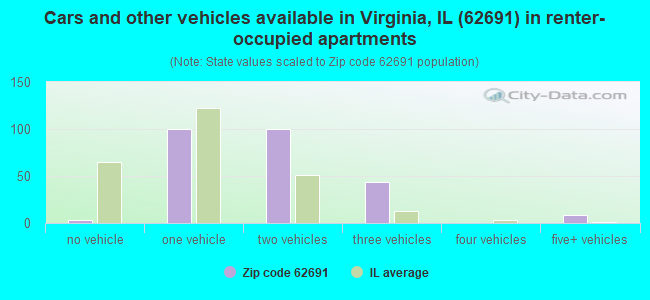
Houses and condos: 1,147 Renter-occupied apartments: 260
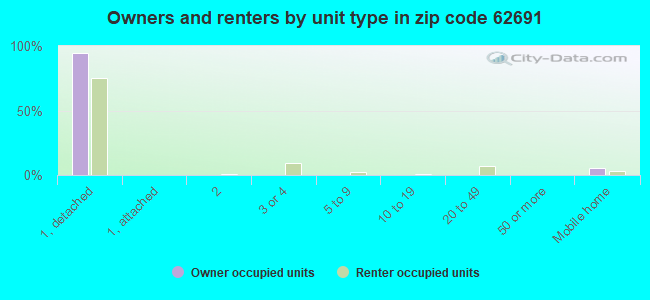
% of renters here:
25%
State:
33%
March 2022 cost of living index in zip code 62691: 83.4 (less than average, U.S. average is 100)
Land area: 108.0 sq. mi. Water area: 0.1 sq. mi.
Population density: 21 people per square mile
(very low).
OSM Map
General Map
Google Map
MSN Map
OSM Map
General Map
Google Map
MSN Map
OSM Map
General Map
Google Map
MSN Map
OSM Map
General Map
Google Map
MSN Map
Please wait while loading the map...
Real estate property taxes paid for housing units in 2022:
This zip code:
2.1% ($2,149)
Illinois:
2.0% ($4,912)
Median real estate property taxes paid for housing units with mortgages in 2022: $2,113 (2.0%) Median real estate property taxes paid for housing units with no mortgage in 2022: $2,200 (2.2%)
Business Search- 14 Million verified businesses
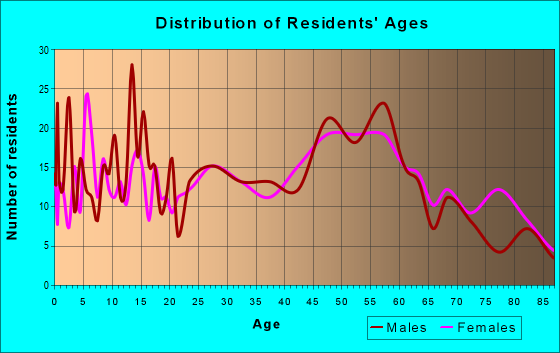
Males: 1,134
(48.9%)
Females: 1,187
(51.1%)
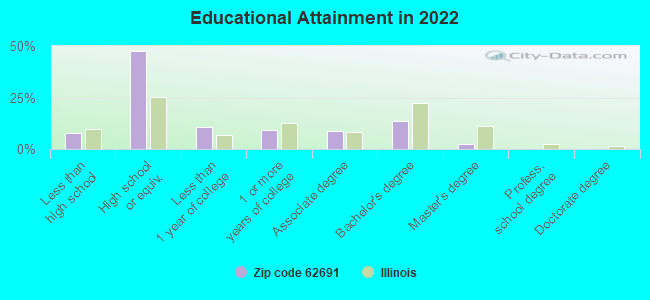
For population 25 years and over in 62691:
High school or higher: 91.2%
Bachelor's degree or higher: 16.4%
Graduate or professional degree: 2.9%
Unemployed: 2.4%
Mean travel time to work (commute): 21.6 minutes
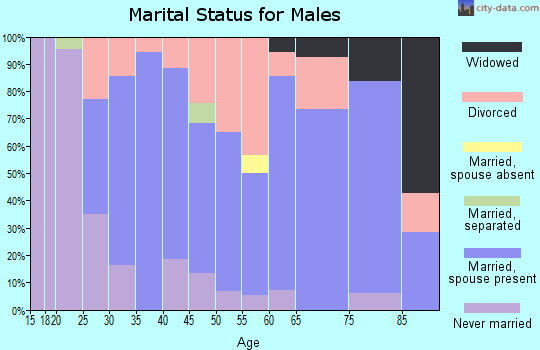
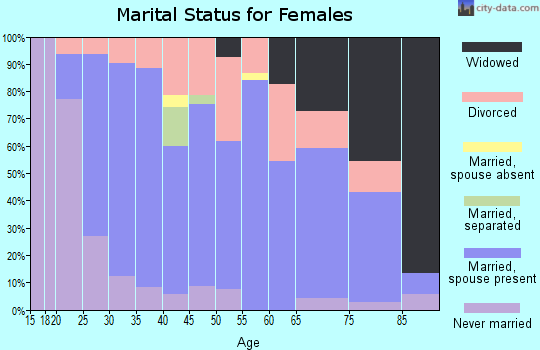
For population 15 years and over in 62691:
Never married: 28.2%
Now married: 50.4%
Separated: 2.1%
Widowed: 11.3%
Divorced: 8.0%
Zip code 62691 compared to state average:
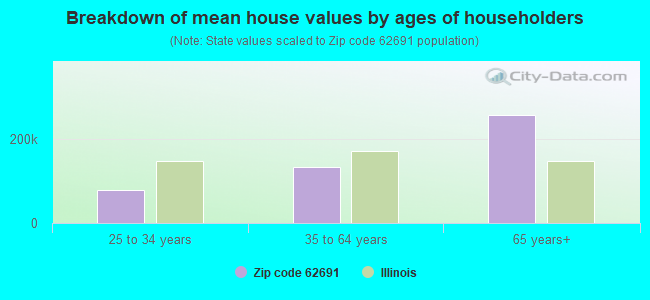
Median house value significantly below state average.
Unemployed percentage below state average.
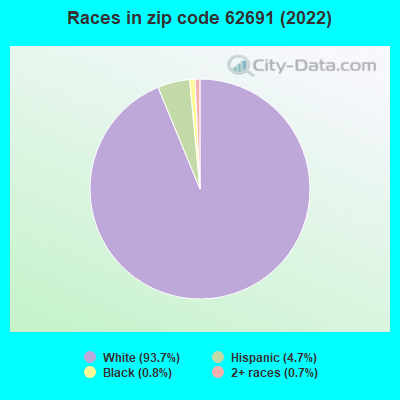
Black race population percentage significantly below state average.
Hispanic race population percentage significantly below state average.
Median age above state average.
Foreign-born population percentage significantly below state average.
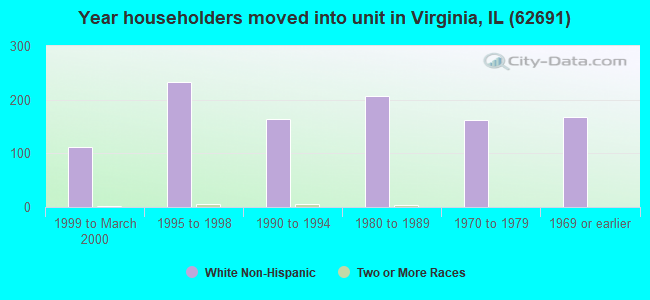
Length of stay since moving in significantly above state average.
Percentage of population with a bachelor's degree or higher below state average.
Averages for the 2020 tax year for zip code 62691, filed in 2021:
Average Adjusted Gross Income (AGI) in 2020: $66,540 (Individual Income Tax Returns)
Here:
$66,540
State:
$82,626
Salary/wage: $47,148 (reported on 81.1% of returns)
Here:
$47,148
State:
$66,640
(% of AGI for various income ranges: 1212.7% for AGIs below $25k, 3382.0% for AGIs $25k-50k, 6565.8% for AGIs $50k-75k, 7978.7% for AGIs $75k-100k, 14708.9% for AGIs $100k-200k)
Taxable interest for individuals: $1,160 (reported on 37.8% of returns)
This zip code:
$1,160
Illinois:
$2,376
(% of AGI for various income ranges: 23.6% for AGIs below $25k, 21.2% for AGIs $25k-50k, 48.3% for AGIs $50k-75k, 72.5% for AGIs $75k-100k, 205.6% for AGIs $100k-200k)
Ordinary dividends: $4,412 (reported on 15.3% of returns)
Here:
$4,412
State:
$9,061
(% of AGI for various income ranges: 34.0% for AGIs $25k-50k, 32.5% for AGIs $50k-75k, 91.2% for AGIs $75k-100k, 263.3% for AGIs $100k-200k)
Net capital gain/loss in AGI: +$33,747 (reported on 13.5% of returns)
Here:
+$33,747
State:
+$31,684
(% of AGI for various income ranges: 5.5% for AGIs below $25k, 21.6% for AGIs $25k-50k, 50.0% for AGIs $50k-75k, 391.2% for AGIs $75k-100k, 352.2% for AGIs $100k-200k)
Profit/loss from business: +$10,240 (reported on 13.5% of returns)
Here:
+$10,240
State:
+$12,175
(% of AGI for various income ranges: 86.8% for AGIs below $25k, 120.4% for AGIs $25k-50k, 420.8% for AGIs $50k-75k, 598.9% for AGIs $100k-200k)
Taxable individual retirement arrangement distribution: $10,890 (reported on 9.0% of returns)
62691:
$10,890
Illinois:
$21,613
(% of AGI for various income ranges: 105.5% for AGIs below $25k, 273.3% for AGIs $50k-75k, 587.8% for AGIs $100k-200k)
Total itemized deductions: $38,800 (reported on 2.7% of returns)
Here:
$38,800
State:
$34,948
(% of AGI for various income ranges: 970.0% for AGIs $50k-75k)
Charity contributions: $18,000 (reported on 1.8% of returns)
Here:
$18,000
State:
$13,122
(% of AGI for various income ranges: 300.0% for AGIs $50k-75k)
Taxes paid: $6,867 (reported on 2.7% of returns)
62691:
$6,867
State:
$8,563
(% of AGI for various income ranges: 171.7% for AGIs $50k-75k)
Earned income credit: $2,212 (reported on 14.4% of returns)
Here:
$2,212
State:
$2,311
(% of AGI for various income ranges: 91.8% for AGIs below $25k, 60.8% for AGIs $25k-50k)
Percentage of individuals using paid preparers for their 2020 taxes: 94.6%
Here:
95%
State:
93%
(% for various income ranges: 93.8% for AGIs below $25k, 93.5% for AGIs $25k-50k, 94.4% for AGIs $50k-75k, 100.0% for AGIs $75k-100k, 93.8% for AGIs $100k-200k, 100.0% for AGIs over 200k)
Averages for the 2012 tax year for zip code 62691, filed in 2013:
Average Adjusted Gross Income (AGI) in 2012: $52,307 (Individual Income Tax Returns)
Here:
$52,307
State:
$68,058
Salary/wage: $39,756 (reported on 81.7% of returns)
Here:
$39,756
State:
$55,396
(% of AGI for various income ranges: 74.0% for AGIs below $25k, 76.2% for AGIs $25k-50k, 74.4% for AGIs $50k-75k, 73.9% for AGIs $75k-100k, 74.7% for AGIs $100k-200k)
Taxable interest for individuals: $957 (reported on 38.3% of returns)
This zip code:
$957
Illinois:
$1,969
(% of AGI for various income ranges: 1.4% for AGIs below $25k, 0.5% for AGIs $25k-50k, 0.5% for AGIs $50k-75k, 0.6% for AGIs $75k-100k, 0.7% for AGIs $100k-200k, 0.9% for AGIs over 200k)
Ordinary dividends: $2,805 (reported on 16.5% of returns)
Here:
$2,805
State:
$7,786
(% of AGI for various income ranges: 0.4% for AGIs below $25k, 0.8% for AGIs $25k-50k, 0.2% for AGIs $50k-75k, 0.4% for AGIs $75k-100k, 0.8% for AGIs $100k-200k, 2.4% for AGIs over 200k)
Net capital gain/loss in AGI: +$11,654 (reported on 11.3% of returns)
Here:
+$11,654
State:
+$22,183
(% of AGI for various income ranges: 0.8% for AGIs below $25k, 0.1% for AGIs $25k-50k, 1.3% for AGIs $50k-75k, 9.2% for AGIs $100k-200k)
Profit/loss from business: +$5,788 (reported on 13.9% of returns)
Here:
+$5,788
State:
+$12,903
(% of AGI for various income ranges: 5.1% for AGIs below $25k, 2.2% for AGIs $25k-50k, 2.9% for AGIs $50k-75k, 0.7% for AGIs $100k-200k)
Taxable individual retirement arrangement distribution: $9,177 (reported on 11.3% of returns)
62691:
$9,177
Illinois:
$17,929
(% of AGI for various income ranges: 3.6% for AGIs below $25k, 2.8% for AGIs $25k-50k, 2.0% for AGIs $50k-75k, 3.3% for AGIs $100k-200k)
Total itemized deductions: $17,264 (17% of AGI, reported on 19.1% of returns)
Here:
$17,264
State:
$26,433
Here:
16.8% of AGI
State:
19.2% of AGI
(% of AGI for various income ranges: 8.4% for AGIs $25k-50k, 5.3% for AGIs $50k-75k, 8.3% for AGIs $75k-100k, 11.1% for AGIs $100k-200k)
Charity contributions: $3,971 (reported on 12.2% of returns)
Here:
$3,971
State:
$4,525
(% of AGI for various income ranges: 0.9% for AGIs $25k-50k, 0.3% for AGIs $50k-75k, 0.8% for AGIs $75k-100k, 2.4% for AGIs $100k-200k)
Taxes paid: $6,161 (reported on 20.0% of returns)
62691:
$6,161
State:
$11,968
(% of AGI for various income ranges: 1.8% for AGIs $25k-50k, 1.6% for AGIs $50k-75k, 3.1% for AGIs $75k-100k, 5.5% for AGIs $100k-200k)
Earned income credit: $2,206 (reported on 15.7% of returns)
Here:
$2,206
State:
$2,349
(% of AGI for various income ranges: 5.3% for AGIs below $25k, 1.1% for AGIs $25k-50k)
Percentage of individuals using paid preparers for their 2012 taxes: 66.1%
Here:
66%
State:
57%
(% for various income ranges: 56.1% for AGIs below $25k, 65.6% for AGIs $25k-50k, 77.8% for AGIs $50k-75k, 70.0% for AGIs $75k-100k, 72.7% for AGIs $100k-200k, 100.0% for AGIs over 200k)
Averages for the 2004 tax year for zip code 62691, filed in 2005:
Average Adjusted Gross Income (AGI) in 2004: $39,960 (Individual Income Tax Returns)
Here:
$39,960
State:
$54,625
Salary/wage: $32,145 (reported on 81.8% of returns)
Here:
$32,145
State:
$46,811
(% of AGI for various income ranges: 95.0% for AGIs below $10k, 70.8% for AGIs $10k-25k, 77.8% for AGIs $25k-50k, 77.6% for AGIs $50k-75k, 69.2% for AGIs $75k-100k, 36.3% for AGIs over 100k)
Taxable interest for individuals: $1,679 (reported on 50.2% of returns)
This zip code:
$1,679
Illinois:
$2,101
(% of AGI for various income ranges: 10.3% for AGIs below $10k, 3.6% for AGIs $10k-25k, 2.3% for AGIs $25k-50k, 1.4% for AGIs $50k-75k, 1.5% for AGIs $75k-100k, 1.7% for AGIs over 100k)
Taxable dividends: $6,004 (reported on 22.6% of returns)
Here:
$6,004
State:
$4,306
(% of AGI for various income ranges: 4.0% for AGIs below $10k, 1.6% for AGIs $10k-25k, 0.9% for AGIs $25k-50k, 2.0% for AGIs $50k-75k, 2.0% for AGIs $75k-100k, 8.8% for AGIs over 100k)
Net capital gain/loss: +$6,722 (reported on 16.9% of returns)
Here:
+$6,722
State:
+$17,321
(% of AGI for various income ranges: 0.1% for AGIs below $10k, 1.2% for AGIs $10k-25k, 0.9% for AGIs $25k-50k, 1.6% for AGIs $50k-75k, 0.1% for AGIs $75k-100k, 8.6% for AGIs over 100k)
Profit/loss from business: +$4,994 (reported on 14.2% of returns)
Here:
+$4,994
State:
+$11,771
(% of AGI for various income ranges: -3.4% for AGIs below $10k, 2.8% for AGIs $10k-25k, 2.2% for AGIs $25k-50k, 2.5% for AGIs $50k-75k, 3.0% for AGIs $75k-100k, -0.1% for AGIs over 100k)
Profit/loss from farming: +$14,915 (reported on 9.7% of returns)
Here:
+$14,915
State:
+$2,327
(% of AGI for various income ranges: -0.2% for AGIs below $10k, 2.2% for AGIs $10k-25k, 2.3% for AGIs $25k-50k, 1.1% for AGIs $50k-75k, 5.1% for AGIs $75k-100k, 7.3% for AGIs over 100k)
IRA payment deduction: $2,651 (reported on 3.5% of returns)
62691:
$2,651
Illinois:
$3,087
Total itemized deductions: $15,662 (19% of AGI, reported on 16.0% of returns)
Here:
$15,662
State:
$20,239
Here:
19.2% of AGI
State:
19.5% of AGI
(% of AGI for various income ranges: 24.7% for AGIs below $10k, 7.1% for AGIs $10k-25k, 5.4% for AGIs $25k-50k, 6.1% for AGIs $50k-75k, 6.6% for AGIs $75k-100k, 5.6% for AGIs over 100k)
Charity contributions deductions: $2,886 (3% of AGI, reported on 10.9% of returns)
Here:
$2,886
State:
$3,719
Here:
3.1% of AGI
State:
3.4% of AGI
(% of AGI for various income ranges: 0.7% for AGIs $10k-25k, 0.7% for AGIs $25k-50k, 0.5% for AGIs $50k-75k, 0.6% for AGIs $75k-100k, 1.3% for AGIs over 100k)
Total tax: $6,024 (reported on 74.7% of returns)
62691:
$6,024
State:
$9,882
(% of AGI for various income ranges: 2.6% for AGIs below $10k, 4.9% for AGIs $10k-25k, 6.9% for AGIs $25k-50k, 8.6% for AGIs $50k-75k, 12.2% for AGIs $75k-100k, 21.0% for AGIs over 100k)
Earned income credit: $1,478 (reported on 13.3% of returns)
Here:
$1,478
State:
$1,788
Percentage of individuals using paid preparers for their 2004 taxes: 71.7%
Here:
72%
State:
61%
(% for various income ranges: 59.9% for AGIs below $10k, 71.0% for AGIs $10k-25k, 74.9% for AGIs $25k-50k, 77.3% for AGIs $50k-75k, 77.6% for AGIs $75k-100k, 82.8% for AGIs over 100k)
Household received Food Stamps/SNAP in the past 12 months: 118 Household did not receive Food Stamps/SNAP in the past 12 months: 905
Women who had a birth in the past 12 months: 13 (2 now married, 10 unmarried) Women who did not have a birth in the past 12 months: 443 (181 now married, 261 unmarried)
Housing units in zip code 62691 with a mortgage: 336 (15 second mortgage, 10 both second mortgage and home equity loan) Houses without a mortgage: 3
Median monthly owner costs for units with a mortgage: $1,087 Median monthly owner costs for units without a mortgage: $616
Residents with income below the poverty level in 2022:
This zip code:
12.6%
Whole state:
11.9%
Residents with income below 50% of the poverty level in 2022:
This zip code:
2.9%
Whole state:
5.7%
Median number of rooms in houses and condos:
Here:
6.9
State:
6.4
Median number of rooms in apartments:
Here:
4.8
State:
4.1
Notable locations in this zip code not listed on our city pages
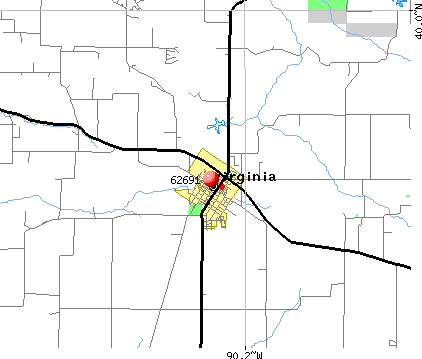
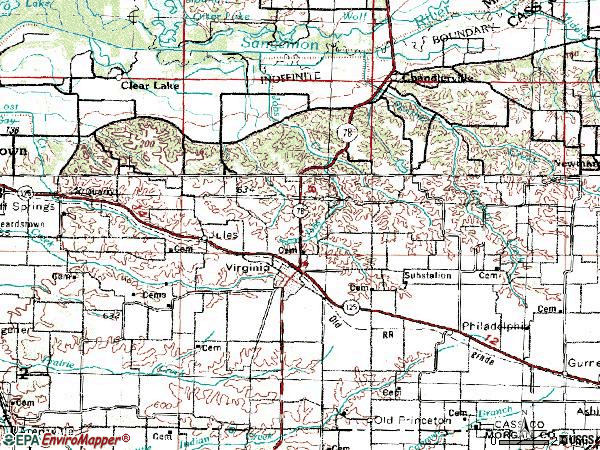
Notable locations in zip code 62691: Virginia Country Club (A), Cass County Courthouse (B), Mecca Paramedics (C), Virginia Volunteer Fire Department (D). Display/hide their locations on the map
Churches in zip code 62691 include: Sangamon Valley Church (A), Assembly of God Church (B), First Baptist Church (C), First Presbyterian Church (D), Grace Lutheran Church (E), Saint Lukes Catholic Church (F), Virginia United Methodist Church (G). Display/hide their locations on the map
Cemeteries: Beard Cemetery (1), Berry Cemetery (2), Bethlehem Cemetery (3), Black Cemetery (4), Buck Cemetery (5), Cauby Cemetery (6), Clark Cemetery (7). Display/hide their locations on the map
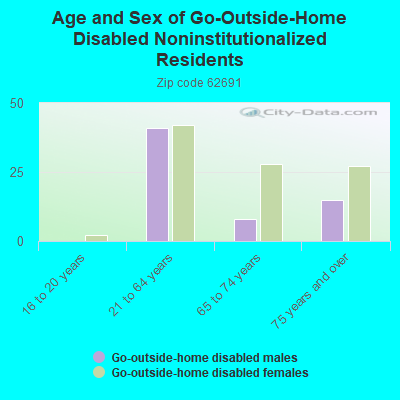
In group quarters: 40 (-1 institutionalized population)
Size of family households: 352 2-persons, 150 3-persons, 74 4-persons, 46 5-persons, 13 6-persons
Size of nonfamily households: 331 1-person, 61 2-persons
321 married couples with children.
120 single-parent households (78 men, 42 women).
98.7% of residents of 62691 zip code speak English at home.
0.4% of residents speak Spanish at home (56% not well, 44% not at all).
0.7% of residents speak other Indo-European language at home (56% very well, 44% well).
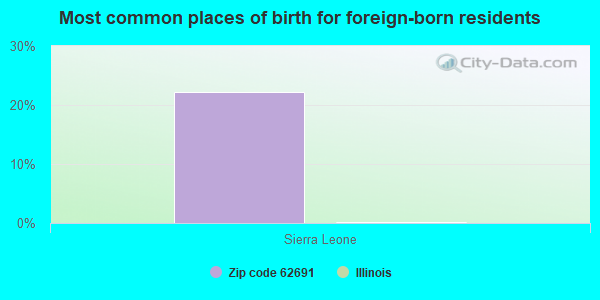
Foreign born population: 18 (0.8%) (39.1% of them are naturalized citizens)
This zip code:
0.8%
Whole state:
14.4%
22%Sierra Leone
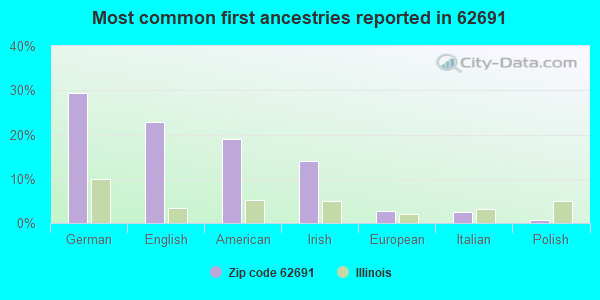
29%German
23%English
19%American
14%Irish
3%European
2%Italian
1%Polish
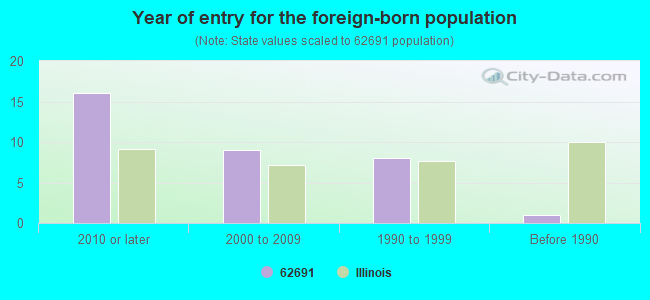
Year of entry for the foreign-born population
162010 or later
92000 to 2009
81990 to 1999
1Before 1990
Facilities with environmental interests located in this zip code:
MOLO OIL (IL ROUTE 78 NORTH in VIRGINIA, IL)
STATE MASTER (Illinois EPA Project) - AIR PROGRAM AIR MINOR (AIRS/AFS) CRITERIA AND HAZARDOUS AIR POLLUTANT INVENTORY (Inventory of air pollution sources) Business SIC classification: PETROLEUM BULK STATIONS AND TERMINALS
ILL BELL TEL CO VIRGINIA CDO INDPNT CO (FRONT ST in VIRGINIA, IL)
(Resource Conservation and Recovery Act (tracking hazardous waste))
PRECISION TANK INC (RR 1 in VIRGINIA, IL)
Conditionally Exempt Small Quantity Generators, less than 100 kg/month of hazardous waste (Resource Conservation and Recovery Act (tracking hazardous waste))
ILDOT DIST 6 (RTE 125 W in VIRGINIA, IL)
Small Quantity Generators, between 100 kg and 1000 kg of hazardous waste/month (Resource Conservation and Recovery Act (tracking hazardous waste)) - notification
REYNOLD AND SONS (101 N MAIN in VIRGINIA, IL)
Conditionally Exempt Small Quantity Generators, less than 100 kg/month of hazardous waste (Resource Conservation and Recovery Act (tracking hazardous waste)) Organizations: REYNOLD LEE (CONTACT/OWNER)
Housing units lacking complete plumbing facilities: 2.5% Housing units lacking complete kitchen facilities: 4.1%
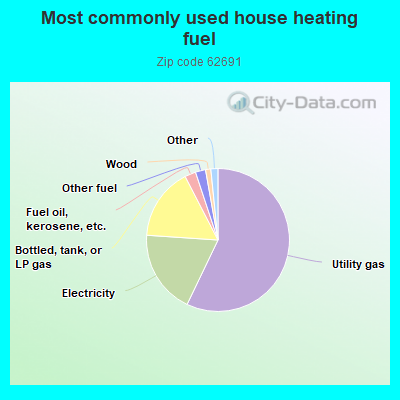
57.3%Utility gas
19.0%Electricity
16.4%Bottled, tank, or LP gas
2.5%Fuel oil, kerosene, etc.
2.3%Other fuel
1.2%Wood
1.0%No fuel used
0.6%Coal or coke
Population in 1990: 2,144. Population change in the 1990s: +406 (+18.9%).
Place of birth for U.S.-born residents:
This state: 2,051
Northeast: 23
Midwest: 106
South: 52
West: 43
66% of the 62691 zip code residents lived in the same house 5 years ago. Out of people who lived in different houses, 58% lived in this county. Out of people who lived in different counties, 50% lived in Illinois.
92% of the 62691 zip code residents lived in the same house 1 year ago. Out of people who lived in different houses, 76% moved from this county. Out of people who lived in different houses, 16% moved from different county within same state. Out of people who lived in different houses, 3% moved from different state.
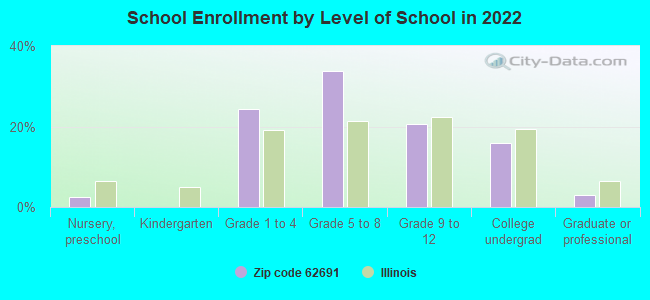
Private vs. public school enrollment:
Students in private schools in grades 1 to 8 (elementary and middle school): 20
Here:
7.2%
Illinois:
13.3%
Students in private schools in grades 9 to 12 (high school): 2
Here:
2.7%
Illinois:
9.9%
Students in private undergraduate colleges: 4
Here:
5.8%
Illinois:
27.4%
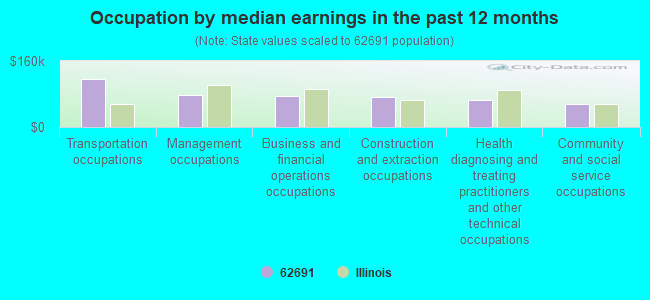
Occupation by median earnings in the past 12 months ($)
116,019Transportation occupations
77,028Management occupations
75,038Business and financial operations occupations
73,540Construction and extraction occupations
65,755Health diagnosing and treating practitioners and other technical occupations
56,029Community and social service occupations
Companies with federal contracts located in this zip code:
CASS COUNTY ABSTRACT CO (138 E BEARDSTOWN ST in VIRGINIA, IL; small business) : $832 in 3 contractsfrom 2002 to 2006
$2,620 with U.S. Army Corps of Engineers - civil program financing only for Land Surveys, Cadastral Services (non-construction). Signed on 2002-07-11. Completion date: 2002-07-12.
-$788 with Army for Land Surveys, Cadastral Services (non-construction). Signed on 2006-03-27. Completion date: 2002-07-12.
-$1,000, same as above.Signed on 2006-03-27. Completion date: 2002-07-12.
Top industries in this zip code by the number of employees in 2005:
Wholesale Trade: Grain and Field Bean Merchant Wholesalers (100-249 employees: 1 establishment)
Administrative and Support and Waste Management and Remediation Services: Office Administrative Services (50-99: 1)
Health Care and Social Assistance: Continuing Care Retirement Communities (50-99: 1)
Other Services (except Public Administration): Religious Organizations (5-9: 1, 1-4: 5)
Administrative and Support and Waste Management and Remediation Services: Janitorial Services (10-19: 1)
Health Care and Social Assistance: Residential Mental Health and Substance Abuse Facilities (10-19: 1)
Wholesale Trade: Petroleum Bulk Stations and Terminals (10-19: 1)
People in group quarters in 2010:
42 people in nursing facilities/skilled-nursing facilities
7 people in workers' group living quarters and job corps centers
People in group quarters in 2000:
58 people in nursing homes
Fatal accident statistics in 2013:
Fatal accident count: 1
Vehicles involved in fatal accidents: 2
Fatal accidents caused by drunken drivers: 0
Fatalities: 1
Persons involved in fatal accidents: 2
Pedestrians involved in fatal accidents: 0
Fatal accident statistics in 2012:
Fatal accident count: 2
Vehicles involved in fatal accidents: 4
Fatal accidents caused by drunken drivers: 1
Fatalities: 2
Persons involved in fatal accidents: 5
Pedestrians involved in fatal accidents: 0
2002 - 2018 National Fire Incident Reporting System (NFIRS) incidents
Based on the data from the years 2002 - 2018 the average number of fires per year is 9. The highest number of fire incidents - 23 took place in 2007, and the least - 0 in 2003. The data has an increasing trend.
When looking into fire subcategories, the most incidents belonged to: Structure Fires (39.9%), and Outside Fires (38.6%).
Fire incident types reported to NFIRS in Zip Code 62691
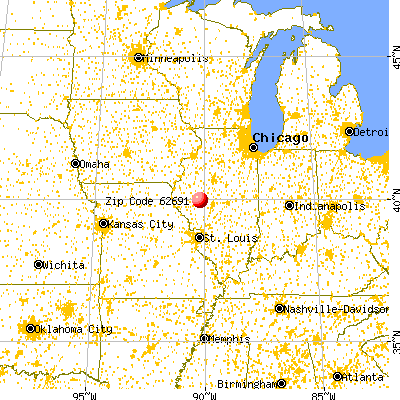


 Nearest zip codes: 62627, 62622, 62612, 62618, 62631, 62611.


 Based on the data from the years 2002 - 2018 the average number of fires per year is 9. The highest number of fire incidents - 23 took place in 2007, and the least - 0 in 2003. The data has an increasing trend.
 When looking into fire subcategories, the most incidents belonged to: Structure Fires (39.9%), and Outside Fires (38.6%).