Estimated zip code population in 2022: 1,757 Zip code population in 2010: 2,124 Zip code population in 2000: 2,134
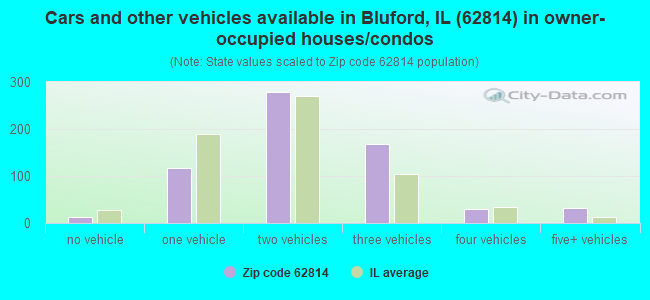
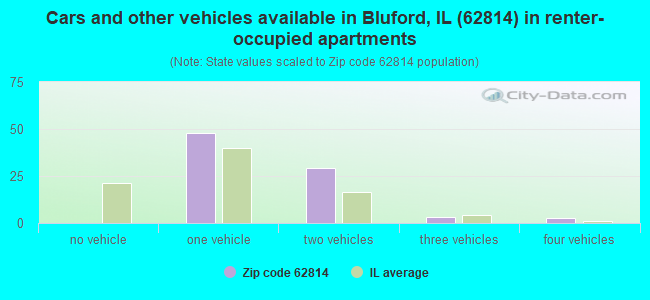
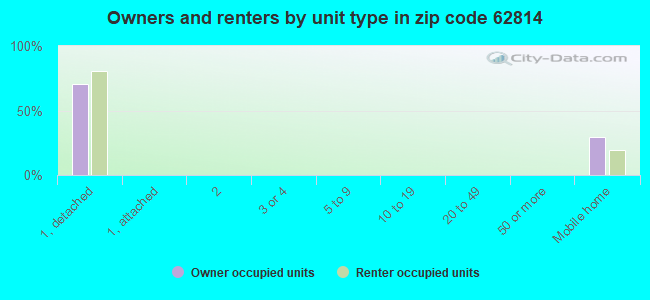
Houses and condos: 793 Renter-occupied apartments: 84
% of renters here:
12%
State:
33%
March 2022 cost of living index in zip code 62814: 82.0 (low, U.S. average is 100)
Land area: 70.8 sq. mi. Water area: 0.3 sq. mi.
Population density: 25 people per square mile
(very low).
OSM Map
General Map
Google Map
MSN Map
OSM Map
General Map
Google Map
MSN Map
OSM Map
General Map
Google Map
MSN Map
OSM Map
General Map
Google Map
MSN Map
Please wait while loading the map...
Real estate property taxes paid for housing units in 2022:
This zip code:
1.5% ($1,731)
Illinois:
2.0% ($4,912)
Median real estate property taxes paid for housing units with mortgages in 2022: $2,177 (1.7%) Median real estate property taxes paid for housing units with no mortgage in 2022: $795 (0.9%)
Business Search- 14 Million verified businesses
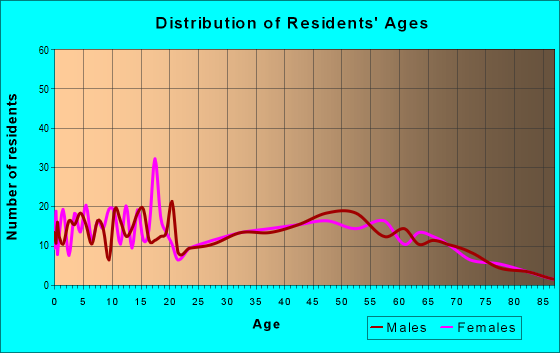
Males: 841
(47.9%)
Females: 915
(52.1%)
For population 25 years and over in 62814:
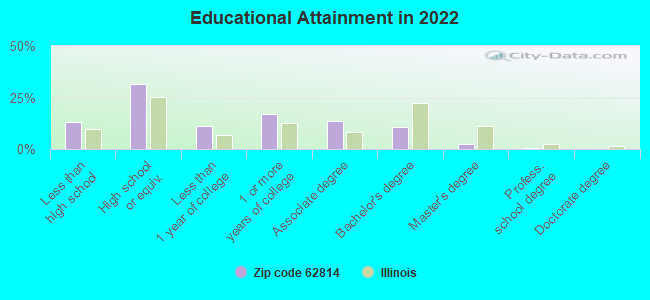
High school or higher: 84.9%
Bachelor's degree or higher: 13.6%
Graduate or professional degree: 3.0%
Unemployed: 4.7%
Mean travel time to work (commute): 27.3 minutes
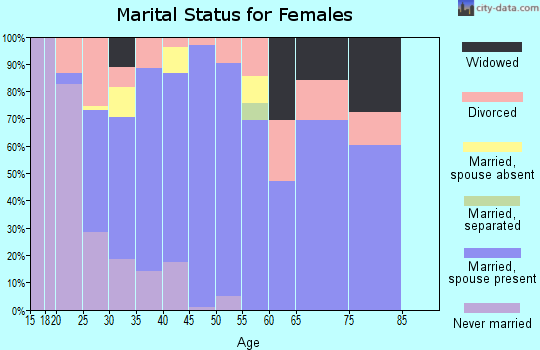
For population 15 years and over in 62814:
Never married: 20.9%
Now married: 61.3%
Separated: 0.1%
Widowed: 4.9%
Divorced: 12.8%
Zip code 62814 compared to state average:
Median house value below state average.
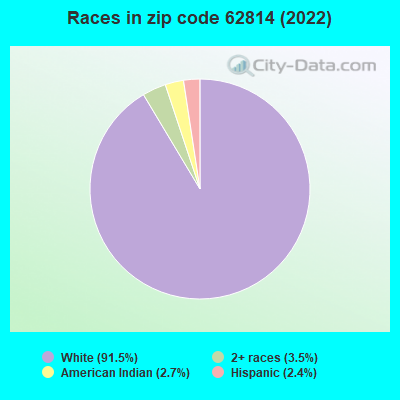
Black race population percentage significantly below state average.
Hispanic race population percentage significantly below state average.
Foreign-born population percentage significantly below state average.
Renting percentage significantly below state average.
Length of stay since moving in above state average.
House age below state average.
Percentage of population with a bachelor's degree or higher significantly below state average.
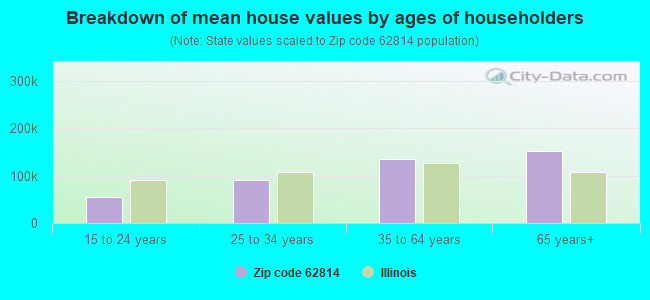
Estimated median house/condo value in 2022: $115,540
62814:
$115,540
Illinois:
$251,600
According to our research of Illinois and other state lists, there were 3 registered sex offenders living in 62814 zip code as of April 27, 2024. The ratio of all residents to sex offenders in zip code 62814 is 688 to 1. The ratio of registered sex offenders to all residents in this zip code is near the state average.
Median resident age:
This zip code:
39.4 years
Illinois median age:
39.1 years
Average household size:
This zip code:
2.4 people
Illinois:
2.4 people
Averages for the 2020 tax year for zip code 62814, filed in 2021:
Average Adjusted Gross Income (AGI) in 2020: $53,450 (Individual Income Tax Returns)
Here:
$53,450
State:
$82,626
Salary/wage: $47,585 (reported on 77.3% of returns)
Here:
$47,585
State:
$66,640
(% of AGI for various income ranges: 1218.2% for AGIs below $25k, 3487.5% for AGIs $25k-50k, 5770.0% for AGIs $50k-75k, 9538.3% for AGIs $75k-100k, 17775.0% for AGIs $100k-200k)
Taxable interest for individuals: $742 (reported on 29.5% of returns)
This zip code:
$742
Illinois:
$2,376
(% of AGI for various income ranges: 30.6% for AGIs below $25k, 9.5% for AGIs $25k-50k, 10.0% for AGIs $50k-75k, 41.7% for AGIs $75k-100k, 141.7% for AGIs $100k-200k)
Ordinary dividends: $2,000 (reported on 12.5% of returns)
Here:
$2,000
State:
$9,061
(% of AGI for various income ranges: 18.0% for AGIs $25k-50k, 113.3% for AGIs $50k-75k, 80.0% for AGIs $100k-200k)
Net capital gain/loss in AGI: +$5,522 (reported on 10.2% of returns)
Here:
+$5,522
State:
+$31,684
(% of AGI for various income ranges: 34.5% for AGIs $25k-50k, 75.8% for AGIs $50k-75k, 561.7% for AGIs $100k-200k)
Profit/loss from business: +$10,643 (reported on 15.9% of returns)
Here:
+$10,643
State:
+$12,175
(% of AGI for various income ranges: 165.3% for AGIs below $25k, 105.5% for AGIs $25k-50k, 277.5% for AGIs $50k-75k, 1108.3% for AGIs $100k-200k)
Taxable individual retirement arrangement distribution: $10,343 (reported on 8.0% of returns)
62814:
$10,343
Illinois:
$21,613
(% of AGI for various income ranges: 233.5% for AGIs $25k-50k, 428.3% for AGIs $75k-100k)
Total itemized deductions: $29,750 (reported on 2.3% of returns)
Here:
$29,750
State:
$34,948
(% of AGI for various income ranges: 495.8% for AGIs $50k-75k)
Taxes paid: $6,450 (reported on 2.3% of returns)
62814:
$6,450
State:
$8,563
(% of AGI for various income ranges: 107.5% for AGIs $50k-75k)
Earned income credit: $2,338 (reported on 18.2% of returns)
Here:
$2,338
State:
$2,311
(% of AGI for various income ranges: 130.6% for AGIs below $25k, 76.0% for AGIs $25k-50k)
Percentage of individuals using paid preparers for their 2020 taxes: 96.6%
Here:
97%
State:
93%
(% for various income ranges: 96.2% for AGIs below $25k, 96.0% for AGIs $25k-50k, 93.8% for AGIs $50k-75k, 100.0% for AGIs $75k-100k, 100.0% for AGIs $100k-200k)
Averages for the 2012 tax year for zip code 62814, filed in 2013:
Average Adjusted Gross Income (AGI) in 2012: $42,966 (Individual Income Tax Returns)
Here:
$42,966
State:
$68,058
Salary/wage: $38,208 (reported on 81.1% of returns)
Here:
$38,208
State:
$55,396
(% of AGI for various income ranges: 70.6% for AGIs below $25k, 72.5% for AGIs $25k-50k, 72.3% for AGIs $50k-75k, 79.5% for AGIs $75k-100k, 65.7% for AGIs $100k-200k)
Taxable interest for individuals: $946 (reported on 31.1% of returns)
This zip code:
$946
Illinois:
$1,969
(% of AGI for various income ranges: 1.0% for AGIs below $25k, 0.8% for AGIs $25k-50k, 1.1% for AGIs $50k-75k, 0.6% for AGIs $75k-100k)
Ordinary dividends: $1,236 (reported on 12.2% of returns)
Here:
$1,236
State:
$7,786
(% of AGI for various income ranges: 0.3% for AGIs $25k-50k, 0.5% for AGIs $50k-75k, 0.8% for AGIs $75k-100k)
Net capital gain/loss in AGI: +$2,733 (reported on 10.0% of returns)
Here:
+$2,733
State:
+$22,183
(% of AGI for various income ranges: 0.3% for AGIs $25k-50k, 0.8% for AGIs $50k-75k, 1.7% for AGIs $100k-200k)
Profit/loss from business: +$7,015 (reported on 14.4% of returns)
Here:
+$7,015
State:
+$12,903
(% of AGI for various income ranges: 6.0% for AGIs below $25k, 5.0% for AGIs $25k-50k, 3.1% for AGIs $50k-75k)
Taxable individual retirement arrangement distribution: $9,757 (reported on 7.8% of returns)
62814:
$9,757
Illinois:
$17,929
Total itemized deductions: $18,192 (21% of AGI, reported on 14.4% of returns)
Here:
$18,192
State:
$26,433
Here:
21.4% of AGI
State:
19.2% of AGI
(% of AGI for various income ranges: 6.1% for AGIs $25k-50k, 4.3% for AGIs $50k-75k, 9.1% for AGIs $75k-100k, 8.5% for AGIs $100k-200k)
Charity contributions: $4,767 (reported on 10.0% of returns)
Here:
$4,767
State:
$4,525
(% of AGI for various income ranges: 1.3% for AGIs $25k-50k, 2.3% for AGIs $75k-100k, 1.6% for AGIs $100k-200k)
Taxes paid: $5,708 (reported on 14.4% of returns)
62814:
$5,708
State:
$11,968
(% of AGI for various income ranges: 1.1% for AGIs $25k-50k, 1.2% for AGIs $50k-75k, 2.8% for AGIs $75k-100k, 3.9% for AGIs $100k-200k)
Earned income credit: $2,253 (reported on 18.9% of returns)
Here:
$2,253
State:
$2,349
(% of AGI for various income ranges: 6.4% for AGIs below $25k, 1.3% for AGIs $25k-50k)
Percentage of individuals using paid preparers for their 2012 taxes: 63.3%
Here:
63%
State:
57%
(% for various income ranges: 54.3% for AGIs below $25k, 64.0% for AGIs $25k-50k, 73.3% for AGIs $50k-75k, 66.7% for AGIs $75k-100k, 83.3% for AGIs $100k-200k)
Averages for the 2004 tax year for zip code 62814, filed in 2005:
Average Adjusted Gross Income (AGI) in 2004: $34,661 (Individual Income Tax Returns)
Here:
$34,661
State:
$54,625
Salary/wage: $33,084 (reported on 83.8% of returns)
Here:
$33,084
State:
$46,811
(% of AGI for various income ranges: 90.5% for AGIs below $10k, 67.5% for AGIs $10k-25k, 80.9% for AGIs $25k-50k, 85.3% for AGIs $50k-75k, 81.8% for AGIs $75k-100k, 70.1% for AGIs over 100k)
Taxable interest for individuals: $1,203 (reported on 39.8% of returns)
This zip code:
$1,203
Illinois:
$2,101
(% of AGI for various income ranges: 4.6% for AGIs below $10k, 2.2% for AGIs $10k-25k, 2.4% for AGIs $25k-50k, 0.5% for AGIs $50k-75k, 0.7% for AGIs $75k-100k, 0.4% for AGIs over 100k)
Taxable dividends: $657 (reported on 15.0% of returns)
Here:
$657
State:
$4,306
(% of AGI for various income ranges: 0.3% for AGIs below $10k, 0.4% for AGIs $10k-25k, 0.3% for AGIs $25k-50k, 0.1% for AGIs $50k-75k, 0.1% for AGIs $75k-100k, 1.0% for AGIs over 100k)
Net capital gain/loss: +$2,198 (reported on 13.2% of returns)
Here:
+$2,198
State:
+$17,321
(% of AGI for various income ranges: -0.3% for AGIs below $10k, 1.1% for AGIs $10k-25k, 0.3% for AGIs $25k-50k, 0.3% for AGIs $50k-75k, 1.2% for AGIs $75k-100k, 3.4% for AGIs over 100k)
Profit/loss from business: +$5,794 (reported on 17.0% of returns)
Here:
+$5,794
State:
+$11,771
(% of AGI for various income ranges: 7.9% for AGIs below $10k, 7.2% for AGIs $10k-25k, 2.9% for AGIs $25k-50k, 0.4% for AGIs $50k-75k, 5.1% for AGIs $75k-100k)
IRA payment deduction: $2,727 (reported on 2.4% of returns)
62814:
$2,727
Illinois:
$3,087
Total itemized deductions: $14,028 (20% of AGI, reported on 15.6% of returns)
Here:
$14,028
State:
$20,239
Here:
20.4% of AGI
State:
19.5% of AGI
(% of AGI for various income ranges: 5.4% for AGIs $10k-25k, 4.7% for AGIs $25k-50k, 5.5% for AGIs $50k-75k, 10.9% for AGIs $75k-100k, 8.9% for AGIs over 100k)
Charity contributions deductions: $3,197 (4% of AGI, reported on 12.8% of returns)
Here:
$3,197
State:
$3,719
Here:
4.4% of AGI
State:
3.4% of AGI
(% of AGI for various income ranges: 1.1% for AGIs $10k-25k, 0.4% for AGIs $25k-50k, 1.3% for AGIs $50k-75k, 2.1% for AGIs $75k-100k, 1.9% for AGIs over 100k)
Total tax: $3,899 (reported on 72.4% of returns)
62814:
$3,899
State:
$9,882
(% of AGI for various income ranges: 2.6% for AGIs below $10k, 3.9% for AGIs $10k-25k, 5.7% for AGIs $25k-50k, 8.4% for AGIs $50k-75k, 10.3% for AGIs $75k-100k, 17.0% for AGIs over 100k)
Earned income credit: $1,736 (reported on 17.4% of returns)
Here:
$1,736
State:
$1,788
Percentage of individuals using paid preparers for their 2004 taxes: 69.0%
Here:
69%
State:
61%
(% for various income ranges: 63.1% for AGIs below $10k, 70.7% for AGIs $10k-25k, 67.5% for AGIs $25k-50k, 69.9% for AGIs $50k-75k, 83.6% for AGIs $75k-100k, 78.3% for AGIs over 100k)
Household received Food Stamps/SNAP in the past 12 months: 163 Household did not receive Food Stamps/SNAP in the past 12 months: 568
Women who had a birth in the past 12 months: 8 (2 now married, 5 unmarried) Women who did not have a birth in the past 12 months: 388 (201 now married, 185 unmarried)
Housing units in zip code 62814 with a mortgage: 357 (26 second mortgage, 26 both second mortgage and home equity loan) Houses without a mortgage: 9
Median monthly owner costs for units with a mortgage: $1,156 Median monthly owner costs for units without a mortgage: $526
Residents with income below the poverty level in 2022:
This zip code:
8.1%
Whole state:
11.9%
Residents with income below 50% of the poverty level in 2022:
This zip code:
5.4%
Whole state:
5.7%
Median number of rooms in houses and condos:
Here:
6.1
State:
6.4
Median number of rooms in apartments:
Here:
4.7
State:
4.1
Notable locations in this zip code not listed on our city pages
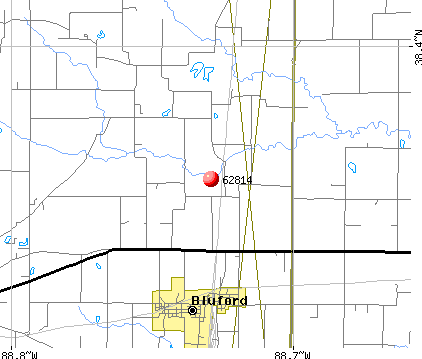
Churches in zip code 62814 include: Oakdale Church (A), First Baptist Church of Bluford (B), Wells Chapel (C), Hickory Hill Church (D), Zion Church (E), Mount Olive Church (F), Mount Zion Church (G), New Home Church (H). Display/hide their locations on the map
Cemeteries: Wells Chapel Cemetery (1), Oak Dale Cemetery (2), Mount Zion Cemetery (3), Mount Olive Cemetery (4), Lowery Cemetery (5), Harmony Cemetery (6), East Hickory Hill Cemetery (7). Display/hide their locations on the map
Streams, rivers, and creeks: Coal Bank Creek (A), Elm Creek (B), Bear Creek (C), Cub Branch (D), Puncheon Creek (E), Gregory Branch (F), Pigeon Creek (G). Display/hide their locations on the map
Size of family households: 242 2-persons, 154 3-persons, 98 4-persons, 20 5-persons, 19 6-persons, 4 7-or-more-persons
Size of nonfamily households: 172 1-person, 9 2-persons
288 married couples with children.
116 single-parent households (37 men, 79 women).
96.9% of residents of 62814 zip code speak English at home.
1.7% of residents speak Spanish at home (100% very well).
0.7% of residents speak other Indo-European language at home (100% very well).
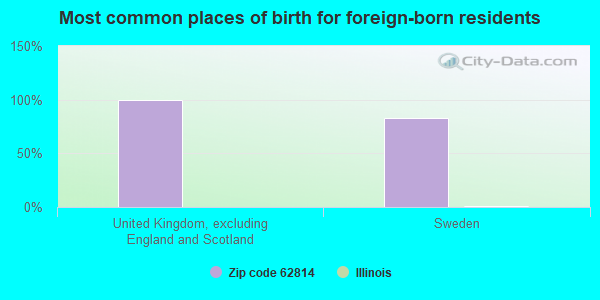
Foreign born population: 5 (0.3%) (0.0% of them are naturalized citizens)
:
0.3%
Whole state:
14.4%
100%United Kingdom, excluding England and Scotland
83%Sweden
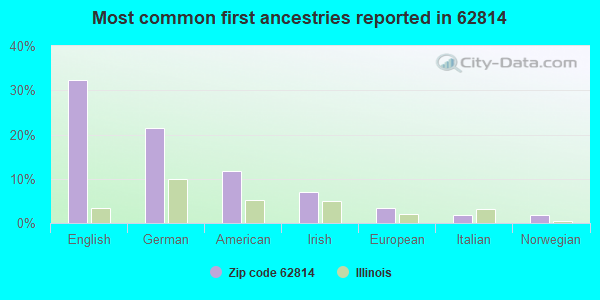
32%English
22%German
12%American
7%Irish
3%European
2%Italian
2%Norwegian
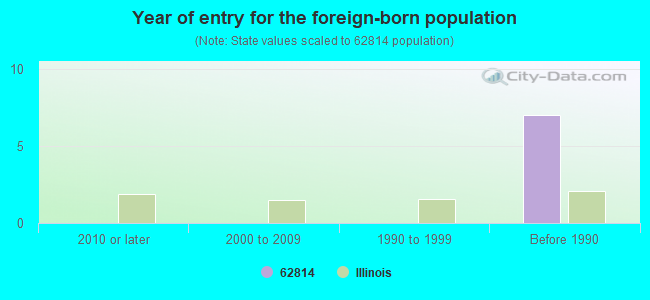
Year of entry for the foreign-born population
02010 or later
02000 to 2009
01990 to 1999
7Before 1990
Facilities with environmental interests located in this zip code:
BLUFORD STP (808 WEST SOUTH AVENUE in BLUFORD, IL)
STATE MASTER (Illinois EPA Project) - National Pollutant Discharge Elimination System Permit National Pollutant Discharge Elimination System NON-MAJOR (Tracking pollutant discharge elimination systems) - permit National Pollutant Discharge Elimination System NON-MAJOR (Tracking pollutant discharge elimination systems) - permit Business SIC classification: SEWERAGE SYSTEMS Alternative names: BLUFORD SEWAGE TREATMENT PLANT, BLUFORD STP, VILLAGE OF, BLUFORD, VILLAGE OF
BLUFORD ELEM SCHOOL (PO BOX 19 in BLUFORD, IL)
(National Center for Education Statistics) - STATE ID-2504111402001 Organizations: BLUFORD C C SCHOOL DIST 114 (SCHOOL DISTRICT)
ILLINOIS CENTRAL RAILROAD CORP (EAST END OF MARKHAM STREET in BLUFORD, IL)
National Pollutant Discharge Elimination System NON-MAJOR (Tracking pollutant discharge elimination systems) - permit
IDOT (IL BRG 041-0083 in BLUFORD, IL)
Small Quantity Generators, between 100 kg and 1000 kg of hazardous waste/month (Resource Conservation and Recovery Act (tracking hazardous waste)) - notification
IDOT (IL BRG 041-0084 in BLUFORD, IL)
Small Quantity Generators, between 100 kg and 1000 kg of hazardous waste/month (Resource Conservation and Recovery Act (tracking hazardous waste)) - notification
Housing units lacking complete plumbing facilities: 5.7% Housing units lacking complete kitchen facilities: 5.0%
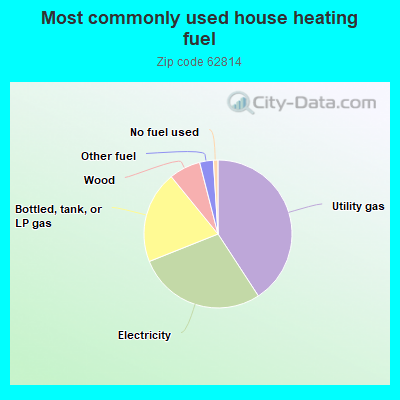
40.9%Utility gas
28.2%Electricity
20.2%Bottled, tank, or LP gas
6.9%Wood
3.0%Other fuel
1.0%No fuel used
Population in 1990: 2,622.
Place of birth for U.S.-born residents:
This state: 1,429
Northeast: 31
Midwest: 161
South: 79
West: 40
69% of the 62814 zip code residents lived in the same house 5 years ago. Out of people who lived in different houses, 66% lived in this county. Out of people who lived in different counties, 50% lived in Illinois.
92% of the 62814 zip code residents lived in the same house 1 year ago. Out of people who lived in different houses, 77% moved from this county. Out of people who lived in different houses, 12% moved from different county within same state. Out of people who lived in different houses, 5% moved from different state.
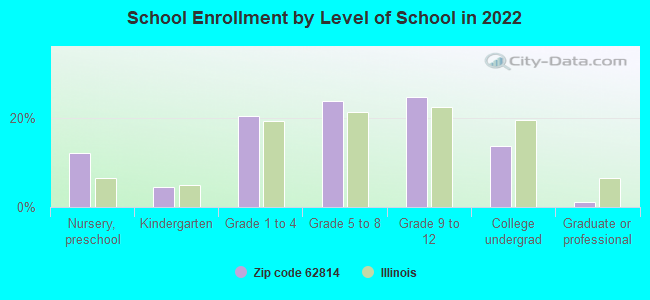
Private vs. public school enrollment:
Students in private schools in grades 1 to 8 (elementary and middle school): 6
Here:
3.6%
Illinois:
13.3%
Students in private schools in grades 9 to 12 (high school): 1
Here:
2.0%
Illinois:
9.9%
Students in private undergraduate colleges: 4
Here:
8.4%
Illinois:
27.4%
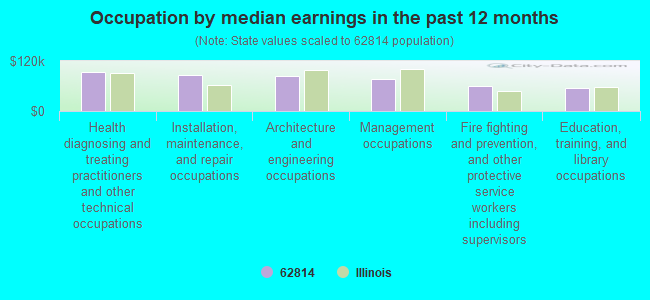
Occupation by median earnings in the past 12 months ($)
94,598Health diagnosing and treating practitioners and other technical occupations
85,449Installation, maintenance, and repair occupations
85,188Architecture and engineering occupations
76,991Management occupations
60,578Fire fighting and prevention, and other protective service workers including supervisors
56,121Education, training, and library occupations
Companies with federal contracts located in this zip code:
HARRELL, JARRELL (19972 E PINECONE RD in BLUFORD, IL; small business)
$6,400 with Army for Operation of Government-Owned Facilities -- Recreation Facilities (Non-Building). Taking place in OK. Signed on 2006-03-20. Completion date: 2006-01-31.
Top industries in this zip code by the number of employees in 2005:
Construction: New Single-Family Housing Construction (except Operative Builders) (20-49 employees: 1 establishment, 1-4 employees: 1 establishment)
Construction: Poured Concrete Foundation and Structure Contractors (10-19: 1, 1-4: 1)
Other Services (except Public Administration): Funeral Homes and Funeral Services (5-9: 1)
Other Services (except Public Administration): Civic and Social Organizations (5-9: 1)
Wholesale Trade: Grain and Field Bean Merchant Wholesalers (5-9: 1)
Administrative and Support and Waste Management and Remediation Services: Landscaping Services (1-4: 1)
Construction: Plumbing, Heating, and Air-Conditioning Contractors (1-4: 1)
Fatal accident statistics in 2014:
Fatal accident count: 1
Vehicles involved in fatal accidents: 1
Fatal accidents caused by drunken drivers: 1
Fatalities: 1
Persons involved in fatal accidents: 1
Pedestrians involved in fatal accidents: 0
Fatal accident statistics in 2012:
Fatal accident count: 1
Vehicles involved in fatal accidents: 1
Fatal accidents caused by drunken drivers: 0
Fatalities: 1
Persons involved in fatal accidents: 1
Pedestrians involved in fatal accidents: 0
2002 - 2018 National Fire Incident Reporting System (NFIRS) incidents
According to the data from the years 2002 - 2018 the average number of fires per year is 9. The highest number of reported fires - 29 took place in 2014, and the least - 1 in 2002. The data has a rising trend.
When looking into fire subcategories, the most reports belonged to: Outside Fires (53.7%), and Structure Fires (34.0%).
Fire incident types reported to NFIRS in Zip Code 62814
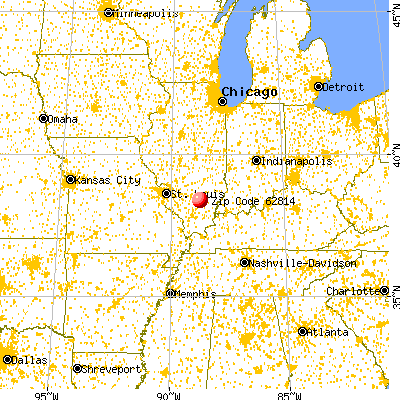


 Nearest zip codes: 62851, 62889, 62872, 62864, 62810, 62850.


 According to the data from the years 2002 - 2018 the average number of fires per year is 9. The highest number of reported fires - 29 took place in 2014, and the least - 1 in 2002. The data has a rising trend.
 When looking into fire subcategories, the most reports belonged to: Outside Fires (53.7%), and Structure Fires (34.0%).