Estimated zip code population in 2022: 2,201 Zip code population in 2010: 2,080 Zip code population in 2000: 2,132
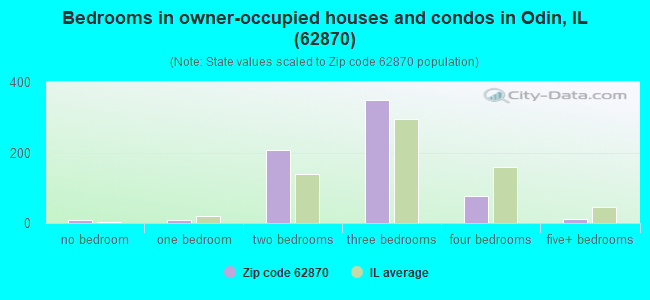
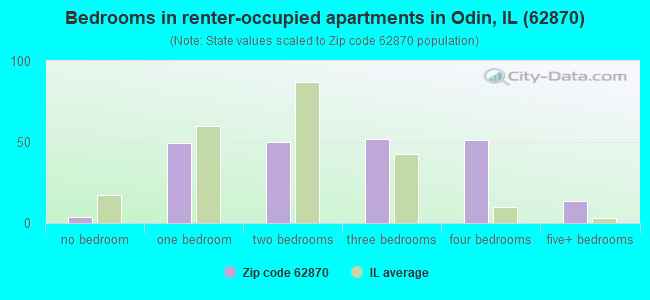
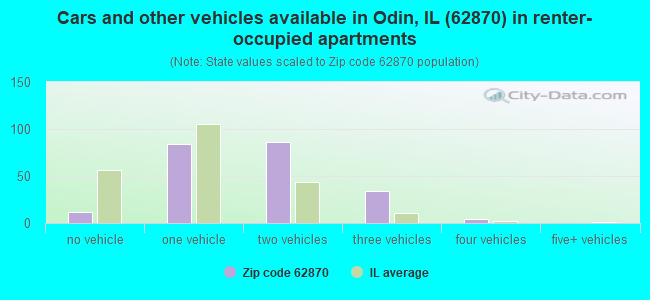
Houses and condos: 1,007 Renter-occupied apartments: 224
% of renters here:
25%
State:
33%
March 2022 cost of living index in zip code 62870: 85.0 (less than average, U.S. average is 100)
Land area: 39.1 sq. mi. Water area: 0.0 sq. mi.
Population density: 56 people per square mile
(very low).
OSM Map
General Map
Google Map
MSN Map
OSM Map
General Map
Google Map
MSN Map
OSM Map
General Map
Google Map
MSN Map
OSM Map
General Map
Google Map
MSN Map
Please wait while loading the map...
Real estate property taxes paid for housing units in 2022:
This zip code:
1.3% ($1,677)
Illinois:
2.0% ($4,912)
Median real estate property taxes paid for housing units with mortgages in 2022: $2,155 (1.5%) Median real estate property taxes paid for housing units with no mortgage in 2022: $1,496 (1.5%)
Business Search- 14 Million verified businesses
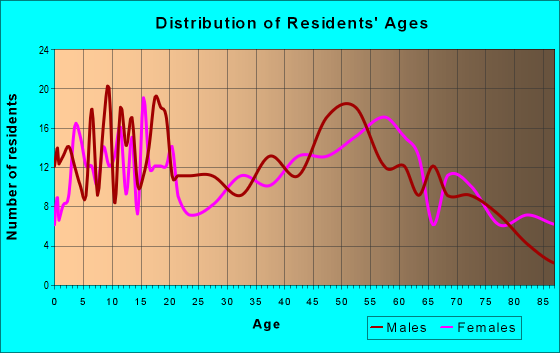
Males: 1,142
(51.9%)
Females: 1,058
(48.1%)
For population 25 years and over in 62870:
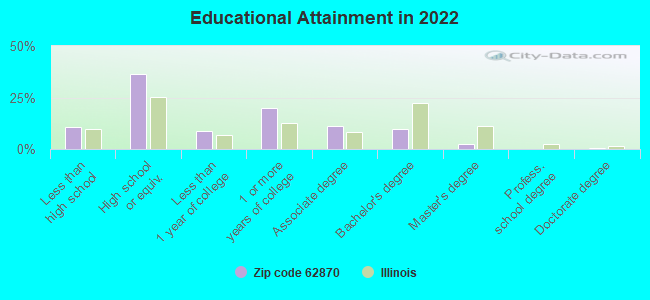
High school or higher: 88.2%
Bachelor's degree or higher: 13.1%
Graduate or professional degree: 3.4%
Unemployed: 5.3%
Mean travel time to work (commute): 24.9 minutes
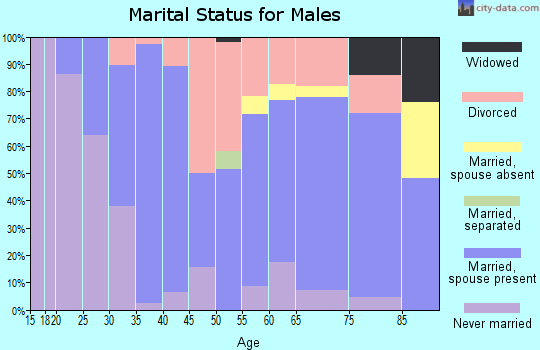
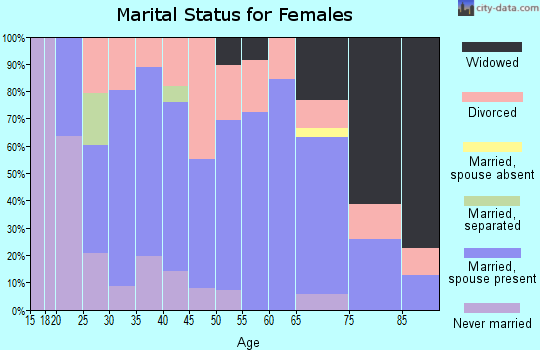
For population 15 years and over in 62870:
Never married: 21.8%
Now married: 53.1%
Separated: 3.0%
Widowed: 8.5%
Divorced: 13.6%
Zip code 62870 compared to state average:
Median house value below state average.
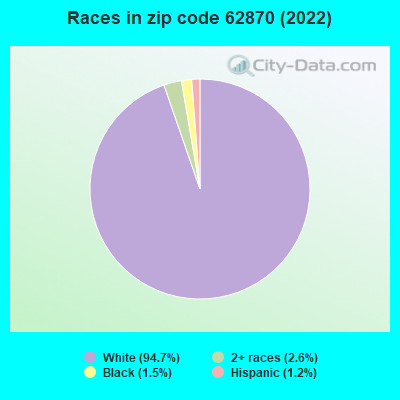
Black race population percentage significantly below state average.
Hispanic race population percentage significantly below state average.
Median age above state average.
Foreign-born population percentage significantly below state average.
Length of stay since moving in significantly above state average.
Number of college students significantly below state average.
Percentage of population with a bachelor's degree or higher significantly below state average.
Averages for the 2020 tax year for zip code 62870, filed in 2021:
Average Adjusted Gross Income (AGI) in 2020: $50,773 (Individual Income Tax Returns)
Here:
$50,773
State:
$82,626
Salary/wage: $42,600 (reported on 83.0% of returns)
Here:
$42,600
State:
$66,640
(% of AGI for various income ranges: 1133.6% for AGIs below $25k, 3393.2% for AGIs $25k-50k, 5669.1% for AGIs $50k-75k, 7904.3% for AGIs $75k-100k, 18600.0% for AGIs $100k-200k)
Taxable interest for individuals: $995 (reported on 23.4% of returns)
This zip code:
$995
Illinois:
$2,376
(% of AGI for various income ranges: 8.4% for AGIs below $25k, 54.1% for AGIs $25k-50k, 30.0% for AGIs $50k-75k, 22.9% for AGIs $75k-100k, 50.0% for AGIs $100k-200k)
Ordinary dividends: $1,945 (reported on 11.7% of returns)
Here:
$1,945
State:
$9,061
(% of AGI for various income ranges: 41.8% for AGIs $25k-50k, 32.7% for AGIs $50k-75k, 143.3% for AGIs $100k-200k)
Net capital gain/loss in AGI: +$4,189 (reported on 9.6% of returns)
Here:
+$4,189
State:
+$31,684
(% of AGI for various income ranges: 60.5% for AGIs $25k-50k, 192.7% for AGIs $50k-75k, 53.3% for AGIs $100k-200k)
Profit/loss from business: +$9,160 (reported on 10.6% of returns)
Here:
+$9,160
State:
+$12,175
(% of AGI for various income ranges: 56.4% for AGIs below $25k, 128.2% for AGIs $25k-50k, 704.3% for AGIs $75k-100k)
Taxable individual retirement arrangement distribution: $7,275 (reported on 8.5% of returns)
62870:
$7,275
Illinois:
$21,613
(% of AGI for various income ranges: 41.2% for AGIs below $25k, 124.1% for AGIs $25k-50k, 294.3% for AGIs $75k-100k)
Earned income credit: $2,144 (reported on 19.1% of returns)
Here:
$2,144
State:
$2,311
(% of AGI for various income ranges: 105.6% for AGIs below $25k, 55.5% for AGIs $25k-50k)
Percentage of individuals using paid preparers for their 2020 taxes: 96.8%
Here:
97%
State:
93%
(% for various income ranges: 96.9% for AGIs below $25k, 92.9% for AGIs $25k-50k, 100.0% for AGIs $50k-75k, 100.0% for AGIs $75k-100k, 100.0% for AGIs $100k-200k)
Averages for the 2012 tax year for zip code 62870, filed in 2013:
Average Adjusted Gross Income (AGI) in 2012: $39,592 (Individual Income Tax Returns)
Here:
$39,592
State:
$68,058
Salary/wage: $35,094 (reported on 82.8% of returns)
Here:
$35,094
State:
$55,396
(% of AGI for various income ranges: 75.9% for AGIs below $25k, 72.0% for AGIs $25k-50k, 76.4% for AGIs $50k-75k, 79.6% for AGIs $75k-100k, 66.0% for AGIs $100k-200k)
Taxable interest for individuals: $1,096 (reported on 29.0% of returns)
This zip code:
$1,096
Illinois:
$1,969
(% of AGI for various income ranges: 0.8% for AGIs below $25k, 1.7% for AGIs $25k-50k, 0.5% for AGIs $50k-75k, 0.4% for AGIs $75k-100k, 0.5% for AGIs $100k-200k)
Ordinary dividends: $1,960 (reported on 10.8% of returns)
Here:
$1,960
State:
$7,786
(% of AGI for various income ranges: 0.3% for AGIs below $25k, 1.3% for AGIs $25k-50k, 1.3% for AGIs $75k-100k)
Net capital gain/loss in AGI: +$1,200 (reported on 6.5% of returns)
Here:
+$1,200
State:
+$22,183
Profit/loss from business: +$6,910 (reported on 10.8% of returns)
Here:
+$6,910
State:
+$12,903
(% of AGI for various income ranges: 3.2% for AGIs below $25k, 2.9% for AGIs $25k-50k, 3.0% for AGIs $50k-75k)
Taxable individual retirement arrangement distribution: $8,471 (reported on 7.5% of returns)
62870:
$8,471
Illinois:
$17,929
(% of AGI for various income ranges: 2.0% for AGIs below $25k, 2.1% for AGIs $25k-50k, 3.5% for AGIs $50k-75k)
Total itemized deductions: $16,131 (20% of AGI, reported on 14.0% of returns)
Here:
$16,131
State:
$26,433
Here:
19.9% of AGI
State:
19.2% of AGI
(% of AGI for various income ranges: 7.1% for AGIs $25k-50k, 8.7% for AGIs $50k-75k, 8.6% for AGIs $100k-200k)
Charity contributions: $3,775 (reported on 8.6% of returns)
Here:
$3,775
State:
$4,525
Taxes paid: $5,523 (reported on 14.0% of returns)
62870:
$5,523
State:
$11,968
(% of AGI for various income ranges: 1.2% for AGIs $25k-50k, 3.1% for AGIs $50k-75k, 4.0% for AGIs $100k-200k)
Earned income credit: $2,435 (reported on 21.5% of returns)
Here:
$2,435
State:
$2,349
(% of AGI for various income ranges: 7.1% for AGIs below $25k, 1.0% for AGIs $25k-50k)
Percentage of individuals using paid preparers for their 2012 taxes: 64.5%
Here:
65%
State:
57%
(% for various income ranges: 60.5% for AGIs below $25k, 66.7% for AGIs $25k-50k, 71.4% for AGIs $50k-75k, 66.7% for AGIs $75k-100k, 66.7% for AGIs $100k-200k)
Averages for the 2004 tax year for zip code 62870, filed in 2005:
Average Adjusted Gross Income (AGI) in 2004: $32,254 (Individual Income Tax Returns)
Here:
$32,254
State:
$54,625
Salary/wage: $29,347 (reported on 85.4% of returns)
Here:
$29,347
State:
$46,811
(% of AGI for various income ranges: 77.0% for AGIs below $10k, 76.5% for AGIs $10k-25k, 78.5% for AGIs $25k-50k, 81.2% for AGIs $50k-75k, 83.7% for AGIs $75k-100k, 55.6% for AGIs over 100k)
Taxable interest for individuals: $1,322 (reported on 38.3% of returns)
This zip code:
$1,322
Illinois:
$2,101
(% of AGI for various income ranges: 3.9% for AGIs below $10k, 2.5% for AGIs $10k-25k, 2.1% for AGIs $25k-50k, 0.6% for AGIs $50k-75k, 0.9% for AGIs $75k-100k, 1.3% for AGIs over 100k)
Taxable dividends: $1,127 (reported on 16.7% of returns)
Here:
$1,127
State:
$4,306
(% of AGI for various income ranges: 2.6% for AGIs below $10k, 0.3% for AGIs $10k-25k, 0.9% for AGIs $25k-50k, 0.1% for AGIs $50k-75k, 0.7% for AGIs $75k-100k, 0.5% for AGIs over 100k)
Net capital gain/loss: +$1,100 (reported on 12.2% of returns)
Here:
+$1,100
State:
+$17,321
(% of AGI for various income ranges: -1.1% for AGIs below $10k, -0.1% for AGIs $10k-25k, 1.1% for AGIs $25k-50k, 0.0% for AGIs $50k-75k, 0.7% for AGIs $75k-100k)
Profit/loss from business: +$4,682 (reported on 11.9% of returns)
Here:
+$4,682
State:
+$11,771
(% of AGI for various income ranges: 3.3% for AGIs below $10k, 3.6% for AGIs $10k-25k, 1.6% for AGIs $25k-50k, -0.6% for AGIs $50k-75k, 4.7% for AGIs $75k-100k)
IRA payment deduction: $1,737 (reported on 2.1% of returns)
62870:
$1,737
Illinois:
$3,087
Total itemized deductions: $14,935 (23% of AGI, reported on 12.0% of returns)
Here:
$14,935
State:
$20,239
Here:
23.2% of AGI
State:
19.5% of AGI
(% of AGI for various income ranges: 6.1% for AGIs $25k-50k, 6.5% for AGIs $50k-75k, 8.9% for AGIs $75k-100k, 7.3% for AGIs over 100k)
Charity contributions deductions: $2,909 (4% of AGI, reported on 8.6% of returns)
Here:
$2,909
State:
$3,719
Here:
4.3% of AGI
State:
3.4% of AGI
Total tax: $3,450 (reported on 70.9% of returns)
62870:
$3,450
State:
$9,882
(% of AGI for various income ranges: 1.5% for AGIs below $10k, 3.7% for AGIs $10k-25k, 5.9% for AGIs $25k-50k, 8.1% for AGIs $50k-75k, 10.5% for AGIs $75k-100k, 16.8% for AGIs over 100k)
Earned income credit: $1,674 (reported on 19.8% of returns)
Here:
$1,674
State:
$1,788
Percentage of individuals using paid preparers for their 2004 taxes: 69.7%
Here:
70%
State:
61%
(% for various income ranges: 56.3% for AGIs below $10k, 69.1% for AGIs $10k-25k, 71.6% for AGIs $25k-50k, 82.2% for AGIs $50k-75k, 76.5% for AGIs $75k-100k, 88.9% for AGIs over 100k)
Household received Food Stamps/SNAP in the past 12 months: 211 Household did not receive Food Stamps/SNAP in the past 12 months: 683
Women who had a birth in the past 12 months: 20 (0 now married, 20 unmarried) Women who did not have a birth in the past 12 months: 379 (235 now married, 141 unmarried)
Housing units in zip code 62870 with a mortgage: 357 (19 second mortgage, 20 both second mortgage and home equity loan) Houses without a mortgage: 14
Median monthly owner costs for units with a mortgage: $932 Median monthly owner costs for units without a mortgage: $448
Residents with income below the poverty level in 2022:
This zip code:
11.8%
Whole state:
11.9%
Residents with income below 50% of the poverty level in 2022:
This zip code:
8.0%
Whole state:
5.7%
Median number of rooms in houses and condos:
Here:
5.7
State:
6.4
Median number of rooms in apartments:
Here:
5.3
State:
4.1
Notable locations in this zip code not listed on our city pages
Notable locations in zip code 62870: Robinette (A), Jones Dairy Farm (B), Marion County Emergency Medical Services (C), Odin Fire Protection District (D). Display/hide their locations on the map
Churches in zip code 62870 include: Barr Church (A), Bethel Church (B), Hoots Chapel Christian Church (C), Marshall Creek Church (D). Display/hide their locations on the map
In group quarters: 89 (-1 institutionalized population)
Size of family households: 251 2-persons, 137 3-persons, 96 4-persons, 57 5-persons, 6 6-persons, 40 7-or-more-persons
Size of nonfamily households: 273 1-person, 18 2-persons
254 married couples with children.
126 single-parent households (43 men, 83 women).
99.3% of residents of 62870 zip code speak English at home.
0.1% of residents speak other Indo-European language at home (100% very well).
0.1% of residents speak Asian or Pacific Island language at home (100% very well).
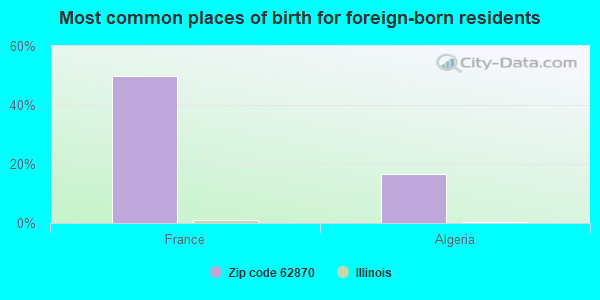
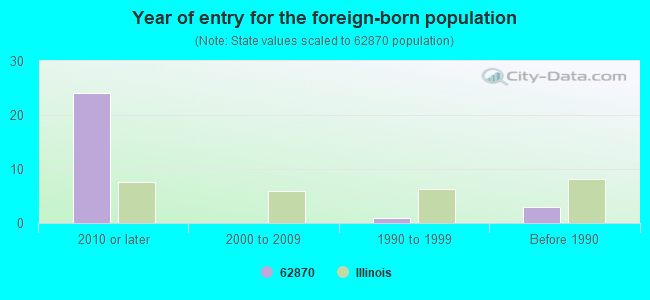
Foreign born population: 6 (0.3%) (83.5% of them are naturalized citizens)
This zip code:
0.3%
Whole state:
14.4%
50%France
17%Algeria
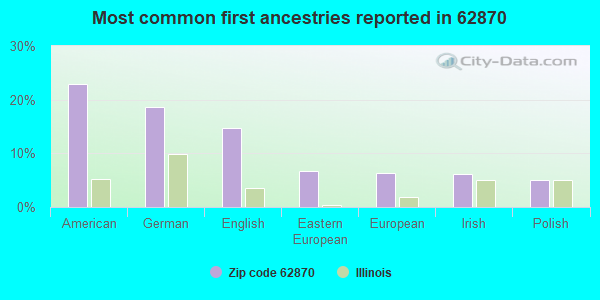
23%American
19%German
15%English
7%Eastern European
6%European
6%Irish
5%Polish
Year of entry for the foreign-born population
242010 or later
02000 to 2009
11990 to 1999
3Before 1990
Facilities with environmental interests located in this zip code:
CITATION OIL & GAS CORP (2302 HOOTS CHAPEL ROAD in ODIN, IL)
STATE MASTER (Illinois EPA Project) - AIR PROGRAM, SOLID WASTE PROGRAM AIR MINOR (AIRS/AFS) CRITERIA AND HAZARDOUS AIR POLLUTANT INVENTORY (Inventory of air pollution sources) Business SIC and NAICS classification: CRUDE PETROLEUM AND NATURAL GAS
ODIN STP (105 PARK STREET in ODIN, IL)
STATE MASTER (Illinois EPA Project) - National Pollutant Discharge Elimination System Permit National Pollutant Discharge Elimination System NON-MAJOR (Tracking pollutant discharge elimination systems) - permit Business SIC classification: SEWERAGE SYSTEMS Alternative names: ODIN STP, VILLAGE OF
ODIN HIGH SCHOOL (PO BOX 250 in ODIN, IL)
(Geographic Names Information System) (National Center for Education Statistics) - STATE ID-1305870000001 Organizations: ODIN COMM H S DIST 700 (SCHOOL DISTRICT)
P J HI-TECH SERVICES (4061 FARTHING RD in ODIN, IL)
STATE MASTER (Illinois EPA Project) - HAZARDOUS WASTE PROGRAM Conditionally Exempt Small Quantity Generators, less than 100 kg/month of hazardous waste (Resource Conservation and Recovery Act (tracking hazardous waste)) - notification Organizations: FARTHING PATRICIA & JERALD (CONTACT/OWNER)
ODIN ELEM SCHOOL (PO BOX 250 in ODIN, IL)
(National Center for Education Statistics) - STATE ID-1305812202001 Organizations: ODIN SCHOOL DIST 122 (SCHOOL DISTRICT)
SALME ONSHORE PROD FACILITY (2302 HOOTS CHAPEL RD in ODIN, IL)
National Pollutant Discharge Elimination System NON-MAJOR (Tracking pollutant discharge elimination systems) - permit National Pollutant Discharge Elimination System NON-MAJOR (Tracking pollutant discharge elimination systems) - permit Business SIC classification: CRUDE PETROLEUM AND NATURAL GAS Alternative names: SALME ONSHORE PROD FAC-ODIN
Housing units lacking complete plumbing facilities: 6.3% Housing units lacking complete kitchen facilities: 5.6%
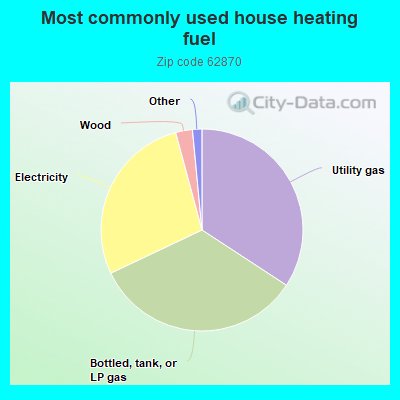
34.3%Utility gas
33.8%Bottled, tank, or LP gas
27.9%Electricity
2.7%Wood
0.9%No fuel used
0.6%Other fuel
Population in 1990: 1,758. Population change in the 1990s: +374 (+21.3%).
Place of birth for U.S.-born residents:
This state: 1,674
Northeast: 31
Midwest: 332
South: 65
West: 66
63% of the 62870 zip code residents lived in the same house 5 years ago. Out of people who lived in different houses, 72% lived in this county. Out of people who lived in different counties, 50% lived in Illinois.
86% of the 62870 zip code residents lived in the same house 1 year ago. Out of people who lived in different houses, 28% moved from this county. Out of people who lived in different houses, 74% moved from different county within same state. Out of people who lived in different houses, 1% moved from abroad.
Private vs. public school enrollment:
Students in private schools in grades 1 to 8 (elementary and middle school): 4
Here:
1.9%
Illinois:
13.3%
Students in private schools in grades 9 to 12 (high school): 17
Here:
18.4%
Illinois:
9.9%
Students in private undergraduate colleges: 5
Here:
21.4%
Illinois:
27.4%
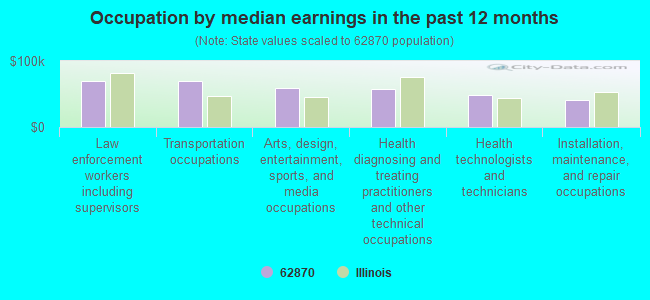
Occupation by median earnings in the past 12 months ($)
70,045Law enforcement workers including supervisors
69,029Transportation occupations
59,563Arts, design, entertainment, sports, and media occupations
57,939Health diagnosing and treating practitioners and other technical occupations
48,447Health technologists and technicians
41,466Installation, maintenance, and repair occupations
Top industries in this zip code by the number of employees in 2005:
Health Care and Social Assistance: Nursing Care Facilities (100-249 employees: 1 establishment)
Health Care and Social Assistance: Ambulance Services (20-49: 1, 10-19: 1)
Other Services (except Public Administration): Religious Organizations (5-9: 1, 1-4: 2)
Construction: Masonry Contractors (1-4: 1)
Arts, Entertainment, and Recreation: Independent Artists, Writers, and Performers (1-4: 1)
People in group quarters in 2010:
88 people in nursing facilities/skilled-nursing facilities
People in group quarters in 2000:
79 people in nursing homes
Fatal accident statistics in 2013:
Fatal accident count: 1
Vehicles involved in fatal accidents: 1
Fatal accidents caused by drunken drivers: 0
Fatalities: 1
Persons involved in fatal accidents: 2
Pedestrians involved in fatal accidents: 0
Fatal accident statistics in 2012:
Fatal accident count: 1
Vehicles involved in fatal accidents: 2
Fatal accidents caused by drunken drivers: 0
Fatalities: 1
Persons involved in fatal accidents: 2
Pedestrians involved in fatal accidents: 0
2002 - 2018 National Fire Incident Reporting System (NFIRS) incidents
Based on the data from the years 2002 - 2018 the average number of fires per year is 22. The highest number of reported fire incidents - 43 took place in 2017, and the least - 8 in 2003. The data has a declining trend.
When looking into fire subcategories, the most incidents belonged to: Outside Fires (47.3%), and Structure Fires (37.7%).
Fire incident types reported to NFIRS in Zip Code 62870


 Nearest zip codes: 62882, 62881, 62875, 62801, 62807, 62893.


 Based on the data from the years 2002 - 2018 the average number of fires per year is 22. The highest number of reported fire incidents - 43 took place in 2017, and the least - 8 in 2003. The data has a declining trend.
 When looking into fire subcategories, the most incidents belonged to: Outside Fires (47.3%), and Structure Fires (37.7%).