Estimated zip code population in 2022: 6,319 Zip code population in 2010: 5,284 Zip code population in 2000: 5,953
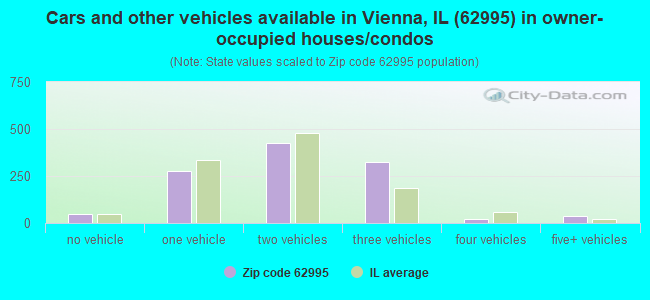
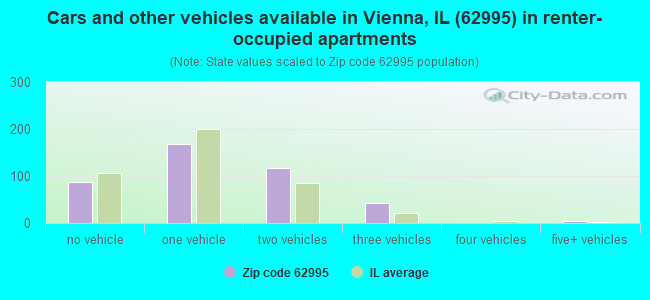
Houses and condos: 1,890 Renter-occupied apartments: 422
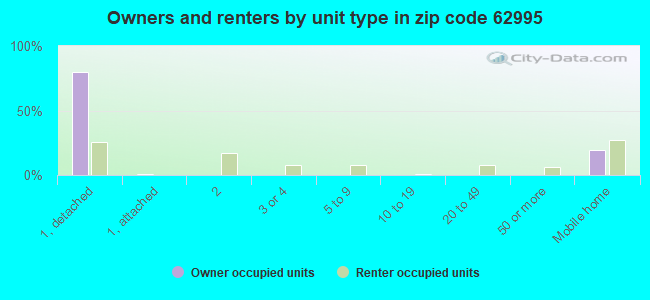
% of renters here:
27%
State:
33%
March 2022 cost of living index in zip code 62995: 84.1 (less than average, U.S. average is 100)
Land area: 108.6 sq. mi. Water area: 1.3 sq. mi.
Population density: 58 people per square mile
(very low).
OSM Map
General Map
Google Map
MSN Map
OSM Map
General Map
Google Map
MSN Map
OSM Map
General Map
Google Map
MSN Map
OSM Map
General Map
Google Map
MSN Map
Please wait while loading the map...
Real estate property taxes paid for housing units in 2022:
This zip code:
1.2% ($1,774)
Illinois:
2.0% ($4,912)
Median real estate property taxes paid for housing units with mortgages in 2022: $2,079 (1.2%) Median real estate property taxes paid for housing units with no mortgage in 2022: $1,408 (1.4%)
Business Search- 14 Million verified businesses
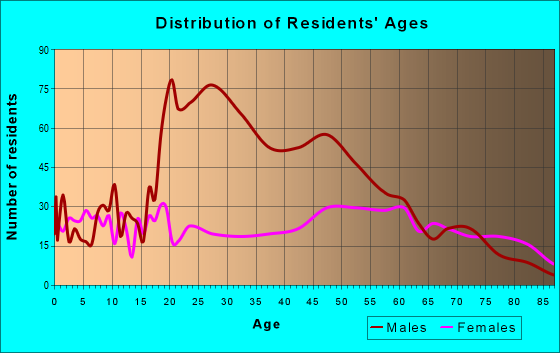
Males: 4,301
(68.1%)
Females: 2,018
(31.9%)
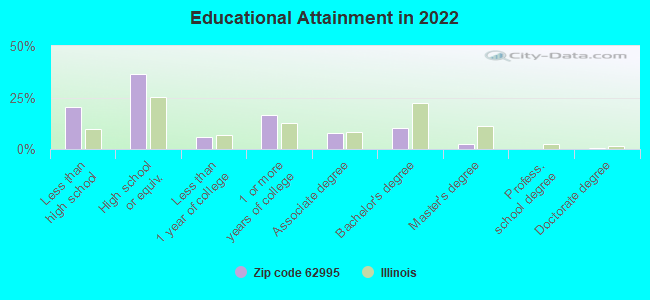
For population 25 years and over in 62995:
High school or higher: 77.4%
Bachelor's degree or higher: 12.7%
Graduate or professional degree: 2.8%
Unemployed: 0.8%
Mean travel time to work (commute): 22.9 minutes
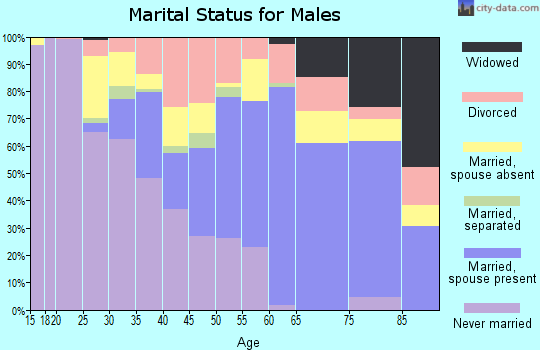
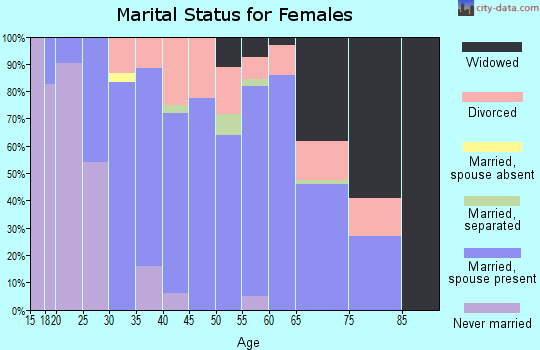
For population 15 years and over in 62995:
Never married: 45.7%
Now married: 32.1%
Separated: 0.6%
Widowed: 5.2%
Divorced: 16.4%
Zip code 62995 compared to state average:
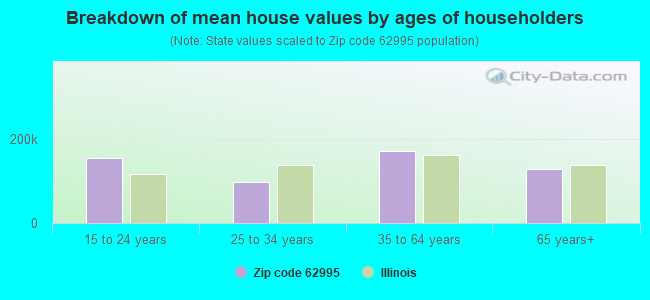
Median house value below state average.
Unemployed percentage significantly below state average.
Hispanic race population percentage significantly below state average.
Foreign-born population percentage significantly below state average.
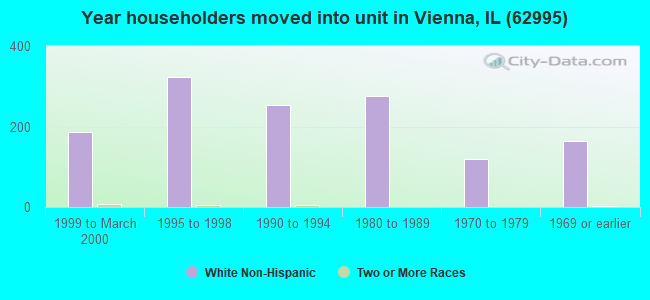
Length of stay since moving in significantly above state average.
Number of college students significantly below state average.
Percentage of population with a bachelor's degree or higher significantly below state average.
Averages for the 2020 tax year for zip code 62995, filed in 2021:
Average Adjusted Gross Income (AGI) in 2020: $49,951 (Individual Income Tax Returns)
Here:
$49,951
State:
$82,626
Salary/wage: $46,159 (reported on 68.7% of returns)
Here:
$46,159
State:
$66,640
(% of AGI for various income ranges: 1205.1% for AGIs below $25k, 3175.7% for AGIs $25k-50k, 4819.5% for AGIs $50k-75k, 7450.8% for AGIs $75k-100k, 15322.0% for AGIs $100k-200k)
Taxable interest for individuals: $731 (reported on 39.7% of returns)
This zip code:
$731
Illinois:
$2,376
(% of AGI for various income ranges: 33.0% for AGIs below $25k, 43.3% for AGIs $25k-50k, 23.8% for AGIs $50k-75k, 35.4% for AGIs $75k-100k, 114.0% for AGIs $100k-200k)
Ordinary dividends: $2,342 (reported on 14.5% of returns)
Here:
$2,342
State:
$9,061
(% of AGI for various income ranges: 18.9% for AGIs below $25k, 21.0% for AGIs $25k-50k, 38.1% for AGIs $50k-75k, 18.5% for AGIs $75k-100k, 248.0% for AGIs $100k-200k)
Net capital gain/loss in AGI: +$3,242 (reported on 13.4% of returns)
Here:
+$3,242
State:
+$31,684
(% of AGI for various income ranges: 5.4% for AGIs below $25k, 33.0% for AGIs $25k-50k, 43.3% for AGIs $50k-75k, 35.4% for AGIs $75k-100k, 348.0% for AGIs $100k-200k)
Profit/loss from business: +$9,210 (reported on 16.2% of returns)
Here:
+$9,210
State:
+$12,175
(% of AGI for various income ranges: 133.0% for AGIs below $25k, 113.3% for AGIs $25k-50k, 252.9% for AGIs $50k-75k, 331.5% for AGIs $75k-100k, 584.7% for AGIs $100k-200k)
Taxable individual retirement arrangement distribution: $11,814 (reported on 7.8% of returns)
62995:
$11,814
Illinois:
$21,613
(% of AGI for various income ranges: 58.6% for AGIs below $25k, 71.0% for AGIs $25k-50k, 363.3% for AGIs $50k-75k, 307.3% for AGIs $100k-200k)
Total itemized deductions: $28,750 (reported on 2.2% of returns)
Here:
$28,750
State:
$34,948
(% of AGI for various income ranges: 884.6% for AGIs $75k-100k)
Charity contributions: $8,833 (reported on 1.7% of returns)
Here:
$8,833
State:
$13,122
(% of AGI for various income ranges: 126.2% for AGIs $50k-75k)
Taxes paid: $6,250 (reported on 2.2% of returns)
62995:
$6,250
State:
$8,563
(% of AGI for various income ranges: 192.3% for AGIs $75k-100k)
Earned income credit: $2,350 (reported on 14.5% of returns)
Here:
$2,350
State:
$2,311
(% of AGI for various income ranges: 110.5% for AGIs below $25k, 67.3% for AGIs $25k-50k)
Percentage of individuals using paid preparers for their 2020 taxes: 87.7%
Here:
88%
State:
93%
(% for various income ranges: 75.7% for AGIs below $25k, 94.7% for AGIs $25k-50k, 96.4% for AGIs $50k-75k, 94.4% for AGIs $75k-100k, 95.7% for AGIs $100k-200k, 100.0% for AGIs over 200k)
Averages for the 2012 tax year for zip code 62995, filed in 2013:
Average Adjusted Gross Income (AGI) in 2012: $47,098 (Individual Income Tax Returns)
Here:
$47,098
State:
$68,058
Salary/wage: $39,335 (reported on 79.0% of returns)
Here:
$39,335
State:
$55,396
(% of AGI for various income ranges: 68.4% for AGIs below $25k, 67.2% for AGIs $25k-50k, 69.2% for AGIs $50k-75k, 63.4% for AGIs $75k-100k, 72.4% for AGIs $100k-200k, 45.3% for AGIs over 200k)
Taxable interest for individuals: $1,136 (reported on 32.9% of returns)
This zip code:
$1,136
Illinois:
$1,969
(% of AGI for various income ranges: 2.7% for AGIs below $25k, 1.0% for AGIs $25k-50k, 0.4% for AGIs $50k-75k, 0.3% for AGIs $75k-100k, 0.5% for AGIs $100k-200k, 1.0% for AGIs over 200k)
Ordinary dividends: $2,112 (reported on 15.6% of returns)
Here:
$2,112
State:
$7,786
(% of AGI for various income ranges: 1.0% for AGIs below $25k, 0.6% for AGIs $25k-50k, 1.0% for AGIs $50k-75k, 0.8% for AGIs $75k-100k, 0.5% for AGIs $100k-200k)
Net capital gain/loss in AGI: +$9,071 (reported on 12.6% of returns)
Here:
+$9,071
State:
+$22,183
(% of AGI for various income ranges: 0.9% for AGIs $25k-50k, 1.0% for AGIs $50k-75k, 0.4% for AGIs $75k-100k, 9.0% for AGIs $100k-200k)
Profit/loss from business: +$7,974 (reported on 16.2% of returns)
Here:
+$7,974
State:
+$12,903
(% of AGI for various income ranges: 6.7% for AGIs below $25k, 1.5% for AGIs $25k-50k, 2.0% for AGIs $50k-75k, 2.4% for AGIs $75k-100k, 4.0% for AGIs $100k-200k)
Taxable individual retirement arrangement distribution: $6,050 (reported on 9.6% of returns)
62995:
$6,050
Illinois:
$17,929
(% of AGI for various income ranges: 3.2% for AGIs below $25k, 1.5% for AGIs $25k-50k, 1.2% for AGIs $50k-75k, 2.1% for AGIs $75k-100k)
Total itemized deductions: $18,679 (20% of AGI, reported on 19.8% of returns)
Here:
$18,679
State:
$26,433
Here:
19.8% of AGI
State:
19.2% of AGI
(% of AGI for various income ranges: 4.0% for AGIs below $25k, 5.2% for AGIs $25k-50k, 7.5% for AGIs $50k-75k, 9.5% for AGIs $75k-100k, 14.0% for AGIs $100k-200k)
Charity contributions: $4,605 (reported on 13.2% of returns)
Here:
$4,605
State:
$4,525
(% of AGI for various income ranges: 0.9% for AGIs $25k-50k, 1.0% for AGIs $50k-75k, 1.8% for AGIs $75k-100k, 2.6% for AGIs $100k-200k)
Taxes paid: $6,330 (reported on 19.8% of returns)
62995:
$6,330
State:
$11,968
(% of AGI for various income ranges: 0.5% for AGIs below $25k, 1.1% for AGIs $25k-50k, 2.0% for AGIs $50k-75k, 2.9% for AGIs $75k-100k, 6.5% for AGIs $100k-200k)
Earned income credit: $2,130 (reported on 18.0% of returns)
Here:
$2,130
State:
$2,349
(% of AGI for various income ranges: 6.1% for AGIs below $25k, 1.1% for AGIs $25k-50k)
Percentage of individuals using paid preparers for their 2012 taxes: 69.5%
Here:
69%
State:
57%
(% for various income ranges: 63.2% for AGIs below $25k, 70.3% for AGIs $25k-50k, 75.0% for AGIs $50k-75k, 77.8% for AGIs $75k-100k, 71.4% for AGIs $100k-200k, 100.0% for AGIs over 200k)
Averages for the 2004 tax year for zip code 62995, filed in 2005:
Average Adjusted Gross Income (AGI) in 2004: $34,546 (Individual Income Tax Returns)
Here:
$34,546
State:
$54,625
Salary/wage: $31,869 (reported on 80.3% of returns)
Here:
$31,869
State:
$46,811
(% of AGI for various income ranges: 112.2% for AGIs below $10k, 69.7% for AGIs $10k-25k, 74.3% for AGIs $25k-50k, 79.1% for AGIs $50k-75k, 75.8% for AGIs $75k-100k, 60.0% for AGIs over 100k)
Taxable interest for individuals: $1,509 (reported on 46.2% of returns)
This zip code:
$1,509
Illinois:
$2,101
(% of AGI for various income ranges: 6.4% for AGIs below $10k, 3.5% for AGIs $10k-25k, 2.5% for AGIs $25k-50k, 1.3% for AGIs $50k-75k, 1.3% for AGIs $75k-100k, 1.2% for AGIs over 100k)
Taxable dividends: $2,013 (reported on 18.1% of returns)
Here:
$2,013
State:
$4,306
(% of AGI for various income ranges: 2.9% for AGIs below $10k, 0.7% for AGIs $10k-25k, 0.9% for AGIs $25k-50k, 0.6% for AGIs $50k-75k, 1.5% for AGIs $75k-100k, 1.5% for AGIs over 100k)
Net capital gain/loss: +$4,469 (reported on 15.5% of returns)
Here:
+$4,469
State:
+$17,321
(% of AGI for various income ranges: -1.1% for AGIs below $10k, 0.8% for AGIs $10k-25k, 0.4% for AGIs $25k-50k, 1.4% for AGIs $50k-75k, 0.5% for AGIs $75k-100k, 9.6% for AGIs over 100k)
Profit/loss from business: +$3,985 (reported on 15.9% of returns)
Here:
+$3,985
State:
+$11,771
(% of AGI for various income ranges: -8.2% for AGIs below $10k, 0.7% for AGIs $10k-25k, 1.6% for AGIs $25k-50k, 2.5% for AGIs $50k-75k, 2.7% for AGIs $75k-100k, 2.7% for AGIs over 100k)
IRA payment deduction: $2,760 (reported on 1.5% of returns)
62995:
$2,760
Illinois:
$3,087
Total itemized deductions: $14,610 (23% of AGI, reported on 19.1% of returns)
Here:
$14,610
State:
$20,239
Here:
22.6% of AGI
State:
19.5% of AGI
(% of AGI for various income ranges: 5.7% for AGIs $10k-25k, 7.3% for AGIs $25k-50k, 9.0% for AGIs $50k-75k, 9.7% for AGIs $75k-100k, 9.1% for AGIs over 100k)
Charity contributions deductions: $3,557 (5% of AGI, reported on 16.6% of returns)
Here:
$3,557
State:
$3,719
Here:
5.3% of AGI
State:
3.4% of AGI
(% of AGI for various income ranges: 0.7% for AGIs $10k-25k, 1.3% for AGIs $25k-50k, 2.1% for AGIs $50k-75k, 2.6% for AGIs $75k-100k, 1.9% for AGIs over 100k)
Total tax: $4,076 (reported on 73.2% of returns)
62995:
$4,076
State:
$9,882
(% of AGI for various income ranges: 3.3% for AGIs below $10k, 3.6% for AGIs $10k-25k, 6.2% for AGIs $25k-50k, 8.4% for AGIs $50k-75k, 10.6% for AGIs $75k-100k, 16.6% for AGIs over 100k)
Earned income credit: $1,699 (reported on 16.2% of returns)
Here:
$1,699
State:
$1,788
Percentage of individuals using paid preparers for their 2004 taxes: 74.1%
Here:
74%
State:
61%
(% for various income ranges: 66.7% for AGIs below $10k, 72.6% for AGIs $10k-25k, 79.5% for AGIs $25k-50k, 79.7% for AGIs $50k-75k, 69.5% for AGIs $75k-100k, 80.7% for AGIs over 100k)
Household received Food Stamps/SNAP in the past 12 months: 384 Household did not receive Food Stamps/SNAP in the past 12 months: 1,186
Women who had a birth in the past 12 months: 12 (10 now married, 1 unmarried) Women who did not have a birth in the past 12 months: 691 (291 now married, 398 unmarried)
Housing units in zip code 62995 with a mortgage: 594 (66 second mortgage, 53 both second mortgage and home equity loan) Houses without a mortgage: 29
Median monthly owner costs for units with a mortgage: $1,200 Median monthly owner costs for units without a mortgage: $454
Residents with income below the poverty level in 2022:
This zip code:
27.0%
Whole state:
11.9%
Residents with income below 50% of the poverty level in 2022:
This zip code:
11.0%
Whole state:
5.7%
Median number of rooms in houses and condos:
Here:
5.8
State:
6.4
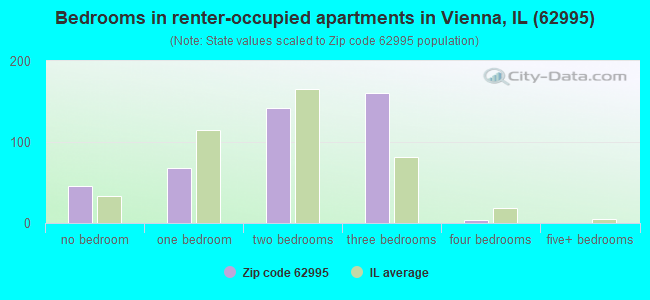
Median number of rooms in apartments:
Here:
4.2
State:
4.1
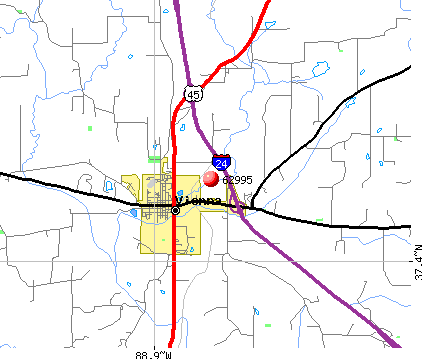
Notable locations in this zip code not listed on our city pages
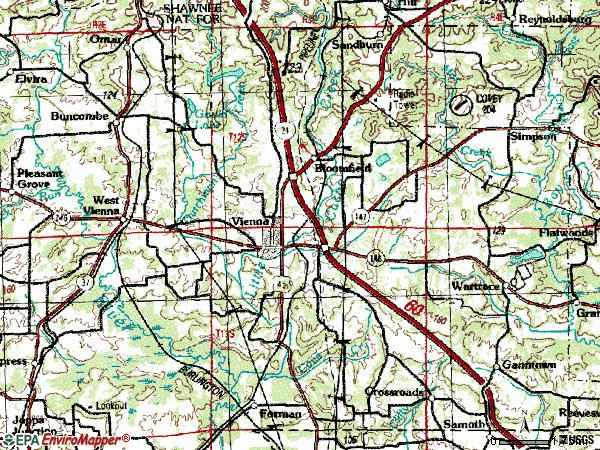
Notable locations in zip code 62995: Shawnee Correctional Center (A), Carnegie Library (B), Johnson County Courthouse (C), Johnson County Ambulance Service (D), Vienna Volunteer Fire Department (E), Vienna Correctional Center (F). Display/hide their locations on the map
Churches in zip code 62995 include: Church of Christ (A), First Baptist Church (B), First Christian Church (C), United Methodist Church of Vienna (D), Ballowe Church (E), Berea Church (F), Bethlehem Church (G), Pleasant Ridge Church (H), Ridenhower Church (I). Display/hide their locations on the map
Cemeteries: Vienna Cemetery (1), Odd Fellows Cemetery (2), Fain Cemetery (3), Whiteside Cemetery (4), Wildcat Cemetery (5), Bridges Cemetery (6), Wymore Cemetery (7). Display/hide their locations on the map
Reservoirs: Vienna City Lake (A), Tall Tree Lake (B), Cedar Lake (C), Little Cache Number 1 Reservoir (D), Little Cache Number 5 Reservoir (E), Vienna Reservoir (F), Gould Lake (G). Display/hide their locations on the map
Streams, rivers, and creeks: Cave Creek (A), Blue Branch (B), McCorkle Creek (C), Max Creek (D), Little Cache Creek (E), Cedar Creek (F). Display/hide their locations on the map
516 married couples with children.
228 single-parent households (46 men, 182 women).
93.6% of residents of 62995 zip code speak English at home.
2.3% of residents speak Spanish at home (49% very well, 46% well, 4% not well).
3.6% of residents speak other Indo-European language at home (58% very well, 23% well, 19% not well).
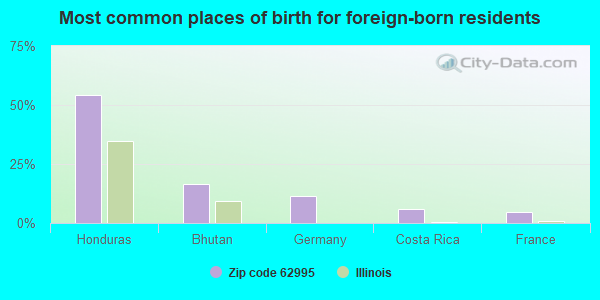
Foreign born population: 103 (1.6%) (29.3% of them are naturalized citizens)
This zip code:
1.6%
Whole state:
14.4%
54%Honduras
17%Bhutan
12%Germany
6%Costa Rica
5%France
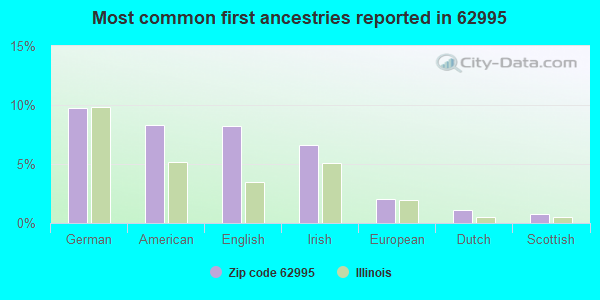
10%German
8%American
8%English
7%Irish
2%European
1%Dutch
1%Scottish
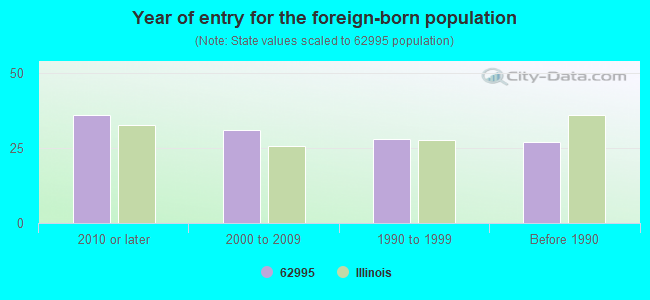
Year of entry for the foreign-born population
362010 or later
312000 to 2009
281990 to 1999
27Before 1990
Facilities with environmental interests located in this zip code:
MASTERCAST (195 DUTCHMAN LAKE RD in VIENNA, IL)
STATE MASTER (Illinois EPA Project) - AIR PROGRAM AIR MINOR (AIRS/AFS) CRITERIA AND HAZARDOUS AIR POLLUTANT INVENTORY (Inventory of air pollution sources) Business SIC classification: NONCLASSIFIABLE ESTABLISHMENTS
HOUSING AUTHORITY (501 N 4TH ST in VIENNA, IL)
STATE MASTER (Illinois EPA Project) - SOLID WASTE PROGRAM (Resource Conservation and Recovery Act (tracking hazardous waste)) Organizations: HOUSING AUTH OF JOHNSON COUNTY (CONTACT/OPERATOR)
, HOUSING AUTHORITY OF JOHNSON CO (CONTACT/OWNER)
Alternative names: HOUSING AUTHORITY OF JOHNSON CTY
KOTTER READY-MIX (ROUTE 2 in VIENNA, IL)
STATE MASTER (Illinois EPA Project) - AIR PROGRAM AIR MINOR (AIRS/AFS) Business SIC classification: READY-MIXED CONCRETE
MASSAC OIL CO INC (PRIVATE ROAD in VIENNA, IL)
STATE MASTER (Illinois EPA Project) - AIR PROGRAM AIR MINOR (AIRS/AFS) Business SIC classification: PETROLEUM BULK STATIONS AND TERMINALS
PATRICIAN OF VIENNA (4060 MT. SHELTER ROAD, BOX 67 in VIENNA, IL)
STATE MASTER (Illinois EPA Project) - National Pollutant Discharge Elimination System Permit National Pollutant Discharge Elimination System NON-MAJOR (Tracking pollutant discharge elimination systems) - permit Business SIC classification: SKILLED NURSING CARE FACILITIES
ILDOT BRG 044 0051 (TR 140 OVER FAI RTE 24 in VIENNA, IL)
(Resource Conservation and Recovery Act (tracking hazardous waste))
IDOC SHAWNEE CORRECTIONAL (6665 STATE RTE 146 E in VIENNA, IL)
Conditionally Exempt Small Quantity Generators, less than 100 kg/month of hazardous waste (Resource Conservation and Recovery Act (tracking hazardous waste)) Organizations: KEN BAIN (CONTACT/OPERATOR)
, STATE OF ILLINOIS (CONTACT/OWNER)
IDOT (BRG 044-0014 in VIENNA, IL)
Small Quantity Generators, between 100 kg and 1000 kg of hazardous waste/month (Resource Conservation and Recovery Act (tracking hazardous waste)) - notification
IL EPA VIENNA HHW SITE (208 E MAIN B in VIENNA, IL)
Small Quantity Generators, between 100 kg and 1000 kg of hazardous waste/month (Resource Conservation and Recovery Act (tracking hazardous waste)) - notification
Housing units lacking complete plumbing facilities: 9.4% Housing units lacking complete kitchen facilities: 1.9%
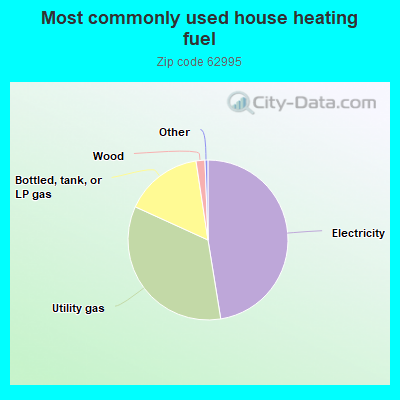
47.5%Electricity
34.4%Utility gas
15.8%Bottled, tank, or LP gas
1.8%Wood
Population in 1990: 2,767. Population change in the 1990s: +3,186 (+115.1%).
Place of birth for U.S.-born residents:
This state: 4,601
Northeast: 52
Midwest: 553
South: 826
West: 123
55% of the 62995 zip code residents lived in the same house 5 years ago. Out of people who lived in different houses, 21% lived in this county. Out of people who lived in different counties, 50% lived in Illinois.
76% of the 62995 zip code residents lived in the same house 1 year ago. Out of people who lived in different houses, 9% moved from this county. Out of people who lived in different houses, 97% moved from different county within same state. Out of people who lived in different houses, 0% moved from different state.
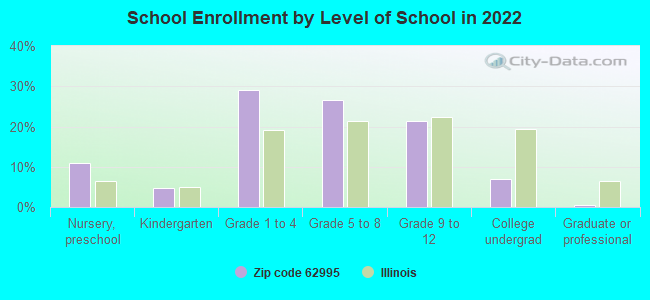
Private vs. public school enrollment:
Students in private schools in grades 1 to 8 (elementary and middle school): 71
Here:
11.1%
Illinois:
13.3%
Students in private schools in grades 9 to 12 (high school):
Here:
0.0%
Illinois:
9.9%
Students in private undergraduate colleges:
Here:
0.0%
Illinois:
27.4%
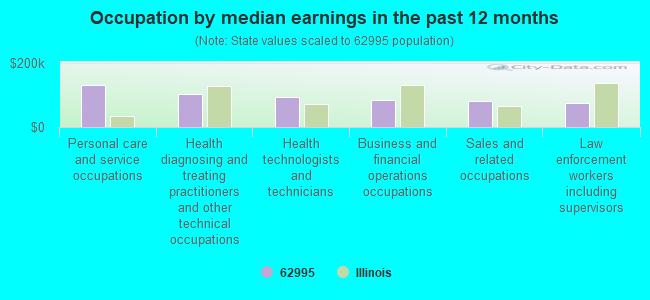
Occupation by median earnings in the past 12 months ($)
132,393Personal care and service occupations
103,699Health diagnosing and treating practitioners and other technical occupations
93,150Health technologists and technicians
85,278Business and financial operations occupations
80,369Sales and related occupations
75,545Law enforcement workers including supervisors
Companies with federal contracts located in this zip code:
SHOEMAKER CONSTRUCTION INC (600 WATERS ST in VIENNA, IL; small business) 3 employees, $700000 revenue.
$214,000 with Forest Service (disused code: now 12C2) for Construction of Structures and Facilities -- Recreational Buildings. Signed on 2001-09-15. Completion date: 2002-03-15.
Top industries in this zip code by the number of employees in 2005:
Wholesale Trade: Petroleum Bulk Stations and Terminals (20-49: 1)
Health Care and Social Assistance: Services for the Elderly and Persons with Disabilities (20-49: 1)
People in group quarters in 2010:
1,503 people in state prisons
43 people in nursing facilities/skilled-nursing facilities
7 people in group homes intended for adults
People in group quarters in 2000:
2,640 people in state prisons
49 people in nursing homes
3 people in agriculture workers' dormitories on farms
Fatal accident statistics in 2013:
Fatal accident count: 1
Vehicles involved in fatal accidents: 2
Fatal accidents caused by drunken drivers: 0
Fatalities: 1
Persons involved in fatal accidents: 4
Pedestrians involved in fatal accidents: 0
Fatal accident statistics in 2012:
Fatal accident count: 1
Vehicles involved in fatal accidents: 1
Fatal accidents caused by drunken drivers: 0
Fatalities: 1
Persons involved in fatal accidents: 1
Pedestrians involved in fatal accidents: 0
2002 - 2018 National Fire Incident Reporting System (NFIRS) incidents
According to the data from the years 2002 - 2018 the average number of fires per year is 15. The highest number of reported fires - 27 took place in 2010, and the least - 0 in 2005. The data has a declining trend.
When looking into fire subcategories, the most reports belonged to: Structure Fires (34.2%), and Outside Fires (31.5%).
Fire incident types reported to NFIRS in Zip Code 62995
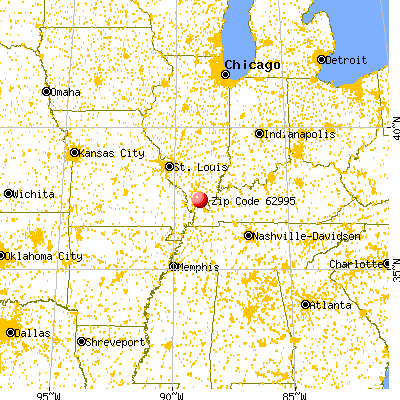


 Nearest zip codes: 62908, 62972, 62943, 62939, 62912, 62923.


 According to the data from the years 2002 - 2018 the average number of fires per year is 15. The highest number of reported fires - 27 took place in 2010, and the least - 0 in 2005. The data has a declining trend.
 When looking into fire subcategories, the most reports belonged to: Structure Fires (34.2%), and Outside Fires (31.5%).