Estimated zip code population in 2022: 1,195 Zip code population in 2010: 1,589 Zip code population in 2000: 1,636
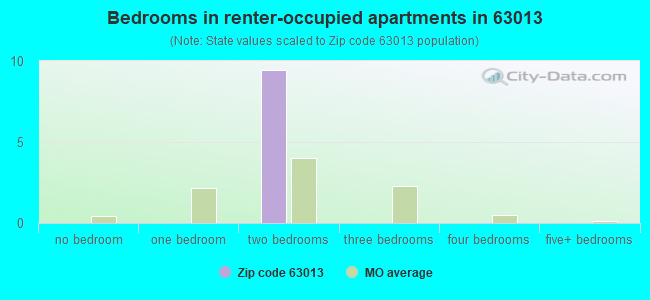
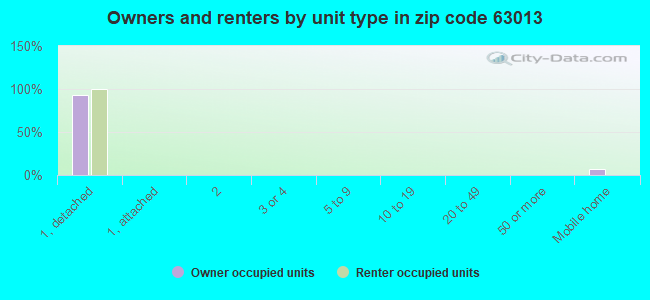
Houses and condos: 556 Renter-occupied apartments: 9
% of renters here:
2%
State:
32%
March 2022 cost of living index in zip code 63013: 83.4 (less than average, U.S. average is 100)
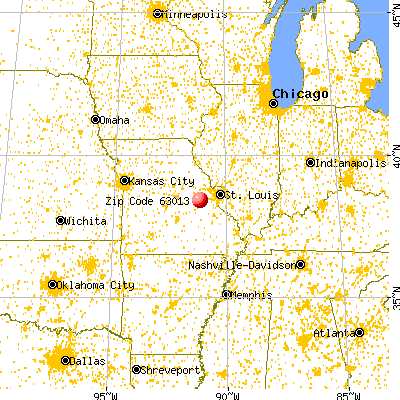
Land area: 37.5 sq. mi. Water area: 0.0 sq. mi.
Population density: 32 people per square mile
(very low).
OSM Map
General Map
Google Map
MSN Map
OSM Map
General Map
Google Map
MSN Map
OSM Map
General Map
Google Map
MSN Map
OSM Map
General Map
Google Map
MSN Map
Please wait while loading the map...
Real estate property taxes paid for housing units in 2022:
This zip code:
0.7% ($2,144)
Missouri:
0.8% ($1,810)
Median real estate property taxes paid for housing units with mortgages in 2022: $1,951 Median real estate property taxes paid for housing units with no mortgage in 2022: $2,381
Business Search- 14 Million verified businesses
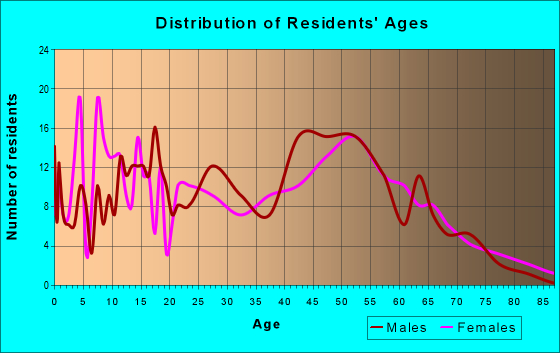
Males: 600
(50.2%)
Females: 595
(49.8%)
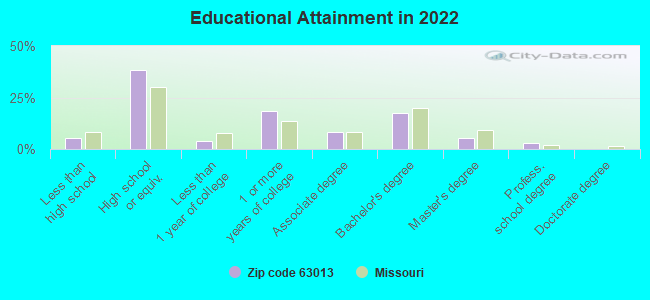
For population 25 years and over in 63013:
High school or higher: 94.4%
Bachelor's degree or higher: 25.9%
Graduate or professional degree: 8.3%
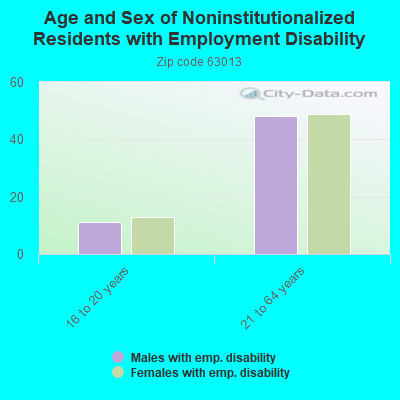
Unemployed: 6.4%
Mean travel time to work (commute): 29.1 minutes
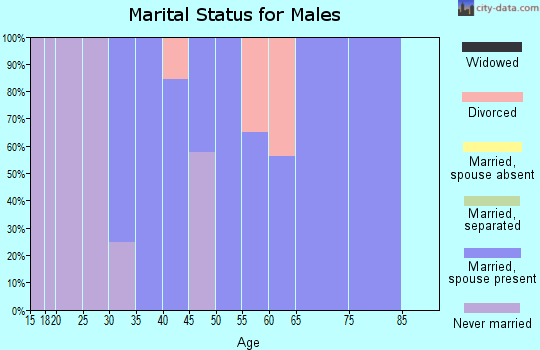
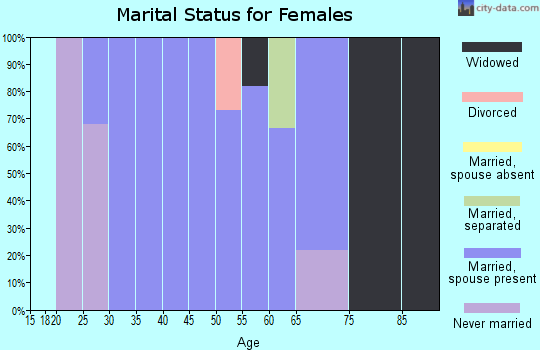
For population 15 years and over in 63013:
Never married: 25.8%
Now married: 65.2%
Separated: 0.0%
Widowed: 1.9%
Divorced: 7.2%
Zip code 63013 compared to state average:
Median household income above state average.
Unemployed percentage above state average.
Black race population percentage significantly below state average.
Hispanic race population percentage significantly below state average.
Median age significantly above state average.
Foreign-born population percentage significantly below state average.
Renting percentage significantly below state average.
Length of stay since moving in significantly above state average.
House age below state average.
Number of college students significantly below state average.
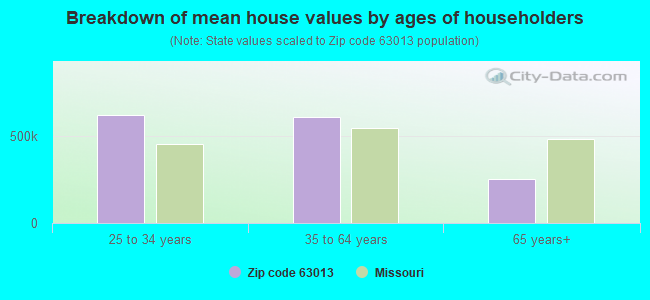
Estimated median house/condo value in 2022: $321,150
63013:
$321,150
Missouri:
$221,200
According to our research of Missouri and other state lists, there were 4 registered sex offenders living in 63013 zip code as of April 26, 2024. The ratio of all residents to sex offenders in zip code 63013 is 433 to 1. The ratio of registered sex offenders to all residents in this zip code is lower than the state average.
Median resident age:
This zip code:
51.6 years
Missouri median age:
39.1 years
Average household size:
This zip code:
2.7 people
Missouri:
2.4 people
Averages for the 2020 tax year for zip code 63013, filed in 2021:
Average Adjusted Gross Income (AGI) in 2020: $62,925 (Individual Income Tax Returns)
Here:
$62,925
State:
$68,151
Salary/wage: $56,115 (reported on 82.3% of returns)
Here:
$56,115
State:
$56,131
(% of AGI for various income ranges: 1138.7% for AGIs below $25k, 3676.4% for AGIs $25k-50k, 6236.7% for AGIs $50k-75k, 8470.0% for AGIs $75k-100k, 18078.0% for AGIs $100k-200k)
Taxable interest for individuals: $814 (reported on 35.4% of returns)
This zip code:
$814
Missouri:
$1,586
(% of AGI for various income ranges: 14.0% for AGIs below $25k, 21.4% for AGIs $25k-50k, 36.7% for AGIs $50k-75k, 11.4% for AGIs $75k-100k, 136.0% for AGIs $100k-200k)
Ordinary dividends: $2,850 (reported on 22.8% of returns)
Here:
$2,850
State:
$10,947
(% of AGI for various income ranges: 36.0% for AGIs below $25k, 54.3% for AGIs $25k-50k, 117.8% for AGIs $50k-75k, 277.0% for AGIs $100k-200k)
Net capital gain/loss in AGI: +$8,233 (reported on 19.0% of returns)
Here:
+$8,233
State:
+$18,453
(% of AGI for various income ranges: 0.7% for AGIs below $25k, 70.7% for AGIs $25k-50k, 250.0% for AGIs $50k-75k, 134.3% for AGIs $75k-100k, 816.0% for AGIs $100k-200k)
Profit/loss from business: +$8,630 (reported on 12.7% of returns)
Here:
+$8,630
State:
+$12,260
(% of AGI for various income ranges: 24.7% for AGIs below $25k, 325.0% for AGIs $25k-50k, 374.3% for AGIs $75k-100k, 109.0% for AGIs $100k-200k)
Taxable individual retirement arrangement distribution: $15,780 (reported on 12.7% of returns)
63013:
$15,780
Missouri:
$19,719
(% of AGI for various income ranges: 204.3% for AGIs $25k-50k, 495.6% for AGIs $50k-75k, 1208.6% for AGIs $75k-100k)
Total itemized deductions: $31,400 (reported on 2.5% of returns)
Here:
$31,400
State:
$36,651
(% of AGI for various income ranges: 448.6% for AGIs $25k-50k)
Taxes paid: $5,200 (reported on 3.8% of returns)
63013:
$5,200
State:
$7,608
(% of AGI for various income ranges: 111.4% for AGIs $25k-50k)
Earned income credit: $2,212 (reported on 10.1% of returns)
Here:
$2,212
State:
$2,315
(% of AGI for various income ranges: 46.0% for AGIs below $25k, 77.1% for AGIs $25k-50k)
Percentage of individuals using paid preparers for their 2020 taxes: 93.7%
Here:
94%
State:
93%
(% for various income ranges: 90.5% for AGIs below $25k, 94.7% for AGIs $25k-50k, 92.9% for AGIs $50k-75k, 100.0% for AGIs $75k-100k, 93.8% for AGIs $100k-200k)
Averages for the 2012 tax year for zip code 63013, filed in 2013:
Average Adjusted Gross Income (AGI) in 2012: $50,818 (Individual Income Tax Returns)
Here:
$50,818
State:
$55,896
Salary/wage: $44,683 (reported on 85.5% of returns)
Here:
$44,683
State:
$46,205
(% of AGI for various income ranges: 74.6% for AGIs below $25k, 79.9% for AGIs $25k-50k, 75.4% for AGIs $50k-75k, 76.9% for AGIs $75k-100k, 71.8% for AGIs $100k-200k)
Taxable interest for individuals: $693 (reported on 39.5% of returns)
This zip code:
$693
Missouri:
$1,559
(% of AGI for various income ranges: 2.0% for AGIs below $25k, 0.7% for AGIs $25k-50k, 0.3% for AGIs $50k-75k, 0.3% for AGIs $75k-100k, 0.4% for AGIs $100k-200k)
Ordinary dividends: $1,967 (reported on 23.7% of returns)
Here:
$1,967
State:
$7,410
(% of AGI for various income ranges: 2.6% for AGIs below $25k, 1.1% for AGIs $25k-50k, 1.0% for AGIs $50k-75k, 0.8% for AGIs $75k-100k, 0.4% for AGIs $100k-200k)
Net capital gain/loss in AGI: +$4,008 (reported on 15.8% of returns)
Here:
+$4,008
State:
+$11,579
(% of AGI for various income ranges: 0.7% for AGIs $25k-50k, 1.3% for AGIs $50k-75k, 1.1% for AGIs $75k-100k, 1.9% for AGIs $100k-200k)
Profit/loss from business: +$6,218 (reported on 14.5% of returns)
Here:
+$6,218
State:
+$11,688
(% of AGI for various income ranges: 6.8% for AGIs below $25k, 2.9% for AGIs $25k-50k, 2.6% for AGIs $50k-75k, 0.7% for AGIs $75k-100k)
Taxable individual retirement arrangement distribution: $12,644 (reported on 11.8% of returns)
63013:
$12,644
Missouri:
$14,773
(% of AGI for various income ranges: 7.6% for AGIs below $25k, 2.7% for AGIs $50k-75k, 8.5% for AGIs $75k-100k)
Total itemized deductions: $17,586 (19% of AGI, reported on 28.9% of returns)
Here:
$17,586
State:
$22,730
Here:
19.5% of AGI
State:
19.2% of AGI
(% of AGI for various income ranges: 7.8% for AGIs $25k-50k, 10.8% for AGIs $50k-75k, 10.7% for AGIs $75k-100k, 12.6% for AGIs $100k-200k)
Charity contributions: $2,256 (reported on 21.1% of returns)
Here:
$2,256
State:
$4,745
(% of AGI for various income ranges: 0.7% for AGIs $25k-50k, 0.8% for AGIs $50k-75k, 0.7% for AGIs $75k-100k, 1.5% for AGIs $100k-200k)
Taxes paid: $6,095 (reported on 28.9% of returns)
63013:
$6,095
State:
$8,399
(% of AGI for various income ranges: 1.7% for AGIs $25k-50k, 2.9% for AGIs $50k-75k, 3.6% for AGIs $75k-100k, 5.6% for AGIs $100k-200k)
Earned income credit: $1,945 (reported on 14.5% of returns)
Here:
$1,945
State:
$2,288
(% of AGI for various income ranges: 4.6% for AGIs below $25k, 1.2% for AGIs $25k-50k)
Percentage of individuals using paid preparers for their 2012 taxes: 65.8%
Here:
66%
State:
55%
(% for various income ranges: 53.8% for AGIs below $25k, 66.7% for AGIs $25k-50k, 73.3% for AGIs $50k-75k, 66.7% for AGIs $75k-100k, 87.5% for AGIs $100k-200k)
Averages for the 2004 tax year for zip code 63013, filed in 2005:
Average Adjusted Gross Income (AGI) in 2004: $39,885 (Individual Income Tax Returns)
Here:
$39,885
State:
$44,591
Salary/wage: $38,450 (reported on 85.9% of returns)
Here:
$38,450
State:
$38,941
(% of AGI for various income ranges: 131.7% for AGIs below $10k, 75.9% for AGIs $10k-25k, 83.8% for AGIs $25k-50k, 90.7% for AGIs $50k-75k, 79.0% for AGIs $75k-100k, 73.3% for AGIs over 100k)
Taxable interest for individuals: $851 (reported on 49.9% of returns)
This zip code:
$851
Missouri:
$1,801
(% of AGI for various income ranges: 10.0% for AGIs below $10k, 2.7% for AGIs $10k-25k, 1.4% for AGIs $25k-50k, 0.4% for AGIs $50k-75k, 0.8% for AGIs $75k-100k, 0.5% for AGIs over 100k)
Taxable dividends: $1,491 (reported on 29.5% of returns)
Here:
$1,491
State:
$3,677
(% of AGI for various income ranges: 4.5% for AGIs below $10k, 2.8% for AGIs $10k-25k, 1.0% for AGIs $25k-50k, 0.3% for AGIs $50k-75k, 1.8% for AGIs $75k-100k, 0.7% for AGIs over 100k)
Net capital gain/loss: +$1,993 (reported on 19.2% of returns)
Here:
+$1,993
State:
+$8,915
(% of AGI for various income ranges: 1.1% for AGIs below $10k, 0.5% for AGIs $10k-25k, 0.4% for AGIs $25k-50k, 0.8% for AGIs $50k-75k, 2.4% for AGIs $75k-100k, 0.7% for AGIs over 100k)
Profit/loss from business: +$5,092 (reported on 11.4% of returns)
Here:
+$5,092
State:
+$9,793
(% of AGI for various income ranges: 1.6% for AGIs $10k-25k, 2.6% for AGIs $25k-50k, 0.3% for AGIs $50k-75k, 3.4% for AGIs $75k-100k)
IRA payment deduction: $2,882 (reported on 2.2% of returns)
63013:
$2,882
Missouri:
$2,972
Total itemized deductions: $14,859 (21% of AGI, reported on 27.8% of returns)
Here:
$14,859
State:
$18,261
Here:
20.5% of AGI
State:
20.5% of AGI
(% of AGI for various income ranges: 8.9% for AGIs $10k-25k, 7.5% for AGIs $25k-50k, 10.4% for AGIs $50k-75k, 13.8% for AGIs $75k-100k, 11.8% for AGIs over 100k)
Charity contributions deductions: $2,234 (3% of AGI, reported on 22.3% of returns)
Here:
$2,234
State:
$3,665
Here:
3.0% of AGI
State:
3.9% of AGI
(% of AGI for various income ranges: 0.6% for AGIs $10k-25k, 0.7% for AGIs $25k-50k, 1.1% for AGIs $50k-75k, 1.8% for AGIs $75k-100k, 2.0% for AGIs over 100k)
Total tax: $4,616 (reported on 78.9% of returns)
63013:
$4,616
State:
$6,999
(% of AGI for various income ranges: 4.2% for AGIs below $10k, 4.5% for AGIs $10k-25k, 6.8% for AGIs $25k-50k, 7.8% for AGIs $50k-75k, 9.8% for AGIs $75k-100k, 15.8% for AGIs over 100k)
Earned income credit: $1,544 (reported on 10.3% of returns)
Here:
$1,544
State:
$1,728
Percentage of individuals using paid preparers for their 2004 taxes: 63.3%
Here:
63%
State:
62%
(% for various income ranges: 54.0% for AGIs below $10k, 61.3% for AGIs $10k-25k, 64.9% for AGIs $25k-50k, 67.1% for AGIs $50k-75k, 74.6% for AGIs $75k-100k, 69.8% for AGIs over 100k)
Household received Food Stamps/SNAP in the past 12 months: 9 Household did not receive Food Stamps/SNAP in the past 12 months: 433
Women who did not have a birth in the past 12 months: 234 (71 now married, 163 unmarried)
Housing units in zip code 63013 with a mortgage: 312 (73 second mortgage, 43 both second mortgage and home equity loan) Median monthly owner costs for units with a mortgage: $1,289 Median monthly owner costs for units without a mortgage: $511
Residents with income below the poverty level in 2022:
This zip code:
3.8%
Whole state:
13.2%
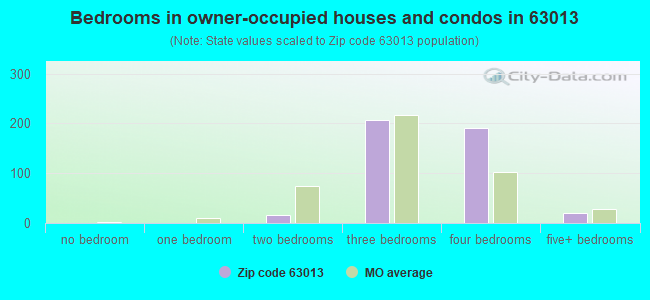
Median number of rooms in houses and condos:
Here:
6.7
State:
6.4
Notable locations in this zip code not listed on our city pages
Size of family households: 254 2-persons, 5 3-persons, 45 4-persons, 80 5-persons
Size of nonfamily households: 25 1-person, 30 2-persons
207 married couples with children.
0 single-parent households ().
97.0% of residents of 63013 zip code speak English at home.
3.7% of residents speak other Indo-European language at home (100% very well).
Foreign born population: 0 (0.0%)
:
0.0%
Whole state:
4.1%
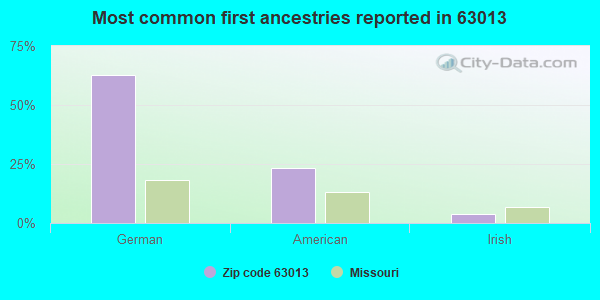
63%German
23%American
4%Irish
Facilities with environmental interests located in this zip code:
PINNACLE PETROLEUM (HWY 50 & ROUTE 185 in BEAUFORT, MO)
STATE MASTER (Missouri monitoring and compilance) - PCS-MO0123129, NPDES NON-MAJOR National Pollutant Discharge Elimination System NON-MAJOR (Tracking pollutant discharge elimination systems) - permit Business SIC classification: PETROLEUM BULK STATIONS AND TERMINALS Alternative names: BOLAND OIL COMPANY, KUHLMANN'S STATION #2
HONOLD HARDWARE COMPANY (HIGHWAY 185 in BEAUFORT, MO)
STATE MASTER (Missouri monitoring and compilance) - NCDB-I07#19961203MO-05 1, COMPLIANCE ACTIVITY COMPLIANCE ACTIVITY (Tracking inspections of insecticide, fungicide, and rodenticide, and toxic substances)
BOLAND OIL & LP (6651 HWY 185 in BEAUFORT, MO)
AIR MINOR (AIRS/AFS) Business SIC classification: PETROLEUM BULK STATIONS AND TERMINALS
Housing units lacking complete plumbing facilities: 15.3% Housing units lacking complete kitchen facilities: 4.7%
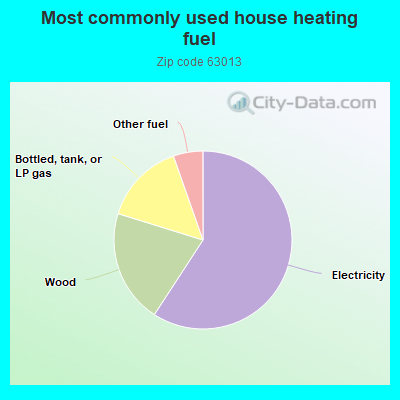
59.5%Electricity
20.7%Wood
14.9%Bottled, tank, or LP gas
5.4%Other fuel
Population in 1990: 460. Population change in the 1990s: +1,176 (+255.7%).
Place of birth for U.S.-born residents:
This state: 949
Northeast: 61
Midwest: 55
South: 126
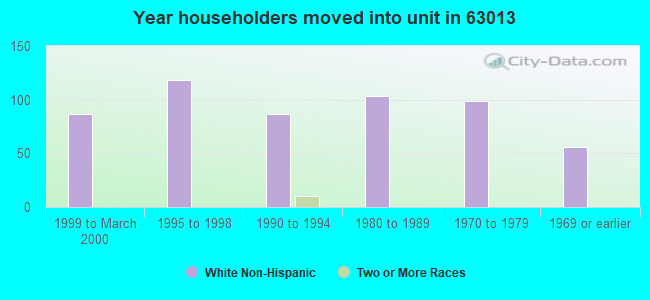
65% of the 63013 zip code residents lived in the same house 5 years ago. Out of people who lived in different houses, 75% lived in this county.
95% of the 63013 zip code residents lived in the same house 1 year ago. Out of people who lived in different houses, 21% moved from different county within same state. Out of people who lived in different houses, 89% moved from different state.
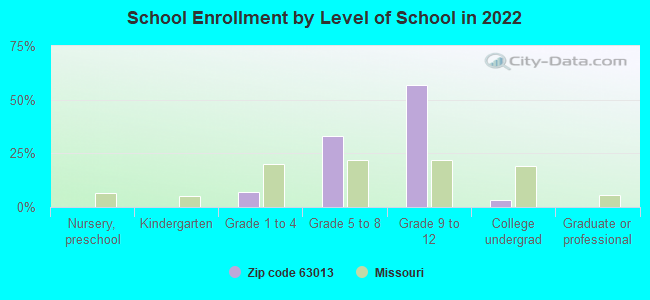
Private vs. public school enrollment:
Students in private schools in grades 1 to 8 (elementary and middle school): 28
Here:
25.2%
Missouri:
15.4%
Students in private schools in grades 9 to 12 (high school): 24
Here:
15.6%
Missouri:
13.9%
Students in private undergraduate colleges:
Here:
0.0%
Missouri:
22.6%
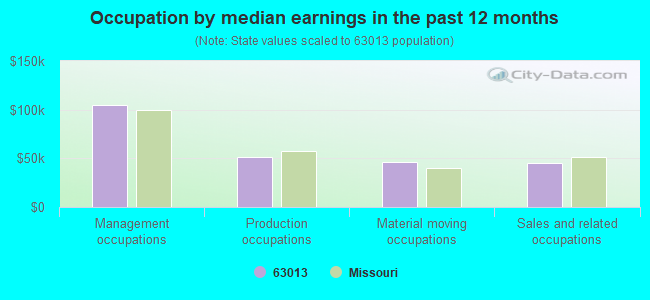
Occupation by median earnings in the past 12 months ($)
104,718Management occupations
51,740Production occupations
46,626Material moving occupations
45,295Sales and related occupations
Top industries in this zip code by the number of employees in 2005:
Construction: New Single-Family Housing Construction (except Operative Builders) (5-9 employees: 3 establishments, 1-4 employees: 2 establishments)
Construction: Plumbing, Heating, and Air-Conditioning Contractors (5-9: 2, 1-4: 2)
Professional, Scientific, and Technical Services: Other Accounting Services (10-19: 1)
Construction: Poured Concrete Foundation and Structure Contractors (5-9: 1, 1-4: 1)
Construction: Painting and Wall Covering Contractors (5-9: 1, 1-4: 1)
Construction: Electrical Contractors (5-9: 1)
Finance and Insurance: Commercial Banking (1-4: 1)
Fatal accident statistics in 2013:
Fatal accident count: 1
Vehicles involved in fatal accidents: 2
Fatal accidents caused by drunken drivers: 1
Fatalities: 1
Persons involved in fatal accidents: 8
Pedestrians involved in fatal accidents: 0
Fatal accident statistics in 2012:
Fatal accident count: 1
Vehicles involved in fatal accidents: 2
Fatal accidents caused by drunken drivers: 0
Fatalities: 1
Persons involved in fatal accidents: 2
Pedestrians involved in fatal accidents: 0
Home Mortgage Disclosure Act Aggregated Statistics For Year 2009 (Based on 4 partial tracts)
A) FHA, FSA/RHS & VA Home Purchase Loans
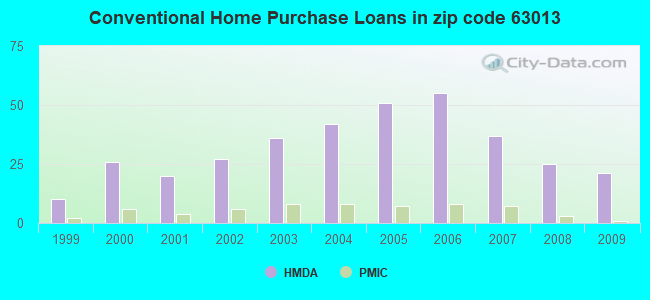
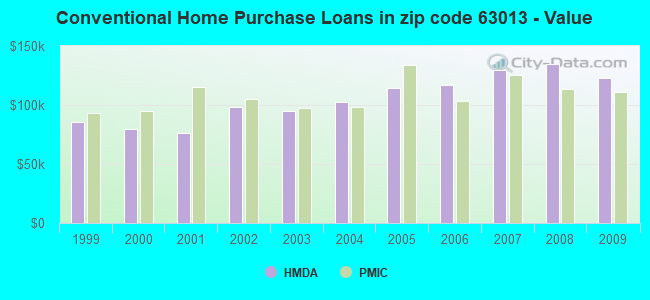
B) Conventional Home Purchase Loans
C) Refinancings
D) Home Improvement Loans
F) Non-occupant Loans on < 5 Family Dwellings (A B C & D)
G) Loans On Manufactured Home Dwelling (A B C & D)
Number
Average Value
Number
Average Value
Number
Average Value
Number
Average Value
Number
Average Value
Number
Average Value
LOANS ORIGINATED
7
$118,143
21
$123,082
119
$152,872
7
$50,033
11
$119,516
7
$68,024
APPLICATIONS APPROVED, NOT ACCEPTED
1
$105,340
2
$142,330
10
$159,196
1
$38,360
0
$0
2
$60,960
APPLICATIONS DENIED
2
$107,395
3
$115,823
33
$155,217
3
$61,463
2
$116,855
3
$70,000
APPLICATIONS WITHDRAWN
3
$102,543
1
$174,700
21
$132,964
2
$59,475
1
$130,740
1
$158,240
FILES CLOSED FOR INCOMPLETENESS
0
$0
1
$112,340
5
$150,196
0
$0
0
$0
0
$0
Aggregated Statistics For Year 2008 (Based on 4 partial tracts)
A) FHA, FSA/RHS & VA Home Purchase Loans
B) Conventional Home Purchase Loans
C) Refinancings
D) Home Improvement Loans
F) Non-occupant Loans on < 5 Family Dwellings (A B C & D)
G) Loans On Manufactured Home Dwelling (A B C & D)
Number
Average Value
Number
Average Value
Number
Average Value
Number
Average Value
Number
Average Value
Number
Average Value
LOANS ORIGINATED
9
$109,078
25
$135,136
77
$149,043
9
$53,170
15
$117,605
12
$70,872
APPLICATIONS APPROVED, NOT ACCEPTED
1
$86,650
1
$65,690
9
$167,223
0
$0
0
$0
1
$127,970
APPLICATIONS DENIED
2
$141,090
5
$131,842
37
$146,081
7
$57,116
1
$115,290
3
$80,777
APPLICATIONS WITHDRAWN
0
$0
3
$134,503
21
$153,393
1
$47,860
0
$0
1
$55,810
FILES CLOSED FOR INCOMPLETENESS
0
$0
1
$101,430
5
$200,602
1
$26,440
0
$0
0
$0
Aggregated Statistics For Year 2007 (Based on 4 partial tracts)
A) FHA, FSA/RHS & VA Home Purchase Loans
B) Conventional Home Purchase Loans
C) Refinancings
D) Home Improvement Loans
F) Non-occupant Loans on < 5 Family Dwellings (A B C & D)
G) Loans On Manufactured Home Dwelling (A B C & D)
Number
Average Value
Number
Average Value
Number
Average Value
Number
Average Value
Number
Average Value
Number
Average Value
LOANS ORIGINATED
4
$133,565
37
$129,598
87
$131,557
17
$48,136
12
$120,062
17
$71,132
APPLICATIONS APPROVED, NOT ACCEPTED
0
$0
6
$111,875
14
$122,391
2
$64,095
2
$75,065
2
$106,210
APPLICATIONS DENIED
2
$115,135
10
$97,992
53
$143,207
7
$69,234
2
$82,730
7
$65,303
APPLICATIONS WITHDRAWN
1
$131,890
4
$103,375
27
$135,564
2
$72,650
0
$0
3
$81,453
FILES CLOSED FOR INCOMPLETENESS
0
$0
1
$97,930
10
$134,095
0
$0
0
$0
0
$0
Aggregated Statistics For Year 2006 (Based on 4 partial tracts)
A) FHA, FSA/RHS & VA Home Purchase Loans
B) Conventional Home Purchase Loans
C) Refinancings
D) Home Improvement Loans
F) Non-occupant Loans on < 5 Family Dwellings (A B C & D)
G) Loans On Manufactured Home Dwelling (A B C & D)
Number
Average Value
Number
Average Value
Number
Average Value
Number
Average Value
Number
Average Value
Number
Average Value
LOANS ORIGINATED
6
$110,583
55
$116,854
96
$115,699
20
$44,928
15
$92,653
20
$72,328
APPLICATIONS APPROVED, NOT ACCEPTED
1
$91,870
6
$111,812
14
$117,196
3
$74,823
0
$0
3
$83,457
APPLICATIONS DENIED
2
$105,885
15
$92,383
53
$115,062
9
$30,951
2
$101,520
9
$73,614
APPLICATIONS WITHDRAWN
1
$140,540
6
$129,560
37
$120,206
6
$85,777
1
$73,550
1
$47,680
FILES CLOSED FOR INCOMPLETENESS
0
$0
1
$113,930
9
$142,771
1
$32,180
0
$0
0
$0
Aggregated Statistics For Year 2005 (Based on 4 partial tracts)
A) FHA, FSA/RHS & VA Home Purchase Loans
B) Conventional Home Purchase Loans
C) Refinancings
D) Home Improvement Loans
F) Non-occupant Loans on < 5 Family Dwellings (A B C & D)
G) Loans On Manufactured Home Dwelling (A B C & D)
Number
Average Value
Number
Average Value
Number
Average Value
Number
Average Value
Number
Average Value
Number
Average Value
LOANS ORIGINATED
4
$128,705
51
$114,580
102
$123,368
12
$43,342
15
$124,239
17
$63,460
APPLICATIONS APPROVED, NOT ACCEPTED
0
$0
9
$83,009
19
$106,633
2
$28,360
1
$107,080
2
$112,265
APPLICATIONS DENIED
3
$94,567
14
$87,058
59
$122,221
11
$21,970
2
$96,730
14
$76,181
APPLICATIONS WITHDRAWN
0
$0
5
$112,280
49
$129,597
5
$99,978
1
$98,370
5
$59,928
FILES CLOSED FOR INCOMPLETENESS
0
$0
3
$95,040
7
$147,556
0
$0
0
$0
0
$0
Aggregated Statistics For Year 2004 (Based on 4 partial tracts)
A) FHA, FSA/RHS & VA Home Purchase Loans
B) Conventional Home Purchase Loans
C) Refinancings
D) Home Improvement Loans
F) Non-occupant Loans on < 5 Family Dwellings (A B C & D)
G) Loans On Manufactured Home Dwelling (A B C & D)
Number
Average Value
Number
Average Value
Number
Average Value
Number
Average Value
Number
Average Value
Number
Average Value
LOANS ORIGINATED
3
$102,307
42
$102,743
107
$126,465
8
$42,476
11
$83,544
11
$62,923
APPLICATIONS APPROVED, NOT ACCEPTED
0
$0
8
$108,250
22
$132,818
1
$51,910
0
$0
3
$55,093
APPLICATIONS DENIED
1
$120,030
12
$80,525
61
$104,689
8
$40,241
2
$87,665
11
$69,207
APPLICATIONS WITHDRAWN
1
$92,400
5
$126,898
44
$106,973
1
$77,760
1
$104,250
3
$73,723
FILES CLOSED FOR INCOMPLETENESS
0
$0
2
$116,440
5
$123,752
0
$0
0
$0
0
$0
Aggregated Statistics For Year 2003 (Based on 4 partial tracts)
A) FHA, FSA/RHS & VA Home Purchase Loans
B) Conventional Home Purchase Loans
C) Refinancings
D) Home Improvement Loans
F) Non-occupant Loans on < 5 Family Dwellings (A B C & D)
Number
Average Value
Number
Average Value
Number
Average Value
Number
Average Value
Number
Average Value
LOANS ORIGINATED
3
$92,610
36
$94,597
216
$108,743
13
$27,688
12
$72,220
APPLICATIONS APPROVED, NOT ACCEPTED
0
$0
6
$113,067
27
$103,959
2
$33,250
1
$128,860
APPLICATIONS DENIED
2
$57,635
13
$75,576
51
$106,330
6
$31,817
2
$78,355
APPLICATIONS WITHDRAWN
0
$0
4
$87,055
38
$116,176
1
$59,980
2
$119,270
FILES CLOSED FOR INCOMPLETENESS
0
$0
1
$117,440
6
$118,443
0
$0
0
$0
Aggregated Statistics For Year 2002 (Based on 2 partial tracts)
A) FHA, FSA/RHS & VA Home Purchase Loans
B) Conventional Home Purchase Loans
C) Refinancings
D) Home Improvement Loans
F) Non-occupant Loans on < 5 Family Dwellings (A B C & D)
Number
Average Value
Number
Average Value
Number
Average Value
Number
Average Value
Number
Average Value
LOANS ORIGINATED
4
$95,030
27
$98,620
85
$96,547
10
$35,157
7
$64,271
APPLICATIONS APPROVED, NOT ACCEPTED
0
$0
3
$85,220
15
$99,804
1
$63,310
0
$0
APPLICATIONS DENIED
1
$86,210
11
$48,174
24
$81,493
1
$11,580
2
$54,420
APPLICATIONS WITHDRAWN
1
$39,870
3
$102,910
16
$99,746
0
$0
0
$0
FILES CLOSED FOR INCOMPLETENESS
0
$0
0
$0
3
$103,540
0
$0
0
$0
Aggregated Statistics For Year 2001 (Based on 2 partial tracts)
A) FHA, FSA/RHS & VA Home Purchase Loans
B) Conventional Home Purchase Loans
C) Refinancings
D) Home Improvement Loans
F) Non-occupant Loans on < 5 Family Dwellings (A B C & D)
Number
Average Value
Number
Average Value
Number
Average Value
Number
Average Value
Number
Average Value
LOANS ORIGINATED
4
$71,525
20
$76,200
65
$92,931
8
$23,909
5
$41,434
APPLICATIONS APPROVED, NOT ACCEPTED
0
$0
4
$91,462
8
$81,122
1
$16,160
0
$0
APPLICATIONS DENIED
1
$64,120
13
$77,753
23
$74,671
6
$22,765
2
$20,070
APPLICATIONS WITHDRAWN
0
$0
3
$110,093
14
$83,264
1
$26,130
0
$0
FILES CLOSED FOR INCOMPLETENESS
0
$0
0
$0
2
$82,570
0
$0
0
$0
Aggregated Statistics For Year 2000 (Based on 2 partial tracts)
A) FHA, FSA/RHS & VA Home Purchase Loans
B) Conventional Home Purchase Loans
C) Refinancings
D) Home Improvement Loans
F) Non-occupant Loans on < 5 Family Dwellings (A B C & D)
Number
Average Value
Number
Average Value
Number
Average Value
Number
Average Value
Number
Average Value
LOANS ORIGINATED
3
$71,210
26
$79,867
29
$74,271
11
$23,560
5
$60,076
APPLICATIONS APPROVED, NOT ACCEPTED
0
$0
3
$38,703
6
$73,322
2
$12,125
0
$0
APPLICATIONS DENIED
1
$56,840
14
$66,792
20
$66,474
5
$14,602
2
$45,530
APPLICATIONS WITHDRAWN
1
$22,360
2
$78,260
9
$87,794
0
$0
0
$0
FILES CLOSED FOR INCOMPLETENESS
0
$0
0
$0
2
$82,030
1
$25,050
0
$0
Aggregated Statistics For Year 1999 (Based on 1 partial tract)
A) FHA, FSA/RHS & VA Home Purchase Loans
B) Conventional Home Purchase Loans
C) Refinancings
D) Home Improvement Loans
F) Non-occupant Loans on < 5 Family Dwellings (A B C & D)
Detailed PMIC statistics for the following Tracts:8004.02
, 8005.00
2002 - 2018 National Fire Incident Reporting System (NFIRS) incidents
Based on the data from the years 2002 - 2018 the average number of fires per year is 12. The highest number of reported fire incidents - 18 took place in 2010, and the least - 4 in 2004. The data has a dropping trend.
When looking into fire subcategories, the most reports belonged to: Outside Fires (45.7%), and Structure Fires (40.1%).
Fire incident types reported to NFIRS in Zip Code 63013


 Nearest zip codes: 63056, 63037, 63084, 63090, 63079, 63068.
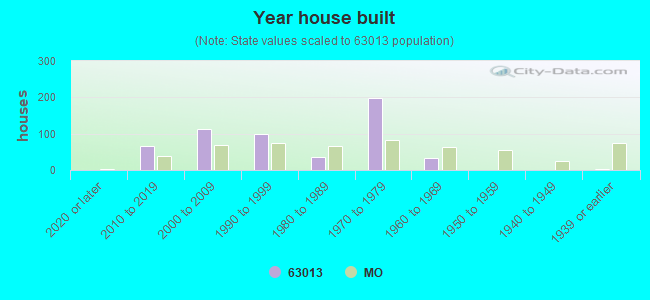


 Based on the data from the years 2002 - 2018 the average number of fires per year is 12. The highest number of reported fire incidents - 18 took place in 2010, and the least - 4 in 2004. The data has a dropping trend.
 When looking into fire subcategories, the most reports belonged to: Outside Fires (45.7%), and Structure Fires (40.1%).