Estimated zip code population in 2022: 20,359 Zip code population in 2010: 20,714 Zip code population in 2000: 20,238
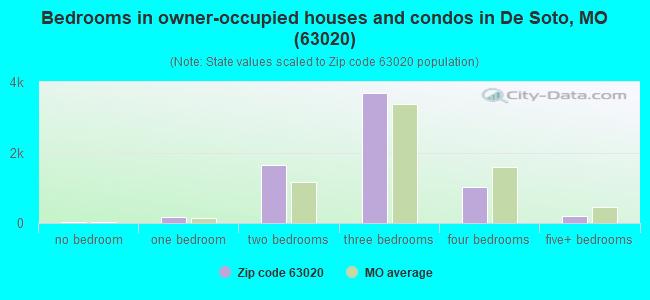
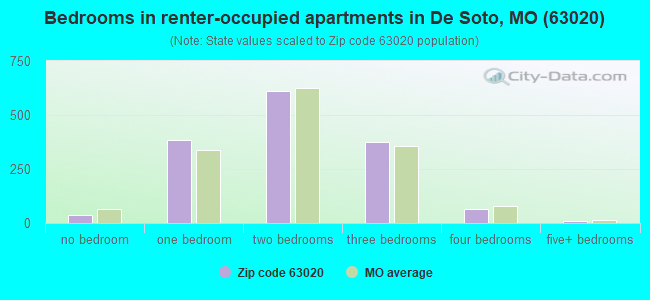
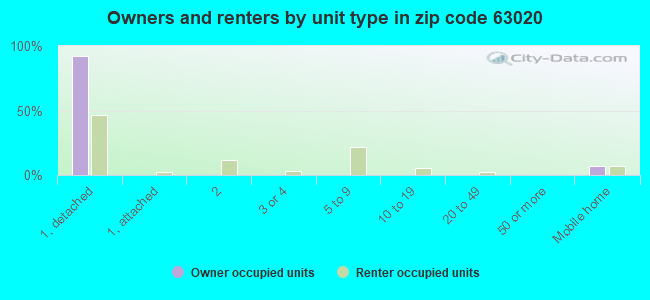
Houses and condos: 9,006 Renter-occupied apartments: 1,481
% of renters here:
18%
State:
32%
March 2022 cost of living index in zip code 63020: 85.8 (less than average, U.S. average is 100)
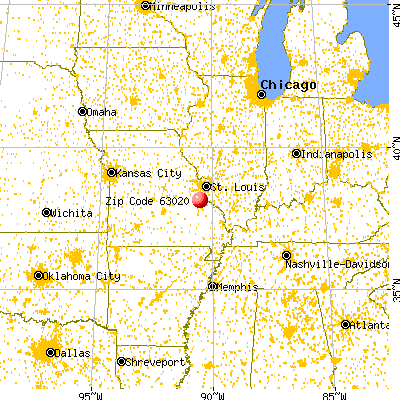
Land area: 141.5 sq. mi. Water area: 0.6 sq. mi.
Population density: 144 people per square mile
(very low).
OSM Map
General Map
Google Map
MSN Map
OSM Map
General Map
Google Map
MSN Map
OSM Map
General Map
Google Map
MSN Map
OSM Map
General Map
Google Map
MSN Map
Please wait while loading the map...
Real estate property taxes paid for housing units in 2022:
This zip code:
0.8% ($1,458)
Missouri:
0.8% ($1,810)
Median real estate property taxes paid for housing units with mortgages in 2022: $1,445 (0.8%) Median real estate property taxes paid for housing units with no mortgage in 2022: $1,490 (0.8%)
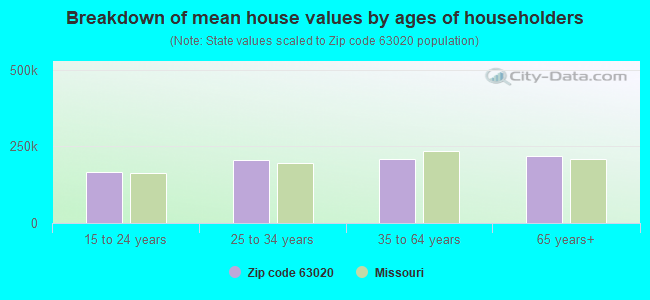
Estimated median house/condo value in 2022: $184,038
63020:
$184,038
Missouri:
$221,200
According to our research of Missouri and other state lists, there were 74 registered sex offenders living in 63020 zip code as of April 27, 2024. The ratio of all residents to sex offenders in zip code 63020 is 283 to 1. The ratio of registered sex offenders to all residents in this zip code is near the state average.
Median resident age:
This zip code:
44.4 years
Missouri median age:
39.1 years
Average household size:
This zip code:
2.4 people
Missouri:
2.4 people
Averages for the 2020 tax year for zip code 63020, filed in 2021:
Average Adjusted Gross Income (AGI) in 2020: $51,778 (Individual Income Tax Returns)
Here:
$51,778
State:
$68,151
Salary/wage: $47,955 (reported on 80.8% of returns)
Here:
$47,955
State:
$56,131
(% of AGI for various income ranges: 1175.7% for AGIs below $25k, 3342.5% for AGIs $25k-50k, 6071.2% for AGIs $50k-75k, 9236.8% for AGIs $75k-100k, 16166.0% for AGIs $100k-200k, 58837.5% for AGIs over 200k)
Taxable interest for individuals: $935 (reported on 26.1% of returns)
This zip code:
$935
Missouri:
$1,586
(% of AGI for various income ranges: 15.7% for AGIs below $25k, 22.8% for AGIs $25k-50k, 33.7% for AGIs $50k-75k, 31.1% for AGIs $75k-100k, 81.9% for AGIs $100k-200k, 775.0% for AGIs over 200k)
Ordinary dividends: $2,549 (reported on 13.3% of returns)
Here:
$2,549
State:
$10,947
(% of AGI for various income ranges: 15.9% for AGIs below $25k, 18.1% for AGIs $25k-50k, 29.1% for AGIs $50k-75k, 62.0% for AGIs $75k-100k, 153.1% for AGIs $100k-200k, 1605.0% for AGIs over 200k)
Net capital gain/loss in AGI: +$4,952 (reported on 11.1% of returns)
Here:
+$4,952
State:
+$18,453
(% of AGI for various income ranges: 6.2% for AGIs below $25k, 25.9% for AGIs $25k-50k, 42.4% for AGIs $50k-75k, 53.5% for AGIs $75k-100k, 438.9% for AGIs $100k-200k, 1590.0% for AGIs over 200k)
Profit/loss from business: +$8,134 (reported on 11.3% of returns)
Here:
+$8,134
State:
+$12,260
(% of AGI for various income ranges: 86.7% for AGIs below $25k, 104.2% for AGIs $25k-50k, 122.1% for AGIs $50k-75k, 196.4% for AGIs $75k-100k, 252.6% for AGIs $100k-200k, 190.0% for AGIs over 200k)
Taxable individual retirement arrangement distribution: $12,911 (reported on 7.9% of returns)
63020:
$12,911
Missouri:
$19,719
(% of AGI for various income ranges: 47.5% for AGIs below $25k, 81.8% for AGIs $25k-50k, 142.9% for AGIs $50k-75k, 248.2% for AGIs $75k-100k, 495.3% for AGIs $100k-200k)
Total itemized deductions: $29,646 (reported on 2.9% of returns)
Here:
$29,646
State:
$36,651
(% of AGI for various income ranges: 24.3% for AGIs below $25k, 44.1% for AGIs $25k-50k, 118.9% for AGIs $50k-75k, 163.5% for AGIs $75k-100k, 382.9% for AGIs $100k-200k, 3980.0% for AGIs over 200k)
Charity contributions: $9,429 (reported on 2.2% of returns)
Here:
$9,429
State:
$15,671
(% of AGI for various income ranges: 6.1% for AGIs $25k-50k, 15.6% for AGIs $50k-75k, 27.7% for AGIs $75k-100k, 124.6% for AGIs $100k-200k, 1505.0% for AGIs over 200k)
Taxes paid: $6,393 (reported on 2.9% of returns)
63020:
$6,393
State:
$7,608
(% of AGI for various income ranges: 1.8% for AGIs below $25k, 4.9% for AGIs $25k-50k, 21.3% for AGIs $50k-75k, 50.8% for AGIs $75k-100k, 101.3% for AGIs $100k-200k, 797.5% for AGIs over 200k)
Earned income credit: $2,209 (reported on 16.7% of returns)
Here:
$2,209
State:
$2,315
(% of AGI for various income ranges: 90.4% for AGIs below $25k, 70.5% for AGIs $25k-50k, 1.8% for AGIs $50k-75k)
Percentage of individuals using paid preparers for their 2020 taxes: 94.4%
Here:
94%
State:
93%
(% for various income ranges: 93.4% for AGIs below $25k, 95.0% for AGIs $25k-50k, 94.7% for AGIs $50k-75k, 96.1% for AGIs $75k-100k, 95.5% for AGIs $100k-200k, 83.3% for AGIs over 200k)
Averages for the 2012 tax year for zip code 63020, filed in 2013:
Average Adjusted Gross Income (AGI) in 2012: $42,535 (Individual Income Tax Returns)
Here:
$42,535
State:
$55,896
Salary/wage: $38,459 (reported on 83.6% of returns)
Here:
$38,459
State:
$46,205
(% of AGI for various income ranges: 69.7% for AGIs below $25k, 75.2% for AGIs $25k-50k, 79.7% for AGIs $50k-75k, 80.5% for AGIs $75k-100k, 78.2% for AGIs $100k-200k, 48.8% for AGIs over 200k)
Taxable interest for individuals: $953 (reported on 28.7% of returns)
This zip code:
$953
Missouri:
$1,559
(% of AGI for various income ranges: 1.3% for AGIs below $25k, 0.4% for AGIs $25k-50k, 0.4% for AGIs $50k-75k, 0.4% for AGIs $75k-100k, 0.5% for AGIs $100k-200k, 2.0% for AGIs over 200k)
Ordinary dividends: $2,168 (reported on 14.9% of returns)
Here:
$2,168
State:
$7,410
(% of AGI for various income ranges: 1.0% for AGIs below $25k, 0.5% for AGIs $25k-50k, 0.5% for AGIs $50k-75k, 0.6% for AGIs $75k-100k, 0.6% for AGIs $100k-200k, 3.4% for AGIs over 200k)
Net capital gain/loss in AGI: +$3,378 (reported on 10.8% of returns)
Here:
+$3,378
State:
+$11,579
(% of AGI for various income ranges: 0.2% for AGIs $25k-50k, 0.3% for AGIs $50k-75k, 0.6% for AGIs $75k-100k, 1.0% for AGIs $100k-200k, 8.0% for AGIs over 200k)
Profit/loss from business: +$6,950 (reported on 12.5% of returns)
Here:
+$6,950
State:
+$11,688
(% of AGI for various income ranges: 5.7% for AGIs below $25k, 2.6% for AGIs $25k-50k, 1.5% for AGIs $50k-75k, 0.8% for AGIs $75k-100k, 1.5% for AGIs $100k-200k)
Taxable individual retirement arrangement distribution: $11,305 (reported on 8.9% of returns)
63020:
$11,305
Missouri:
$14,773
(% of AGI for various income ranges: 2.7% for AGIs below $25k, 2.0% for AGIs $25k-50k, 2.1% for AGIs $50k-75k, 1.9% for AGIs $75k-100k, 4.3% for AGIs $100k-200k)
Total itemized deductions: $17,399 (22% of AGI, reported on 24.4% of returns)
Here:
$17,399
State:
$22,730
Here:
22.1% of AGI
State:
19.2% of AGI
(% of AGI for various income ranges: 5.7% for AGIs below $25k, 7.5% for AGIs $25k-50k, 10.2% for AGIs $50k-75k, 11.9% for AGIs $75k-100k, 13.1% for AGIs $100k-200k, 11.1% for AGIs over 200k)
Charity contributions: $2,820 (reported on 15.9% of returns)
Here:
$2,820
State:
$4,745
(% of AGI for various income ranges: 0.4% for AGIs below $25k, 0.6% for AGIs $25k-50k, 1.0% for AGIs $50k-75k, 1.1% for AGIs $75k-100k, 1.7% for AGIs $100k-200k, 2.0% for AGIs over 200k)
Taxes paid: $5,216 (reported on 24.4% of returns)
63020:
$5,216
State:
$8,399
(% of AGI for various income ranges: 0.9% for AGIs below $25k, 1.6% for AGIs $25k-50k, 2.6% for AGIs $50k-75k, 3.8% for AGIs $75k-100k, 5.0% for AGIs $100k-200k, 5.2% for AGIs over 200k)
Earned income credit: $2,257 (reported on 21.2% of returns)
Here:
$2,257
State:
$2,288
(% of AGI for various income ranges: 6.9% for AGIs below $25k, 1.3% for AGIs $25k-50k)
Percentage of individuals using paid preparers for their 2012 taxes: 60.8%
Here:
61%
State:
55%
(% for various income ranges: 57.5% for AGIs below $25k, 60.1% for AGIs $25k-50k, 64.7% for AGIs $50k-75k, 65.5% for AGIs $75k-100k, 66.0% for AGIs $100k-200k, 83.3% for AGIs over 200k)
Averages for the 2004 tax year for zip code 63020, filed in 2005:
Average Adjusted Gross Income (AGI) in 2004: $36,854 (Individual Income Tax Returns)
Here:
$36,854
State:
$44,591
Salary/wage: $34,330 (reported on 87.2% of returns)
Here:
$34,330
State:
$38,941
(% of AGI for various income ranges: 88.1% for AGIs below $10k, 73.6% for AGIs $10k-25k, 82.4% for AGIs $25k-50k, 86.1% for AGIs $50k-75k, 85.6% for AGIs $75k-100k, 69.8% for AGIs over 100k)
Taxable interest for individuals: $1,127 (reported on 40.5% of returns)
This zip code:
$1,127
Missouri:
$1,801
(% of AGI for various income ranges: 3.3% for AGIs below $10k, 2.4% for AGIs $10k-25k, 1.1% for AGIs $25k-50k, 0.7% for AGIs $50k-75k, 0.8% for AGIs $75k-100k, 1.8% for AGIs over 100k)
Taxable dividends: $1,678 (reported on 17.1% of returns)
Here:
$1,678
State:
$3,677
(% of AGI for various income ranges: 1.9% for AGIs below $10k, 0.9% for AGIs $10k-25k, 0.6% for AGIs $25k-50k, 0.5% for AGIs $50k-75k, 0.4% for AGIs $75k-100k, 1.8% for AGIs over 100k)
Net capital gain/loss: +$4,220 (reported on 11.8% of returns)
Here:
+$4,220
State:
+$8,915
(% of AGI for various income ranges: 0.2% for AGIs below $10k, 0.2% for AGIs $10k-25k, 0.4% for AGIs $25k-50k, 0.8% for AGIs $50k-75k, 1.1% for AGIs $75k-100k, 5.5% for AGIs over 100k)
Profit/loss from business: +$6,040 (reported on 12.8% of returns)
Here:
+$6,040
State:
+$9,793
(% of AGI for various income ranges: 0.4% for AGIs below $10k, 4.7% for AGIs $10k-25k, 2.4% for AGIs $25k-50k, 1.7% for AGIs $50k-75k, 0.8% for AGIs $75k-100k, 2.2% for AGIs over 100k)
IRA payment deduction: $2,745 (reported on 1.9% of returns)
63020:
$2,745
Missouri:
$2,972
(% of AGI for various income ranges: 0.2% for AGIs $10k-25k, 0.2% for AGIs $25k-50k, 0.1% for AGIs $50k-75k, 0.2% for AGIs $75k-100k, 0.1% for AGIs over 100k)
Self-employed pension: $3,846 (reported on 0.2% of returns)
Here:
$3,846
Missouri:
$14,365
Total itemized deductions: $14,169 (21% of AGI, reported on 26.8% of returns)
Here:
$14,169
State:
$18,261
Here:
21.5% of AGI
State:
20.5% of AGI
(% of AGI for various income ranges: 5.6% for AGIs below $10k, 6.2% for AGIs $10k-25k, 8.6% for AGIs $25k-50k, 11.2% for AGIs $50k-75k, 12.4% for AGIs $75k-100k, 13.2% for AGIs over 100k)
Charity contributions deductions: $2,200 (3% of AGI, reported on 20.6% of returns)
Here:
$2,200
State:
$3,665
Here:
3.1% of AGI
State:
3.9% of AGI
(% of AGI for various income ranges: 0.3% for AGIs below $10k, 0.5% for AGIs $10k-25k, 0.9% for AGIs $25k-50k, 1.2% for AGIs $50k-75k, 1.5% for AGIs $75k-100k, 2.2% for AGIs over 100k)
Total tax: $4,330 (reported on 73.0% of returns)
63020:
$4,330
State:
$6,999
(% of AGI for various income ranges: 2.2% for AGIs below $10k, 3.9% for AGIs $10k-25k, 6.3% for AGIs $25k-50k, 8.3% for AGIs $50k-75k, 10.1% for AGIs $75k-100k, 16.0% for AGIs over 100k)
Earned income credit: $1,687 (reported on 16.6% of returns)
Here:
$1,687
State:
$1,728
Percentage of individuals using paid preparers for their 2004 taxes: 66.2%
Here:
66%
State:
62%
(% for various income ranges: 57.4% for AGIs below $10k, 67.6% for AGIs $10k-25k, 67.9% for AGIs $25k-50k, 69.5% for AGIs $50k-75k, 69.9% for AGIs $75k-100k, 72.7% for AGIs over 100k)
Likely homosexual households (counted as self-reported same-sex unmarried-partner households)
Lesbian couples: 0.2% of all households
Gay men: 0.0% of all households
Household received Food Stamps/SNAP in the past 12 months: 916 Household did not receive Food Stamps/SNAP in the past 12 months: 7,339
Women who had a birth in the past 12 months: 213 (137 now married, 76 unmarried) Women who did not have a birth in the past 12 months: 3,872 (1,574 now married, 2,299 unmarried)
Housing units in zip code 63020 with a mortgage: 3,925 (200 second mortgage, 161 both second mortgage and home equity loan) Houses without a mortgage: 96
Median monthly owner costs for units with a mortgage: $1,209 Median monthly owner costs for units without a mortgage: $439
Residents with income below the poverty level in 2022:
This zip code:
11.1%
Whole state:
13.2%
Residents with income below 50% of the poverty level in 2022:
This zip code:
6.3%
Whole state:
6.8%
Median number of rooms in houses and condos:
Here:
6.0
State:
6.4
Median number of rooms in apartments:
Here:
4.4
State:
4.4
Notable locations in this zip code not listed on our city pages
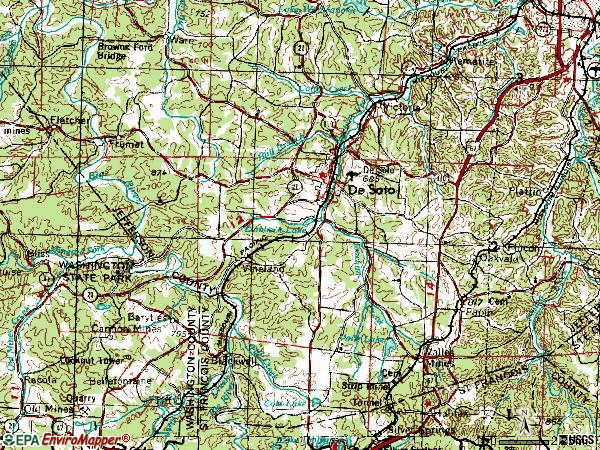
Notable locations in zip code 63020: McMullen School (A), Camp Ne-O-Tez (B), DeSoto Wastewater Treatment Plant (C), City of De Soto Fire and Rescue Station 1 Headquarters (D), De Soto Rural Fire Protection District Station 1 Headquarters (E), De Soto Rural Fire Protection District Station 4 (F), De Soto Rural Fire Protection District Station 5 (G), City of De Soto Fire and Rescue Station 2 (H), De Soto Rural Fire Protection District Station 2 (I), De Soto Rural Fire Protection District Station 3 (J). Display/hide their locations on the map
Churches in zip code 63020 include: Oakland Church (A), German Church (B), Mount Olive Church (C), Pentecostal Church (D), Redeemer Church (E), Lone Pilgrim Church (F), Valley View Church (G), DeSoto Community Church of God (H). Display/hide their locations on the map
Cemeteries: Politte Cemetery (1), Hope United Church of Christ Ebenezer Cemetery (2), Joachim Cemetery (3), Maness Cemetery (4), McCain Cemetery (5), Oakland Cemetery (6), Moontown Cemetery (7). Display/hide their locations on the map
Reservoirs: Lake Siesta (A), Big Carp Lake (B), Big Lake (C), Small Lake (D), Sunrise Lake (E), Clear Lake (F), Summerset Lake (G), Fishermans Lake (H). Display/hide their locations on the map
Streams, rivers, and creeks: Gus Creek (A), Fletcher Branch (B), Carson Creek (C), Parker Creek (D), Mammoth Creek (E), Cotter Creek (F), Tanyard Branch (G), Tiff Creek (H), Boyd Branch (I). Display/hide their locations on the map
Parks in zip code 63020 include: Walther Park (1), Joachim Park (2), Ritcher Park (3), Spross Park (4), Washington State Park (5). Display/hide their locations on the map
2,481 married couples with children.
1,507 single-parent households (320 men, 1,187 women).
97.8% of residents of 63020 zip code speak English at home.
1.2% of residents speak Spanish at home (58% very well, 23% well, 13% not well, 6% not at all).
0.7% of residents speak other Indo-European language at home (38% very well, 56% well, 7% not well).
0.3% of residents speak Asian or Pacific Island language at home (73% very well, 27% not well).
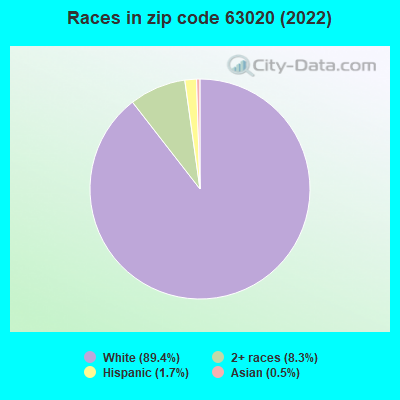
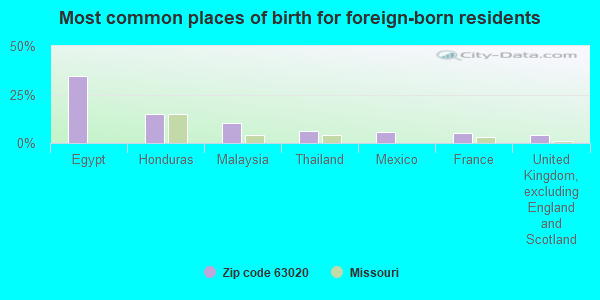
Foreign born population: 353 (1.7%) (77.4% of them are naturalized citizens)
This zip code:
1.7%
Whole state:
4.1%
34%Egypt
15%Honduras
10%Malaysia
6%Thailand
6%Mexico
5%France
4%United Kingdom, excluding England and Scotland
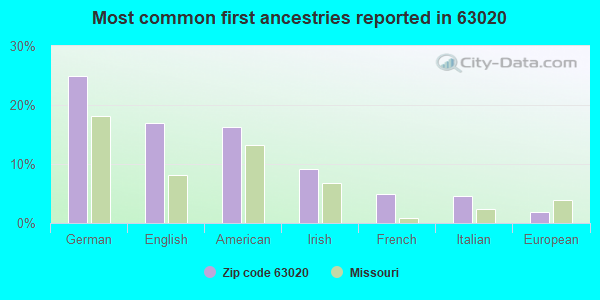
25%German
17%English
16%American
9%Irish
5%French
5%Italian
2%European
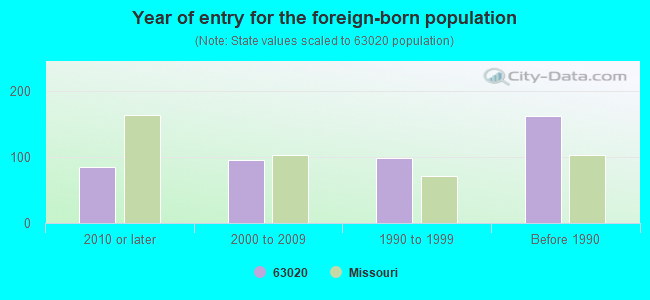
Year of entry for the foreign-born population
852010 or later
962000 to 2009
991990 to 1999
162Before 1990
Major facilities with environmental interests located in this zip code:
ATHENA ELEM SEWAGE PLANT (3775 ATHENA SCHOOL ROAD in DESOTO, MO)
STATE MASTER (Missouri monitoring and compilance) - PCS-MO0086517, NPDES NON-MAJOR (National Center for Education Statistics) - STATE ID-4010050014 National Pollutant Discharge Elimination System NON-MAJOR (Tracking pollutant discharge elimination systems) - permit Business SIC classification: ELEMENTARY AND SECONDARY SCHOOLS Organizations: DESOTO SCHOOL DISTRICT (CONTACT/OWNER)
, DESOTO 73 (SCHOOL DISTRICT)
Alternative names: ATHENA ELEMENTARY, DESOTO SCHOOL DIST #73
ARCH JOHNSTON PAVING COMPANY (12520 STATE ROUTE 21 in DESOTO, MO)
AIR MINOR (AIRS/AFS) STATE MASTER (Missouri monitoring and compilance) - PCS-MOG490782, NPDES NON-MAJOR, AIRS/AFS-MO1015782, AIR MINOR CRITERIA AND HAZARDOUS AIR POLLUTANT INVENTORY (Inventory of air pollution sources) National Pollutant Discharge Elimination System NON-MAJOR (Tracking pollutant discharge elimination systems) - permit Business SIC classification: CRUSHED AND BROKEN LIMESTONE; CRUSHED AND BROKEN STONE Alternative names: ARCH JOHNSTON PAVE/QUARRY, ARCH JOHNSTON PAVING & QR, ARCH JOHNSTON PAVING & QUARRY, ARCH JOHNSTON PAVING & QUARRY CO INC-DESOTO PLANT
CITY OF DESOTO WWTF (17 BOYD STREET in DE SOTO, MO)
(Integrated Compliance Information System) - ICIS-07-1999-0313, FORMAL ENFORCEMENT ACTION STATE MASTER (Missouri monitoring and compilance) - ICIS-8180, ENFORCEMENT/COMPLIANCE ACTIVITY
PLAZA DRY CLEANERS DESOTO (402 NORTH MAIN STREET in DESOTO, MO)
AIR MINOR (AIRS/AFS) STATE MASTER (Missouri monitoring and compilance) - AIRS/AFS-MO0953998, AIR MINOR, RCRAINFO-MOD029743457, CESQG, NEI-NTI34409, AIR PROGRAM, NTI-NTI34409, CRITERIA AND HAZARDOUS AIR POLLUTANT INVENTORY (Inventory of air pollution sources) Conditionally Exempt Small Quantity Generators, less than 100 kg/month of hazardous waste (Resource Conservation and Recovery Act (tracking hazardous waste)) Business SIC classification: DRYCLEANING PLANTS, EXCEPT RUG CLEANING Business NAICS classification: DRYCLEANING AND LAUNDRY SERVICES (EXCEPT COIN-OPERATED). Organizations: FORTNER, ROBBY D (CONTACT/OWNER)
CITY OF DESOTO WASTEWATER TREATMENT PLANT (5911 HIGHWAY P in DESOTO, MO)
STATE MASTER (Missouri monitoring and compilance) - PCS-MO0026662, NPDES MAJOR, RCRAINFO-MOP000029678, NOT IN A UNIVERSE National Pollutant Discharge Elimination System MAJOR (Tracking pollutant discharge elimination systems) - permit (Resource Conservation and Recovery Act (tracking hazardous waste)) Business SIC classification: SEWERAGE SYSTEMS Organizations: DE SOTO, CITY OF (CONTACT/OWNER)
Alternative names: city of DESOTO wwtp, DE SOTO WWTP, DESOTO WASTEWATER TREATMENT PLT
A B Z INC (1 PENALJO DR in DESOTO, MO)
STATE MASTER (Missouri monitoring and compilance) - RCRAINFO-MO0001014448, SQG (Resource Conservation and Recovery Act (tracking hazardous waste)) Business NAICS classification: PLASTICS MATERIAL AND RESIN MANUFACTURING. Organizations: A ZUBI (CONTACT/OPERATOR)
, ABDULAH ZUBI (CONTACT/OWNER)
ARNOLD READY MIX CORP (1508 CLARK STREET in DE SOTO, MO)
STATE MASTER (Missouri monitoring and compilance) - PCS-MOG490618, NPDES NON-MAJOR National Pollutant Discharge Elimination System NON-MAJOR (Tracking pollutant discharge elimination systems) - permit Business SIC classification: CRUSHED AND BROKEN LIMESTONE; READY-MIXED CONCRETE Alternative names: ARNOLD READY MIX CORP-DES
BAISCH NURSING CENTER (3260 BAISCH DRIVE in DESOTO, MO)
STATE MASTER (Missouri monitoring and compilance) - PCS-MO0090531, NPDES NON-MAJOR National Pollutant Discharge Elimination System NON-MAJOR (Tracking pollutant discharge elimination systems) - permit COMMUNITY WATER SYSTEM (SDWIS) Business SIC classification: SEWERAGE SYSTEMS Organizations: BAISCH CORPORATION (CONTACT/OWNER)
Alternative names: BAISCH CORPORATION, BAISCH NURSING HOME
BRIARWOOD ESTATES DRUM SITE (GREENBRIER & HUNTINGTON in DESOTO, MO) . Federal Facility
STATE MASTER (Missouri monitoring and compilance) - CERCLIS-MON000704433, SUPERFUND, RCRAINFO-MOP000507848, NOT IN A UNIVERSE (Resource Conservation and Recovery Act (tracking hazardous waste)) Organizations: US EPA REGION 7 (CONTACT/OPERATOR)
AL WALKER (12991 HWY 21 in DE SOTO, MO)
STATE MASTER (Missouri monitoring and compilance) - PCS-MO0119237, NPDES NON-MAJOR National Pollutant Discharge Elimination System NON-MAJOR (Tracking pollutant discharge elimination systems) - permit Business SIC classification: CARWASHES Alternative names: WALKER CAR WASH
HI-LAND MHC (3355 LEMEHL DRIVE in DESOTO, MO)
STATE MASTER (Missouri monitoring and compilance) - PCS-MO0089842, NPDES NON-MAJOR National Pollutant Discharge Elimination System NON-MAJOR (Tracking pollutant discharge elimination systems) - permit Business SIC classification: SEWERAGE SYSTEMS Organizations: MELANNON INC (CONTACT/OWNER)
Alternative names: AUTUMN'S HAVEN, LE MEHL INVESTMENT CO
RICHARD JAKOUBEK (10031 STATE HWY JJ in VALLES MINES, MO)
STATE MASTER (Missouri monitoring and compilance) - PCS-MO0119661, NPDES NON-MAJOR National Pollutant Discharge Elimination System NON-MAJOR (Tracking pollutant discharge elimination systems) - permit Business SIC classification: OPERATORS OF RESIDENTIAL MOBILE HOME SITES Alternative names: RICHARD JAKOUBEK MHP
AMOCO OIL (HWY 67 & JJ in VALLES MINES, MO)
STATE MASTER (Missouri monitoring and compilance) - RCRAINFO-MOP000037804, NOT IN A UNIVERSE (Resource Conservation and Recovery Act (tracking hazardous waste)) Organizations: JOYCE WILLIAMS (CONTACT/OWNER)
Housing units lacking complete plumbing facilities: 2.6% Housing units lacking complete kitchen facilities: 3.0%
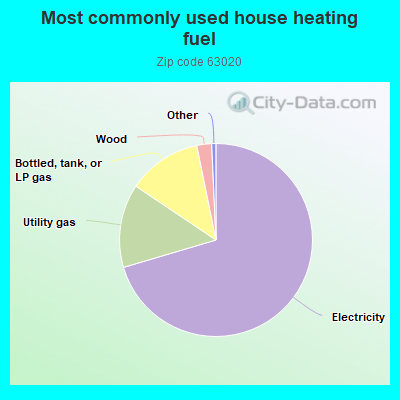
70.5%Electricity
14.0%Utility gas
12.4%Bottled, tank, or LP gas
2.5%Wood
Population in 1990: 13,331. Population change in the 1990s: +6,907 (+51.8%).
Place of birth for U.S.-born residents:
This state: 16,278
Northeast: 313
Midwest: 1,238
South: 1,289
West: 743
59% of the 63020 zip code residents lived in the same house 5 years ago. Out of people who lived in different houses, 66% lived in this county. Out of people who lived in different counties, 50% lived in Missouri.
90% of the 63020 zip code residents lived in the same house 1 year ago. Out of people who lived in different houses, 69% moved from this county. Out of people who lived in different houses, 22% moved from different county within same state. Out of people who lived in different houses, 6% moved from different state.
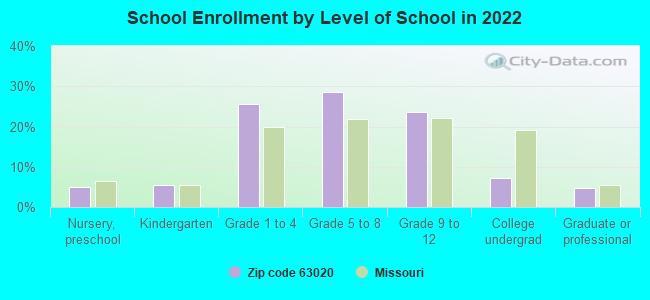
Private vs. public school enrollment:
Students in private schools in grades 1 to 8 (elementary and middle school): 68
Here:
3.2%
Missouri:
15.4%
Students in private schools in grades 9 to 12 (high school): 51
Here:
5.5%
Missouri:
13.9%
Students in private undergraduate colleges: 16
Here:
5.7%
Missouri:
22.6%
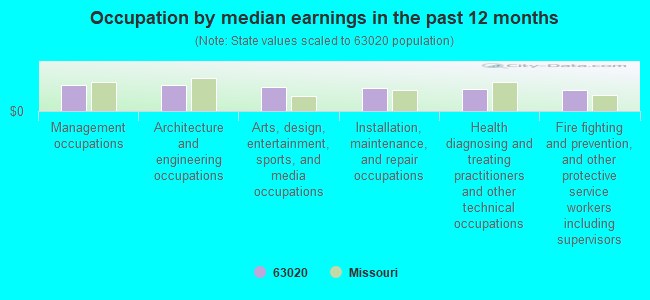
Occupation by median earnings in the past 12 months ($)
81,220Management occupations
79,279Architecture and engineering occupations
73,724Arts, design, entertainment, sports, and media occupations
70,678Installation, maintenance, and repair occupations
68,894Health diagnosing and treating practitioners and other technical occupations
64,754Fire fighting and prevention, and other protective service workers including supervisors
Companies with federal contracts located in this zip code:
HANNA, JANET (3560 HYFIELD SCHOOL RD in DE SOTO, MO; small business) : $4,763 in 7 contractsfrom 2002 to 2004
Contracts for Operation of Government-Owned Facilities -- Recreation Facilities (Non-Building) by U.S. Army Corps of Engineers - civil program financing only, Army Signed by year:2000: $0; 2001: $0; 2002: $4,917; 2003: $11,016; 2004: -$11,170; 2005: $0; 2006: $0.
Biggest contracts:
$5,508 with U.S. Army Corps of Engineers - civil program financing only for Operation of Government-Owned Facilities -- Recreation Facilities (Non-Building). Signed on 2003-12-16. Completion date: 2004-12-31.
$5,508 with Army for Operation of Government-Owned Facilities -- Recreation Facilities (Non-Building). Signed on 2003-12-16. Completion date: 2004-12-31.
$5,139 with U.S. Army Corps of Engineers - civil program financing only for Operation of Government-Owned Facilities -- Recreation Facilities (Non-Building). Signed on 2002-12-10. Completion date: 2003-12-31.
$0, same as above.Signed on 2002-12-10. Completion date: 2003-12-31.
Top industries in this zip code by the number of employees in 2005:
Health Care and Social Assistance: Nursing Care Facilities (100-249 employees: 1 establishment, 50-99 employees: 1 establishment)
Health Care and Social Assistance: Continuing Care Retirement Communities (100-249: 1, 20-49: 1)
2002 - 2018 National Fire Incident Reporting System (NFIRS) incidents
Based on the data from the years 2002 - 2018 the average number of fires per year is 194. The highest number of reported fire incidents - 288 took place in 2008, and the least - 39 in 2011. The data has a growing trend.
When looking into fire subcategories, the most reports belonged to: Structure Fires (55.6%), and Outside Fires (31.8%).
Fire incident types reported to NFIRS in Zip Code 63020


 Nearest zip codes: 63674, 63047, 63626, 63087, 63050, 63628.
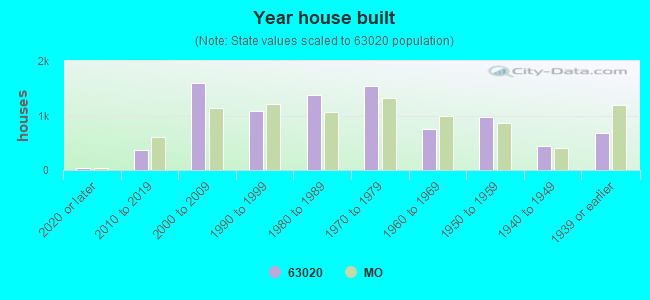


 Based on the data from the years 2002 - 2018 the average number of fires per year is 194. The highest number of reported fire incidents - 288 took place in 2008, and the least - 39 in 2011. The data has a growing trend.
 When looking into fire subcategories, the most reports belonged to: Structure Fires (55.6%), and Outside Fires (31.8%).