Estimated zip code population in 2022: 862 Zip code population in 2010: 710 Zip code population in 2000: 636
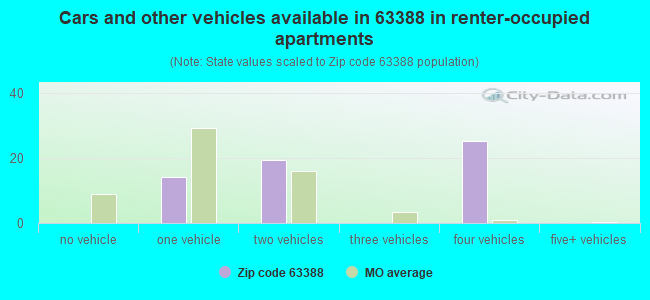
Houses and condos: 715 Renter-occupied apartments: 57
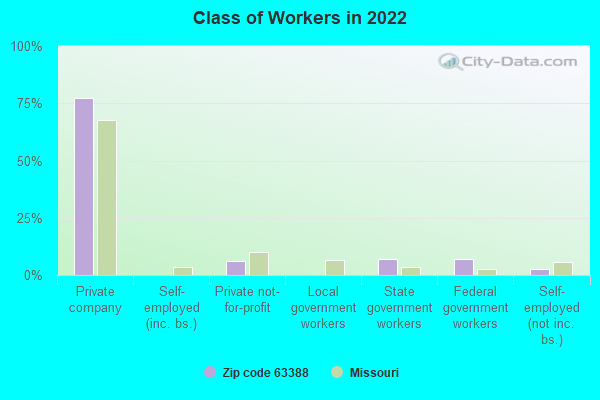
% of renters here:
14%
State:
32%
March 2022 cost of living index in zip code 63388: 72.8 (low, U.S. average is 100)
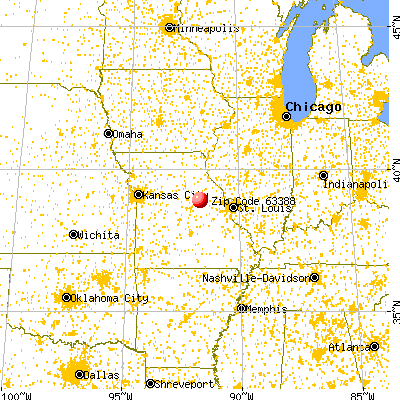
Land area: 61.3 sq. mi. Water area: 0.8 sq. mi.
Population density: 14 people per square mile
(very low).
OSM Map
General Map
Google Map
MSN Map
OSM Map
General Map
Google Map
MSN Map
OSM Map
General Map
Google Map
MSN Map
OSM Map
General Map
Google Map
MSN Map
Please wait while loading the map...
Real estate property taxes paid for housing units in 2022:
This zip code:
0.9% ($697)
Missouri:
0.8% ($1,810)
Median real estate property taxes paid for housing units with mortgages in 2022: $837 (1.2%) Median real estate property taxes paid for housing units with no mortgage in 2022: $566 (0.7%)
Business Search- 14 Million verified businesses
Males: 502
(58.3%)
Females: 359
(41.7%)
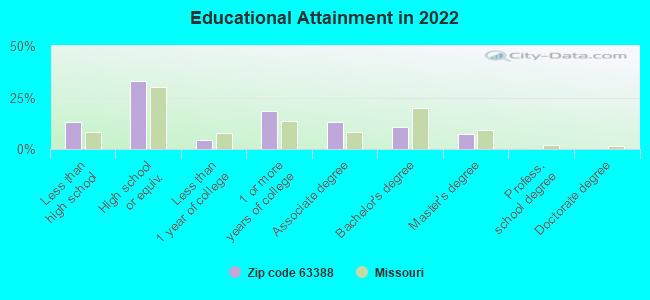
For population 25 years and over in 63388:
High school or higher: 85.9%
Bachelor's degree or higher: 17.7%
Graduate or professional degree: 7.2%
Unemployed: 7.5%
Mean travel time to work (commute): 42.4 minutes
For population 15 years and over in 63388:
Never married: 14.1%
Now married: 51.5%
Separated: 2.3%
Widowed: 5.9%
Divorced: 26.2%
Zip code 63388 compared to state average:
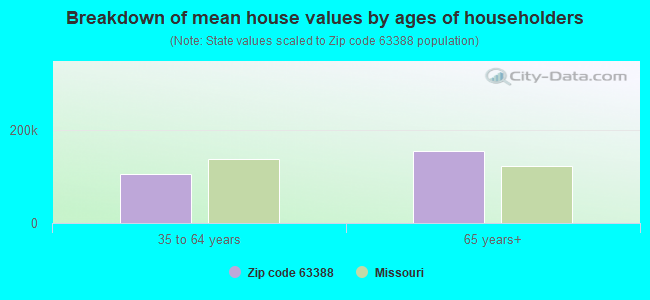
Median house value significantly below state average.
Unemployed percentage above state average.
Hispanic race population percentage significantly below state average.
Median age significantly above state average.
Foreign-born population percentage significantly below state average.
Renting percentage significantly below state average.
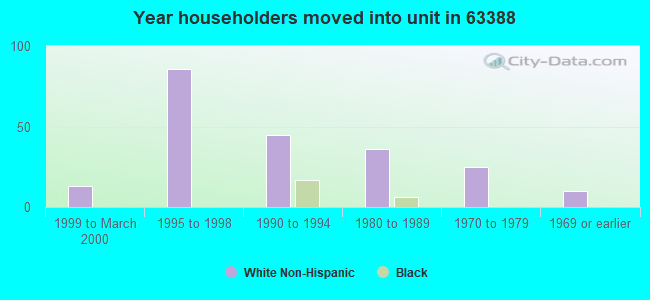
Length of stay since moving in significantly above state average.
Averages for the 2020 tax year for zip code 63388, filed in 2021:
Average Adjusted Gross Income (AGI) in 2020: $44,942 (Individual Income Tax Returns)
Here:
$44,942
State:
$68,151
Salary/wage: $40,873 (reported on 78.8% of returns)
Here:
$40,873
State:
$56,131
(% of AGI for various income ranges: 1092.0% for AGIs below $25k, 4096.7% for AGIs $25k-50k, 8887.5% for AGIs $50k-75k, 17610.0% for AGIs $100k-200k)
Taxable interest for individuals: $350 (reported on 24.2% of returns)
This zip code:
$350
Missouri:
$1,586
(% of AGI for various income ranges: 26.7% for AGIs $25k-50k, 7.5% for AGIs $50k-75k, 45.0% for AGIs $100k-200k)
Ordinary dividends: $3,375 (reported on 12.1% of returns)
Here:
$3,375
State:
$10,947
(% of AGI for various income ranges: 337.5% for AGIs $50k-75k)
Net capital gain/loss in AGI: +$2,725 (reported on 12.1% of returns)
Here:
+$2,725
State:
+$18,453
(% of AGI for various income ranges: 272.5% for AGIs $50k-75k)
Profit/loss from business: +$3,725 (reported on 12.1% of returns)
Here:
+$3,725
State:
+$12,260
(% of AGI for various income ranges: 248.3% for AGIs $25k-50k)
Earned income credit: $2,200 (reported on 15.2% of returns)
Here:
$2,200
State:
$2,315
(% of AGI for various income ranges: 110.0% for AGIs below $25k)
Percentage of individuals using paid preparers for their 2020 taxes: 93.9%
Here:
94%
State:
93%
(% for various income ranges: 92.3% for AGIs below $25k, 100.0% for AGIs $25k-50k, 80.0% for AGIs $50k-75k, 100.0% for AGIs $75k-100k, 100.0% for AGIs $100k-200k)
Averages for the 2012 tax year for zip code 63388, filed in 2013:
Average Adjusted Gross Income (AGI) in 2012: $37,803 (Individual Income Tax Returns)
Here:
$37,803
State:
$55,896
Salary/wage: $34,861 (reported on 75.7% of returns)
Here:
$34,861
State:
$46,205
(% of AGI for various income ranges: 75.1% for AGIs below $25k, 79.8% for AGIs $25k-50k, 78.2% for AGIs $50k-75k, 147.2% for AGIs $75k-100k)
Taxable interest for individuals: $655 (reported on 29.7% of returns)
This zip code:
$655
Missouri:
$1,559
(% of AGI for various income ranges: 1.0% for AGIs below $25k, 0.7% for AGIs $25k-50k, 1.3% for AGIs $75k-100k)
Ordinary dividends: $2,260 (reported on 13.5% of returns)
Here:
$2,260
State:
$7,410
Net capital gain/loss in AGI: +$2,300 (reported on 8.1% of returns)
Here:
+$2,300
State:
+$11,579
Profit/loss from business: +$900 (reported on 10.8% of returns)
Here:
+$900
State:
+$11,688
Taxable individual retirement arrangement distribution: $7,900 (reported on 8.1% of returns)
63388:
$7,900
Missouri:
$14,773
Total itemized deductions: $20,880 (24% of AGI, reported on 13.5% of returns)
Here:
$20,880
State:
$22,730
Here:
24.5% of AGI
State:
19.2% of AGI
Charity contributions: $2,967 (reported on 8.1% of returns)
Here:
$2,967
State:
$4,745
Taxes paid: $4,580 (reported on 13.5% of returns)
63388:
$4,580
State:
$8,399
Earned income credit: $2,125 (reported on 21.6% of returns)
Here:
$2,125
State:
$2,288
(% of AGI for various income ranges: 6.1% for AGIs below $25k, 1.2% for AGIs $25k-50k)
Percentage of individuals using paid preparers for their 2012 taxes: 54.1%
Here:
54%
State:
55%
(% for various income ranges: 43.8% for AGIs below $25k, 58.3% for AGIs $25k-50k, 60.0% for AGIs $50k-75k, 150.0% for AGIs $75k-100k)
Averages for the 2004 tax year for zip code 63388, filed in 2005:
Average Adjusted Gross Income (AGI) in 2004: $33,041 (Individual Income Tax Returns)
Here:
$33,041
State:
$44,591
Salary/wage: $27,234 (reported on 82.9% of returns)
Here:
$27,234
State:
$38,941
(% of AGI for various income ranges: 153.2% for AGIs below $10k, 71.8% for AGIs $10k-25k, 79.2% for AGIs $25k-50k, 78.8% for AGIs $50k-75k, 116.5% for AGIs $75k-100k)
Taxable interest for individuals: $1,160 (reported on 36.2% of returns)
This zip code:
$1,160
Missouri:
$1,801
(% of AGI for various income ranges: 6.0% for AGIs below $10k, 1.7% for AGIs $10k-25k, 1.7% for AGIs $25k-50k, 0.6% for AGIs $50k-75k, 2.1% for AGIs $75k-100k)
Taxable dividends: $1,746 (reported on 19.4% of returns)
Here:
$1,746
State:
$3,677
(% of AGI for various income ranges: 2.4% for AGIs below $10k, 1.8% for AGIs $10k-25k, 0.5% for AGIs $25k-50k, 2.5% for AGIs $50k-75k)
Net capital gain/loss: +$5,217 (reported on 13.3% of returns)
Here:
+$5,217
State:
+$8,915
Profit/loss from business: +$283 (reported on 13.3% of returns)
Here:
+$283
State:
+$9,793
Total itemized deductions: $17,542 (24% of AGI, reported on 13.9% of returns)
Here:
$17,542
State:
$18,261
Here:
23.7% of AGI
State:
20.5% of AGI
Charity contributions deductions: $1,710 (2% of AGI, reported on 9.0% of returns)
Here:
$1,710
State:
$3,665
Here:
2.1% of AGI
State:
3.9% of AGI
Total tax: $3,551 (reported on 70.4% of returns)
63388:
$3,551
State:
$6,999
(% of AGI for various income ranges: 4.0% for AGIs below $10k, 4.2% for AGIs $10k-25k, 6.1% for AGIs $25k-50k, 8.5% for AGIs $50k-75k, 30.3% for AGIs $75k-100k)
Earned income credit: $1,436 (reported on 22.6% of returns)
Here:
$1,436
State:
$1,728
Percentage of individuals using paid preparers for their 2004 taxes: 61.4%
Here:
61%
State:
62%
(% for various income ranges: 54.9% for AGIs below $10k, 60.0% for AGIs $10k-25k, 65.0% for AGIs $25k-50k, 61.9% for AGIs $50k-75k, 130.8% for AGIs $75k-100k)
Household received Food Stamps/SNAP in the past 12 months: 58 Household did not receive Food Stamps/SNAP in the past 12 months: 342
Women who had a birth in the past 12 months: 4 (0 now married, 5 unmarried) Women who did not have a birth in the past 12 months: 120 (96 now married, 22 unmarried)
Housing units in zip code 63388 with a mortgage: 140 (7 second mortgage) Median monthly owner costs for units with a mortgage: $1,072 Median monthly owner costs for units without a mortgage: $409
Residents with income below the poverty level in 2022:
This zip code:
15.5%
Whole state:
13.2%
Residents with income below 50% of the poverty level in 2022:
This zip code:
11.5%
Whole state:
6.8%
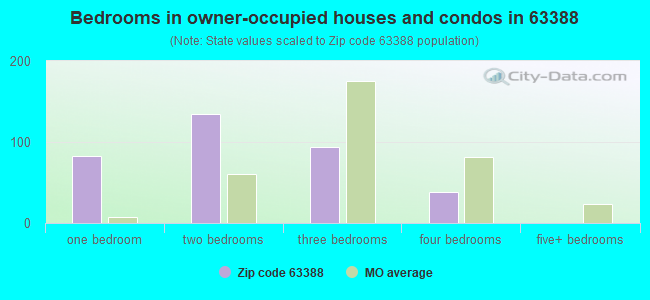
Median number of rooms in houses and condos:
Here:
4.6
State:
6.4
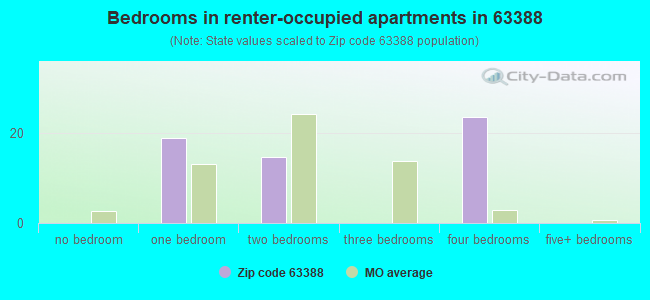
Median number of rooms in apartments:
Here:
5.1
State:
4.4
Notable locations in this zip code not listed on our city pages
Reservoirs: Jack Knittle Lake (A), Eugene Hooks Lake (B), E R Hooks Lake (C), Lake Lochaweeno (D), Muckler and Sieleisch Lake (E). Display/hide their locations on the map
Tourist attractions (not listed on the city page) : Crane's Museum & Shops (10675 Old USHighway 40) (1), Marlene's Restaurant (Cultural Attractions- Events- & Facilities; 10665 Old USHighway 40) (2). Display/hide their approximate locations on the map
In group quarters: 4 (-1 institutionalized population)
Size of family households: 137 2-persons, 41 3-persons, 54 4-persons, 11 5-persons
Size of nonfamily households: 154 1-person
86 married couples with children.
36 single-parent households (36 men).
All residents speak English at home
Foreign born population: 0 (0.0%)
:
0.0%
Whole state:
4.1%
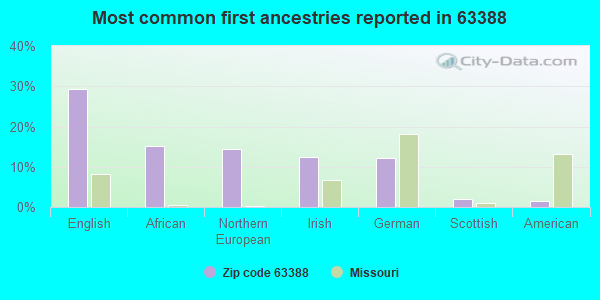
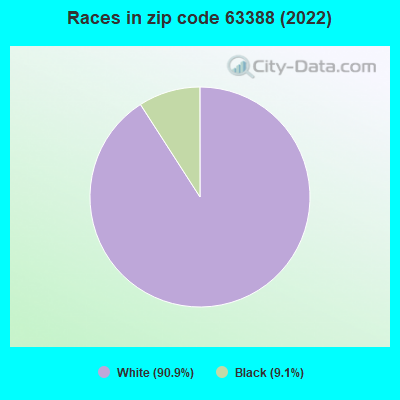
29%English
15%African
14%Northern European
13%Irish
12%German
2%Scottish
1%American
Facilities with environmental interests located in this zip code:
NORTH CALLAWAY R-1 SCHOOL (10500 OLD HWY 40 in WILLIAMSBURG, MO)
STATE MASTER (Missouri monitoring and compilance) - PCS-MO0092801, NPDES NON-MAJOR National Pollutant Discharge Elimination System NON-MAJOR (Tracking pollutant discharge elimination systems) - permit Business SIC classification: ELEMENTARY AND SECONDARY SCHOOLS Alternative names: WILLIAMSBURG ELEM SCHOOL
Housing units lacking complete plumbing facilities: 4.5% Housing units lacking complete kitchen facilities: 6.2%
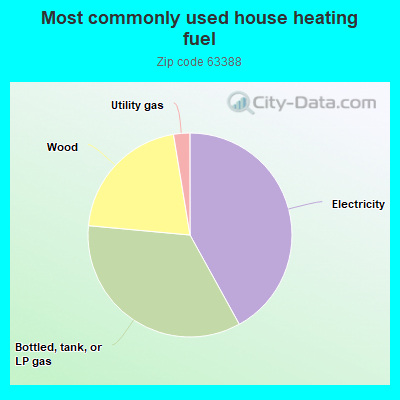
42.1%Electricity
34.6%Bottled, tank, or LP gas
21.0%Wood
2.6%Utility gas
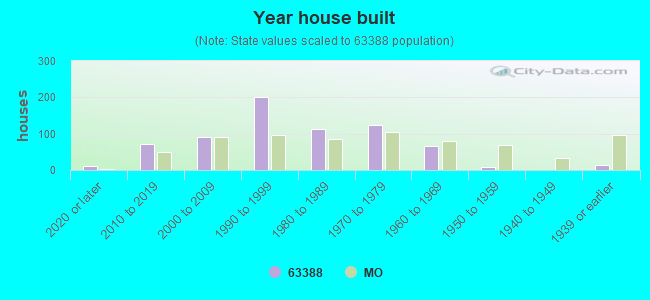
Population in 1990: 228. Population change in the 1990s: +408 (+178.9%).
Place of birth for U.S.-born residents:
This state: 694
Midwest: 90
South: 61
West: 13
65% of the 63388 zip code residents lived in the same house 5 years ago. Out of people who lived in different houses, 52% lived in this county. Out of people who lived in different counties, 50% lived in Missouri.
83% of the 63388 zip code residents lived in the same house 1 year ago. Out of people who lived in different houses, 3% moved from this county. Out of people who lived in different houses, 66% moved from different county within same state. Out of people who lived in different houses, 33% moved from different state.
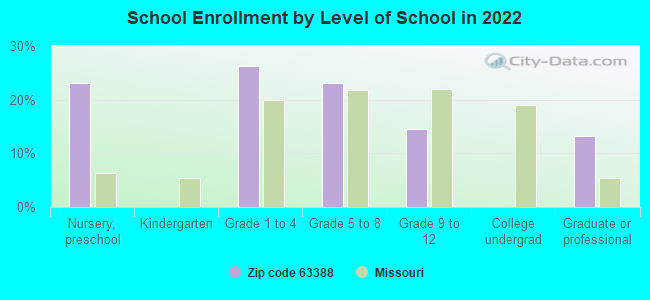
Private vs. public school enrollment:
Students in private schools in grades 1 to 8 (elementary and middle school):
Here:
0.0%
Missouri:
15.4%
Students in private schools in grades 9 to 12 (high school):
Here:
0.0%
Missouri:
13.9%
Top industries in this zip code by the number of employees in 2005:
Arts, Entertainment, and Recreation: Museums (10-19 employees: 1 establishment)
Wholesale Trade: Recyclable Material Merchant Wholesalers (1-4: 2)
Construction: Residential Remodelers (1-4: 1)
Wholesale Trade: Automobile and Other Motor Vehicle Merchant Wholesalers (1-4: 1)
People in group quarters in 2010:
4 people in workers' group living quarters and job corps centers
Fatal accident statistics in 2011:
Fatal accident count: 1
Vehicles involved in fatal accidents: 1
Fatal accidents caused by drunken drivers: 0
Fatalities: 1
Persons involved in fatal accidents: 1
Pedestrians involved in fatal accidents: 1
Home Mortgage Disclosure Act Aggregated Statistics For Year 2009 (Based on 2 partial tracts)
A) FHA, FSA/RHS & VA Home Purchase Loans
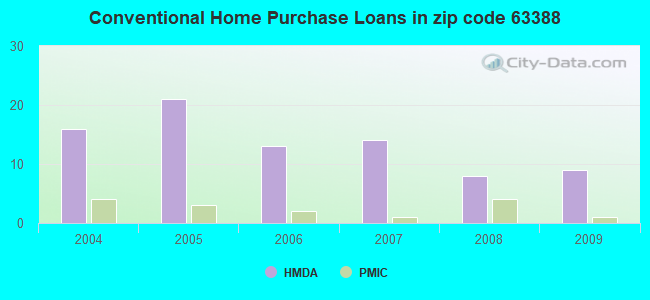
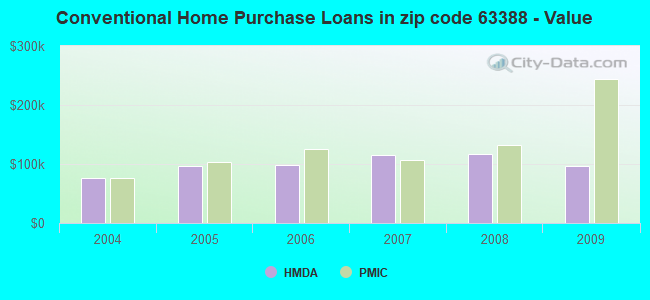
B) Conventional Home Purchase Loans
C) Refinancings
D) Home Improvement Loans
F) Non-occupant Loans on < 5 Family Dwellings (A B C & D)
G) Loans On Manufactured Home Dwelling (A B C & D)
Number
Average Value
Number
Average Value
Number
Average Value
Number
Average Value
Number
Average Value
Number
Average Value
LOANS ORIGINATED
2
$81,675
9
$97,184
43
$143,377
5
$58,806
3
$173,580
4
$81,428
APPLICATIONS APPROVED, NOT ACCEPTED
0
$0
0
$0
9
$115,444
0
$0
0
$0
0
$0
APPLICATIONS DENIED
1
$199,480
4
$72,022
14
$108,546
2
$80,685
0
$0
4
$92,938
APPLICATIONS WITHDRAWN
0
$0
0
$0
6
$130,515
0
$0
0
$0
0
$0
FILES CLOSED FOR INCOMPLETENESS
0
$0
0
$0
1
$137,120
0
$0
0
$0
0
$0
Aggregated Statistics For Year 2008 (Based on 2 partial tracts)
A) FHA, FSA/RHS & VA Home Purchase Loans
B) Conventional Home Purchase Loans
C) Refinancings
D) Home Improvement Loans
F) Non-occupant Loans on < 5 Family Dwellings (A B C & D)
G) Loans On Manufactured Home Dwelling (A B C & D)
Number
Average Value
Number
Average Value
Number
Average Value
Number
Average Value
Number
Average Value
Number
Average Value
LOANS ORIGINATED
1
$173,250
8
$117,625
28
$139,236
2
$14,110
4
$57,172
5
$67,616
APPLICATIONS APPROVED, NOT ACCEPTED
0
$0
2
$126,470
5
$162,854
1
$74,250
0
$0
1
$64,840
APPLICATIONS DENIED
0
$0
3
$77,550
18
$100,265
2
$99,990
1
$67,810
4
$54,945
APPLICATIONS WITHDRAWN
0
$0
0
$0
8
$128,268
0
$0
0
$0
1
$29,700
FILES CLOSED FOR INCOMPLETENESS
0
$0
0
$0
1
$48,020
0
$0
0
$0
0
$0
Aggregated Statistics For Year 2007 (Based on 2 partial tracts)
A) FHA, FSA/RHS & VA Home Purchase Loans
B) Conventional Home Purchase Loans
C) Refinancings
D) Home Improvement Loans
F) Non-occupant Loans on < 5 Family Dwellings (A B C & D)
G) Loans On Manufactured Home Dwelling (A B C & D)
Number
Average Value
Number
Average Value
Number
Average Value
Number
Average Value
Number
Average Value
Number
Average Value
LOANS ORIGINATED
3
$90,420
14
$115,971
26
$109,185
6
$62,288
5
$109,396
9
$74,360
APPLICATIONS APPROVED, NOT ACCEPTED
0
$0
1
$38,610
8
$79,942
2
$19,305
0
$0
2
$88,855
APPLICATIONS DENIED
0
$0
7
$59,330
14
$127,887
1
$86,630
0
$0
7
$63,360
APPLICATIONS WITHDRAWN
0
$0
1
$100,980
9
$108,130
0
$0
0
$0
1
$76,720
FILES CLOSED FOR INCOMPLETENESS
0
$0
0
$0
5
$121,672
0
$0
0
$0
0
$0
Aggregated Statistics For Year 2006 (Based on 2 partial tracts)
A) FHA, FSA/RHS & VA Home Purchase Loans
B) Conventional Home Purchase Loans
C) Refinancings
D) Home Improvement Loans
F) Non-occupant Loans on < 5 Family Dwellings (A B C & D)
G) Loans On Manufactured Home Dwelling (A B C & D)
Number
Average Value
Number
Average Value
Number
Average Value
Number
Average Value
Number
Average Value
Number
Average Value
LOANS ORIGINATED
1
$62,870
13
$98,086
29
$116,103
5
$40,194
7
$65,976
12
$62,329
APPLICATIONS APPROVED, NOT ACCEPTED
0
$0
5
$77,122
5
$124,344
1
$70,780
0
$0
3
$64,680
APPLICATIONS DENIED
0
$0
6
$94,958
18
$100,292
3
$60,887
0
$0
5
$78,506
APPLICATIONS WITHDRAWN
1
$67,810
1
$47,520
12
$113,520
1
$89,100
0
$0
2
$72,765
FILES CLOSED FOR INCOMPLETENESS
0
$0
0
$0
2
$255,915
0
$0
0
$0
0
$0
Aggregated Statistics For Year 2005 (Based on 2 partial tracts)
A) FHA, FSA/RHS & VA Home Purchase Loans
B) Conventional Home Purchase Loans
C) Refinancings
D) Home Improvement Loans
F) Non-occupant Loans on < 5 Family Dwellings (A B C & D)
G) Loans On Manufactured Home Dwelling (A B C & D)
Number
Average Value
Number
Average Value
Number
Average Value
Number
Average Value
Number
Average Value
Number
Average Value
LOANS ORIGINATED
1
$159,390
21
$96,760
25
$104,326
6
$46,448
2
$173,995
10
$69,498
APPLICATIONS APPROVED, NOT ACCEPTED
0
$0
6
$72,353
4
$101,105
1
$15,350
0
$0
4
$54,202
APPLICATIONS DENIED
0
$0
15
$59,499
28
$80,561
3
$19,140
0
$0
12
$48,552
APPLICATIONS WITHDRAWN
0
$0
4
$74,745
13
$100,980
1
$160,380
0
$0
3
$80,357
FILES CLOSED FOR INCOMPLETENESS
0
$0
0
$0
5
$144,540
0
$0
0
$0
0
$0
Aggregated Statistics For Year 2004 (Based on 2 partial tracts)
A) FHA, FSA/RHS & VA Home Purchase Loans
B) Conventional Home Purchase Loans
C) Refinancings
D) Home Improvement Loans
F) Non-occupant Loans on < 5 Family Dwellings (A B C & D)
G) Loans On Manufactured Home Dwelling (A B C & D)


 Nearest zip codes: 65077, 65067, 65231, 65059, 65069, 65262.