Estimated zip code population in 2022: 935 Zip code population in 2010: 829 Zip code population in 2000: 865
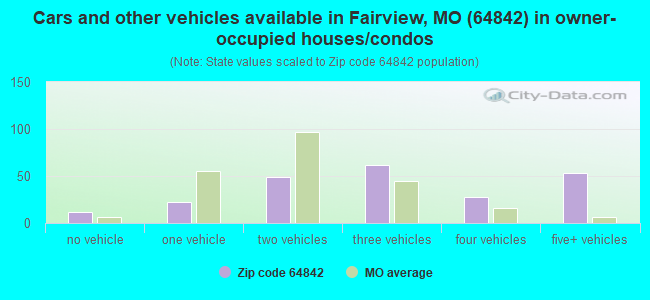
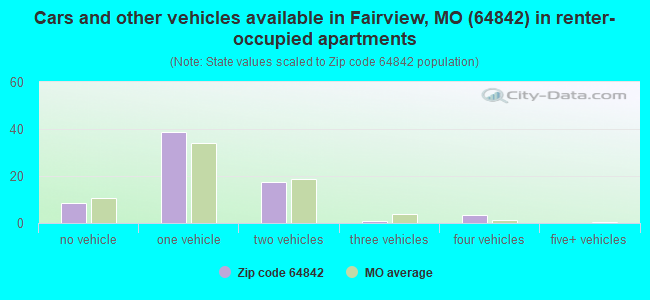
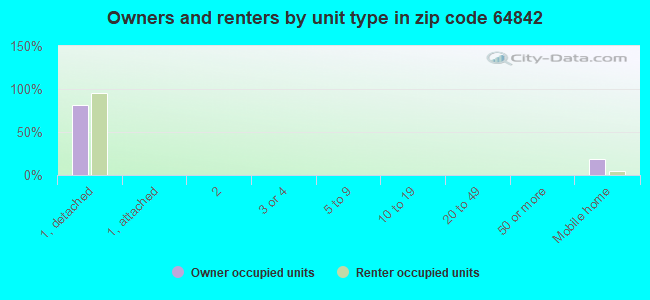
Houses and condos: 343 Renter-occupied apartments: 68
% of renters here:
23%
State:
32%
March 2022 cost of living index in zip code 64842: 75.8 (low, U.S. average is 100)
Land area: 22.3 sq. mi. Water area: 0.0 sq. mi.
Population density: 42 people per square mile
(very low).
OSM Map
General Map
Google Map
MSN Map
OSM Map
General Map
Google Map
MSN Map
OSM Map
General Map
Google Map
MSN Map
OSM Map
General Map
Google Map
MSN Map
Please wait while loading the map...
Real estate property taxes paid for housing units in 2022:
This zip code:
0.6% ($699)
Missouri:
0.8% ($1,810)
Median real estate property taxes paid for housing units with mortgages in 2022: $1,246 (1.5%) Median real estate property taxes paid for housing units with no mortgage in 2022: $618 (0.8%)
Business Search- 14 Million verified businesses
Males: 471
(50.4%)
Females: 464
(49.6%)
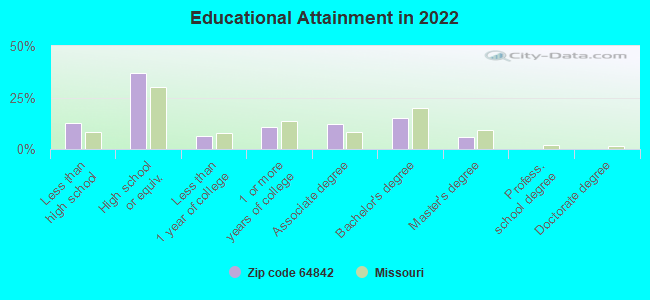
For population 25 years and over in 64842:
High school or higher: 86.5%
Bachelor's degree or higher: 20.7%
Graduate or professional degree: 5.7%
Unemployed: 7.4%
Mean travel time to work (commute): 28.3 minutes
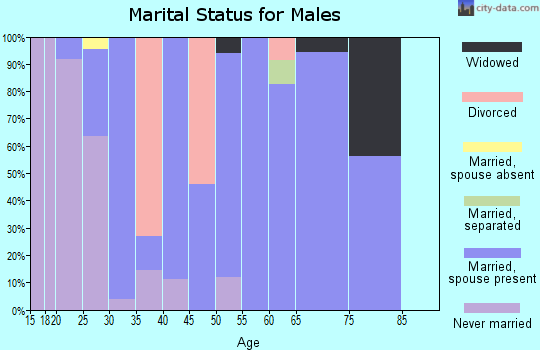
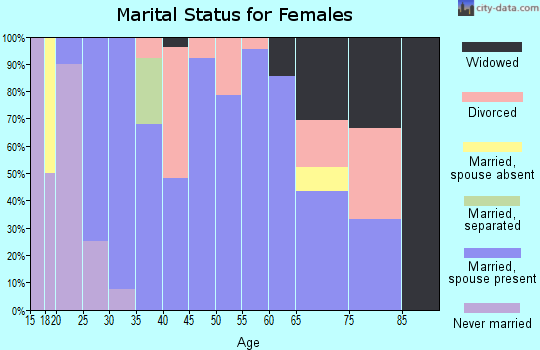
For population 15 years and over in 64842:
Never married: 21.7%
Now married: 66.2%
Separated: 0.6%
Widowed: 2.5%
Divorced: 8.9%
Zip code 64842 compared to state average:
Median house value below state average.
Unemployed percentage above state average.
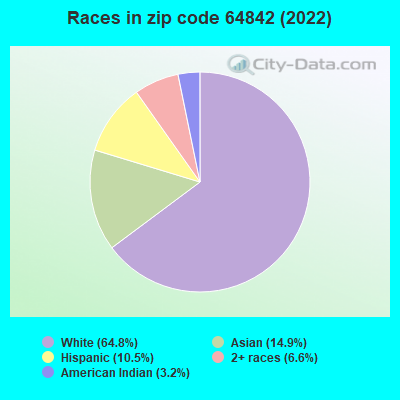
Black race population percentage significantly below state average.
Hispanic race population percentage above state average.
Foreign-born population percentage significantly above state average.
Length of stay since moving in significantly above state average.
Number of college students significantly below state average.
Percentage of population with a bachelor's degree or higher below state average.
Estimated median house/condo value in 2022: $110,267
64842:
$110,267
Missouri:
$221,200
According to our research of Missouri and other state lists, there were 2 registered sex offenders living in 64842 zip code as of April 28, 2024. The ratio of all residents to sex offenders in zip code 64842 is 391 to 1. The ratio of registered sex offenders to all residents in this zip code is near the state average.
Median resident age:
This zip code:
37.2 years
Missouri median age:
39.1 years
Average household size:
This zip code:
3.2 people
Missouri:
2.4 people
Averages for the 2020 tax year for zip code 64842, filed in 2021:
Average Adjusted Gross Income (AGI) in 2020: $36,126 (Individual Income Tax Returns)
Here:
$36,126
State:
$68,151
Salary/wage: $36,000 (reported on 82.4% of returns)
Here:
$36,000
State:
$56,131
(% of AGI for various income ranges: 1199.1% for AGIs below $25k, 4020.0% for AGIs $25k-50k, 7242.5% for AGIs $50k-75k, 13240.0% for AGIs $75k-100k)
Taxable interest for individuals: $300 (reported on 14.7% of returns)
This zip code:
$300
Missouri:
$1,586
(% of AGI for various income ranges: 5.5% for AGIs below $25k, 22.5% for AGIs $50k-75k)
Net capital gain/loss in AGI: +$3,000 (reported on 5.9% of returns)
Here:
+$3,000
State:
+$18,453
(% of AGI for various income ranges: 54.5% for AGIs below $25k)
Profit/loss from business: +$9,040 (reported on 14.7% of returns)
Here:
+$9,040
State:
+$12,260
(% of AGI for various income ranges: 225.5% for AGIs below $25k, 255.0% for AGIs $25k-50k)
Earned income credit: $2,550 (reported on 29.4% of returns)
Here:
$2,550
State:
$2,315
(% of AGI for various income ranges: 151.8% for AGIs below $25k, 110.0% for AGIs $25k-50k)
Percentage of individuals using paid preparers for their 2020 taxes: 97.1%
Here:
97%
State:
93%
(% for various income ranges: 93.8% for AGIs below $25k, 100.0% for AGIs $25k-50k, 100.0% for AGIs $50k-75k, 100.0% for AGIs $75k-100k)
Averages for the 2012 tax year for zip code 64842, filed in 2013:
Average Adjusted Gross Income (AGI) in 2012: $29,516 (Individual Income Tax Returns)
Here:
$29,516
State:
$55,896
Salary/wage: $27,276 (reported on 80.6% of returns)
Here:
$27,276
State:
$46,205
(% of AGI for various income ranges: 74.7% for AGIs below $25k, 77.3% for AGIs $25k-50k, 72.3% for AGIs $50k-75k)
Taxable interest for individuals: $486 (reported on 22.6% of returns)
This zip code:
$486
Missouri:
$1,559
Ordinary dividends: $300 (reported on 6.5% of returns)
Here:
$300
State:
$7,410
Net capital gain/loss in AGI: +$2,433 (reported on 9.7% of returns)
Here:
+$2,433
State:
+$11,579
Profit/loss from business: +$8,600 (reported on 19.4% of returns)
Here:
+$8,600
State:
+$11,688
Total itemized deductions: $16,000 (25% of AGI, reported on 6.5% of returns)
Here:
$16,000
State:
$22,730
Here:
25.0% of AGI
State:
19.2% of AGI
Taxes paid: $3,000 (reported on 6.5% of returns)
64842:
$3,000
State:
$8,399
Earned income credit: $2,070 (reported on 32.3% of returns)
Here:
$2,070
State:
$2,288
(% of AGI for various income ranges: 7.9% for AGIs below $25k, 1.7% for AGIs $25k-50k)
Percentage of individuals using paid preparers for their 2012 taxes: 67.7%
Here:
68%
State:
55%
(% for various income ranges: 64.7% for AGIs below $25k, 62.5% for AGIs $25k-50k, 83.3% for AGIs $50k-75k)
Averages for the 2004 tax year for zip code 64842, filed in 2005:
Average Adjusted Gross Income (AGI) in 2004: $25,879 (Individual Income Tax Returns)
Here:
$25,879
State:
$44,591
Salary/wage: $24,192 (reported on 75.8% of returns)
Here:
$24,192
State:
$38,941
(% of AGI for various income ranges: 107.7% for AGIs below $10k, 70.0% for AGIs $10k-25k, 81.3% for AGIs $25k-50k, 117.1% for AGIs $50k-75k)
Taxable interest for individuals: $900 (reported on 31.1% of returns)
This zip code:
$900
Missouri:
$1,801
(% of AGI for various income ranges: 1.4% for AGIs below $10k, 2.8% for AGIs $10k-25k, 0.8% for AGIs $25k-50k, 0.9% for AGIs $50k-75k)
Taxable dividends: $212 (reported on 11.4% of returns)
Here:
$212
State:
$3,677
Net capital gain/loss: +$1,241 (reported on 10.0% of returns)
Here:
+$1,241
State:
+$8,915
Profit/loss from business: +$5,729 (reported on 20.4% of returns)
Here:
+$5,729
State:
+$9,793
Total itemized deductions: $12,733 (21% of AGI, reported on 10.4% of returns)
Here:
$12,733
State:
$18,261
Here:
21.2% of AGI
State:
20.5% of AGI
Charity contributions deductions: $3,722 (5% of AGI, reported on 6.2% of returns)
Here:
$3,722
State:
$3,665
Here:
4.8% of AGI
State:
3.9% of AGI
Total tax: $2,819 (reported on 61.2% of returns)
64842:
$2,819
State:
$6,999
(% of AGI for various income ranges: 3.4% for AGIs below $10k, 3.9% for AGIs $10k-25k, 5.4% for AGIs $25k-50k, 7.8% for AGIs $50k-75k, 11.7% for AGIs $75k-100k)
Earned income credit: $1,584 (reported on 30.8% of returns)
Here:
$1,584
State:
$1,728
Percentage of individuals using paid preparers for their 2004 taxes: 79.9%
Here:
80%
State:
62%
(% for various income ranges: 81.8% for AGIs below $10k, 76.7% for AGIs $10k-25k, 77.5% for AGIs $25k-50k, 86.4% for AGIs $50k-75k, 92.3% for AGIs $75k-100k)
Household received Food Stamps/SNAP in the past 12 months: 59 Household did not receive Food Stamps/SNAP in the past 12 months: 233
Women who had a birth in the past 12 months: 3 (2 now married, 1 unmarried) Women who did not have a birth in the past 12 months: 241 (142 now married, 97 unmarried)
Housing units in zip code 64842 with a mortgage: 133 (1 second mortgage, 1 both second mortgage and home equity loan) Median monthly owner costs for units with a mortgage: $1,402 Median monthly owner costs for units without a mortgage: $350
Residents with income below the poverty level in 2022:
This zip code:
15.6%
Whole state:
13.2%
Residents with income below 50% of the poverty level in 2022:
This zip code:
7.7%
Whole state:
6.8%
Median number of rooms in houses and condos:
Here:
7.1
State:
6.4
Median number of rooms in apartments:
Here:
5.1
State:
4.4
Notable locations in this zip code not listed on our city pages
Notable locations in zip code 64842: Fairview Volunteer Fire Department (A), Fairview Volunteer Fire Protection Association (B). Display/hide their locations on the map
Size of family households: 90 2-persons, 75 3-persons, 50 4-persons, 23 5-persons, 16 7-or-more-persons
Size of nonfamily households: 17 1-person, 16 2-persons
175 married couples with children.
52 single-parent households (14 men, 38 women).
82.0% of residents of 64842 zip code speak English at home.
4.3% of residents speak Spanish at home (82% well, 16% not well, 3% not at all).
11.5% of residents speak Asian or Pacific Island language at home (32% very well, 44% well, 25% not well).
Foreign born population: 97 (10.4%) (78.0% of them are naturalized citizens)
This zip code:
10.4%
Whole state:
4.1%
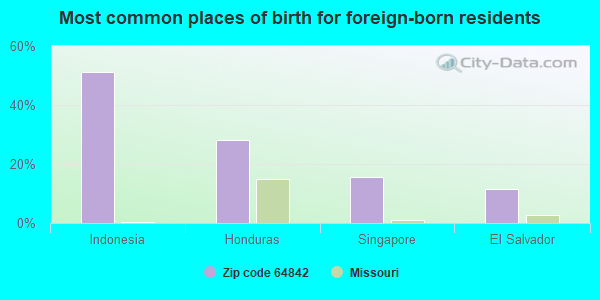
51%Indonesia
28%Honduras
16%Singapore
11%El Salvador
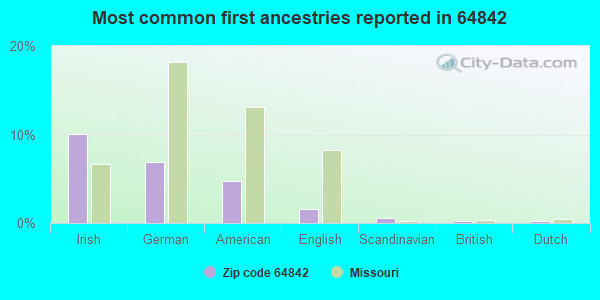
10%Irish
7%German
5%American
2%English
1%Scandinavian
0%British
0%Dutch
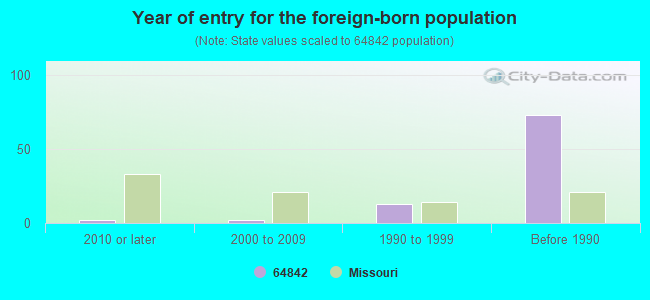
Year of entry for the foreign-born population
22010 or later
22000 to 2009
131990 to 1999
73Before 1990
Facilities with environmental interests located in this zip code:
BARNEY & BOBBY BANKS (19313 ZEBRA DRIVE in FAIRVIEW, MO)
STATE MASTER (Missouri monitoring and compilance) - PCS-MOG010434, NPDES NON-MAJOR National Pollutant Discharge Elimination System NON-MAJOR (Tracking pollutant discharge elimination systems) - permit Business SIC classification: BROILER, FRYER, AND ROASTER CHICKENS Organizations: BARNEY AND BOBBY BANKS (CONTACT/OWNER)
Alternative names: BANKS FARMS INC., BARNEY BANKS
EVANS, JERRY (28702 HWY A in FAIRVIEW, MO)
STATE MASTER (Missouri monitoring and compilance) - PCS-MOG010354, NPDES NON-MAJOR National Pollutant Discharge Elimination System NON-MAJOR (Tracking pollutant discharge elimination systems) - permit Business SIC classification: BROILER, FRYER, AND ROASTER CHICKENS Organizations: JERRY EVANS (CONTACT/OWNER)
FAIRVIEW WW DEPARTMENT (100 SOUTH CENTRAL in FAIRVIEW, MO)
STATE MASTER (Missouri monitoring and compilance) - PCS-MO0112631, NPDES NON-MAJOR National Pollutant Discharge Elimination System NON-MAJOR (Tracking pollutant discharge elimination systems) - permit Business SIC classification: SEWERAGE SYSTEMS Alternative names: FAIRVIEW WWTF
Housing units lacking complete plumbing facilities: 10.9% Housing units lacking complete kitchen facilities: 12.6%
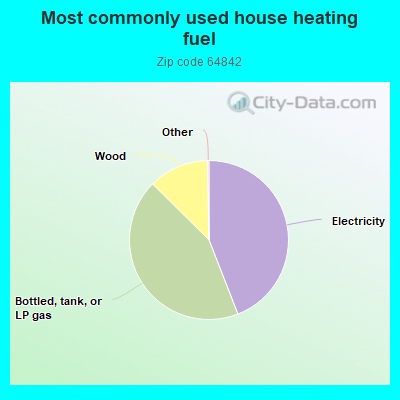
44.3%Electricity
43.6%Bottled, tank, or LP gas
12.3%Wood
Population in 1990: 568. Population change in the 1990s: +297 (+52.3%).
Place of birth for U.S.-born residents:
This state: 466
Northeast: 1
Midwest: 61
South: 171
West: 141
64% of the 64842 zip code residents lived in the same house 5 years ago. Out of people who lived in different houses, 50% lived in this county. Out of people who lived in different counties, 50% lived in Missouri.
99% of the 64842 zip code residents lived in the same house 1 year ago. Out of people who lived in different houses, 25% moved from different county within same state. Out of people who lived in different houses, 112% moved from different state.
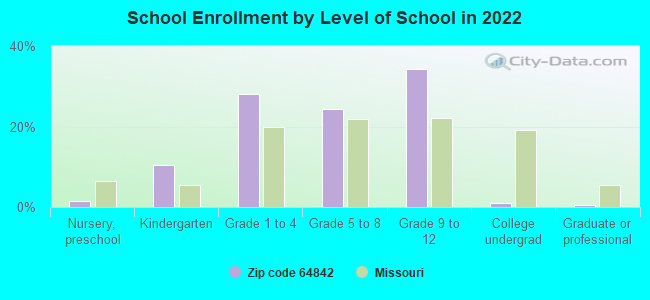
Private vs. public school enrollment:
Students in private schools in grades 1 to 8 (elementary and middle school): 16
Here:
15.1%
Missouri:
15.4%
Students in private schools in grades 9 to 12 (high school): 12
Here:
17.6%
Missouri:
13.9%
Students in private undergraduate colleges:
Here:
31.3%
Missouri:
22.6%
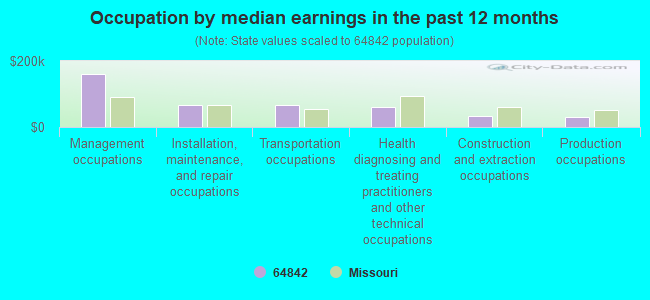
Occupation by median earnings in the past 12 months ($)
159,125Management occupations
67,099Installation, maintenance, and repair occupations
65,401Transportation occupations
59,524Health diagnosing and treating practitioners and other technical occupations
33,828Construction and extraction occupations
30,444Production occupations
Top industries in this zip code by the number of employees in 2005:
Construction: Water and Sewer Line and Related Structures Construction (5-9 employees: 1 establishment)
Wholesale Trade: Farm and Garden Machinery and Equipment Merchant Wholesalers (1-4: 1)
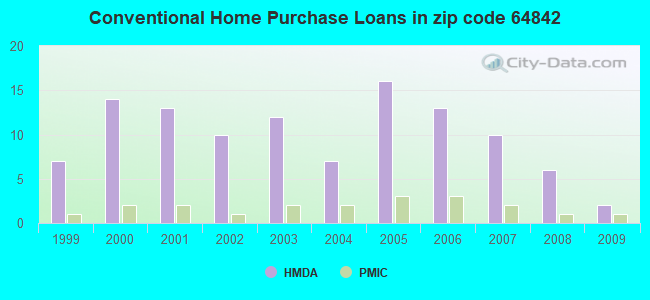
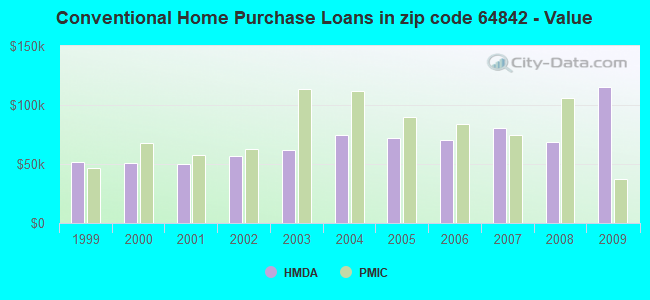
Home Mortgage Disclosure Act Aggregated Statistics For Year 2009 (Based on 2 partial tracts)
A) FHA, FSA/RHS & VA Home Purchase Loans
B) Conventional Home Purchase Loans
C) Refinancings
D) Home Improvement Loans
F) Non-occupant Loans on < 5 Family Dwellings (A B C & D)
G) Loans On Manufactured Home Dwelling (A B C & D)
Number
Average Value
Number
Average Value
Number
Average Value
Number
Average Value
Number
Average Value
Number
Average Value
LOANS ORIGINATED
2
$65,115
2
$114,890
15
$134,252
2
$48,170
1
$31,400
2
$79,030
APPLICATIONS APPROVED, NOT ACCEPTED
0
$0
0
$0
1
$202,310
0
$0
0
$0
0
$0
APPLICATIONS DENIED
1
$110,960
2
$121,670
10
$95,052
1
$7,490
0
$0
2
$55,125
APPLICATIONS WITHDRAWN
0
$0
0
$0
3
$129,520
0
$0
1
$36,390
0
$0
FILES CLOSED FOR INCOMPLETENESS
0
$0
0
$0
1
$156,990
0
$0
0
$0
0
$0
Aggregated Statistics For Year 2008 (Based on 2 partial tracts)
A) FHA, FSA/RHS & VA Home Purchase Loans
B) Conventional Home Purchase Loans
C) Refinancings
D) Home Improvement Loans
F) Non-occupant Loans on < 5 Family Dwellings (A B C & D)
G) Loans On Manufactured Home Dwelling (A B C & D)
Number
Average Value
Number
Average Value
Number
Average Value
Number
Average Value
Number
Average Value
Number
Average Value
LOANS ORIGINATED
2
$91,520
6
$68,803
14
$92,921
3
$37,703
1
$164,480
4
$51,735
APPLICATIONS APPROVED, NOT ACCEPTED
0
$0
1
$51,380
1
$81,710
1
$16,060
0
$0
0
$0
APPLICATIONS DENIED
1
$79,210
6
$58,040
18
$120,023
6
$34,372
1
$45,310
7
$47,709
APPLICATIONS WITHDRAWN
0
$0
0
$0
3
$108,587
0
$0
0
$0
0
$0
FILES CLOSED FOR INCOMPLETENESS
0
$0
0
$0
1
$52,090
0
$0
0
$0
0
$0
Aggregated Statistics For Year 2007 (Based on 2 partial tracts)
A) FHA, FSA/RHS & VA Home Purchase Loans
B) Conventional Home Purchase Loans
C) Refinancings
D) Home Improvement Loans
F) Non-occupant Loans on < 5 Family Dwellings (A B C & D)
G) Loans On Manufactured Home Dwelling (A B C & D)
Number
Average Value
Number
Average Value
Number
Average Value
Number
Average Value
Number
Average Value
Number
Average Value
LOANS ORIGINATED
2
$61,015
10
$80,744
20
$83,562
7
$43,173
2
$81,530
5
$33,824
APPLICATIONS APPROVED, NOT ACCEPTED
0
$0
1
$68,150
4
$76,890
1
$21,050
0
$0
1
$77,070
APPLICATIONS DENIED
0
$0
5
$208,158
14
$117,158
4
$46,295
1
$792,450
5
$43,030
APPLICATIONS WITHDRAWN
0
$0
1
$55,660
5
$139,936
1
$13,920
1
$44,600
1
$30,330
FILES CLOSED FOR INCOMPLETENESS
0
$0
0
$0
1
$124,170
0
$0
0
$0
0
$0
Aggregated Statistics For Year 2006 (Based on 2 partial tracts)
A) FHA, FSA/RHS & VA Home Purchase Loans
B) Conventional Home Purchase Loans
C) Refinancings
D) Home Improvement Loans
F) Non-occupant Loans on < 5 Family Dwellings (A B C & D)
G) Loans On Manufactured Home Dwelling (A B C & D)
Number
Average Value
Number
Average Value
Number
Average Value
Number
Average Value
Number
Average Value
Number
Average Value
LOANS ORIGINATED
1
$90,270
13
$70,125
17
$92,768
5
$39,106
4
$71,182
4
$58,872
APPLICATIONS APPROVED, NOT ACCEPTED
0
$0
2
$48,880
4
$61,548
0
$0
0
$0
2
$36,395
APPLICATIONS DENIED
0
$0
7
$80,637
15
$96,955
6
$44,422
1
$64,580
6
$55,245
APPLICATIONS WITHDRAWN
0
$0
1
$100,620
11
$97,212
4
$48,435
1
$29,970
0
$0
FILES CLOSED FOR INCOMPLETENESS
0
$0
0
$0
2
$71,005
0
$0
0
$0
0
$0
Aggregated Statistics For Year 2005 (Based on 2 partial tracts)
A) FHA, FSA/RHS & VA Home Purchase Loans
B) Conventional Home Purchase Loans
C) Refinancings
D) Home Improvement Loans
F) Non-occupant Loans on < 5 Family Dwellings (A B C & D)
G) Loans On Manufactured Home Dwelling (A B C & D)
Number
Average Value
Number
Average Value
Number
Average Value
Number
Average Value
Number
Average Value
Number
Average Value
LOANS ORIGINATED
1
$47,450
16
$71,628
26
$91,643
4
$46,118
5
$53,876
7
$43,989
APPLICATIONS APPROVED, NOT ACCEPTED
0
$0
4
$51,290
2
$208,370
1
$53,160
0
$0
3
$46,740
APPLICATIONS DENIED
0
$0
12
$75,047
17
$80,028
7
$35,426
1
$153,070
8
$61,325
APPLICATIONS WITHDRAWN
0
$0
2
$50,130
14
$83,491
2
$63,865
0
$0
2
$65,115
FILES CLOSED FOR INCOMPLETENESS
0
$0
1
$44,960
0
$0
0
$0
0
$0
0
$0
Aggregated Statistics For Year 2004 (Based on 2 partial tracts)
B) Conventional Home Purchase Loans
C) Refinancings
D) Home Improvement Loans
F) Non-occupant Loans on < 5 Family Dwellings (A B C & D)
G) Loans On Manufactured Home Dwelling (A B C & D)
Number
Average Value
Number
Average Value
Number
Average Value
Number
Average Value
Number
Average Value
LOANS ORIGINATED
7
$74,979
17
$82,001
5
$43,458
2
$34,430
4
$28,900
APPLICATIONS APPROVED, NOT ACCEPTED
2
$55,840
5
$91,270
0
$0
0
$0
2
$43,350
APPLICATIONS DENIED
5
$54,376
25
$80,237
3
$13,797
1
$18,550
6
$50,665
APPLICATIONS WITHDRAWN
1
$127,380
12
$78,437
2
$32,825
0
$0
2
$95,980
FILES CLOSED FOR INCOMPLETENESS
0
$0
2
$114,000
0
$0
0
$0
0
$0
Aggregated Statistics For Year 2003 (Based on 2 partial tracts)
A) FHA, FSA/RHS & VA Home Purchase Loans
B) Conventional Home Purchase Loans
C) Refinancings
D) Home Improvement Loans
F) Non-occupant Loans on < 5 Family Dwellings (A B C & D)
Number
Average Value
Number
Average Value
Number
Average Value
Number
Average Value
Number
Average Value
LOANS ORIGINATED
1
$35,680
12
$61,548
31
$77,460
3
$31,400
3
$52,687
APPLICATIONS APPROVED, NOT ACCEPTED
0
$0
2
$41,210
4
$55,928
0
$0
1
$26,760
APPLICATIONS DENIED
1
$38,180
10
$57,124
21
$78,496
2
$39,250
1
$84,920
APPLICATIONS WITHDRAWN
0
$0
1
$38,530
10
$101,581
0
$0
0
$0
FILES CLOSED FOR INCOMPLETENESS
0
$0
0
$0
1
$86,700
0
$0
0
$0
Aggregated Statistics For Year 2002 (Based on 2 partial tracts)
B) Conventional Home Purchase Loans
C) Refinancings
D) Home Improvement Loans
F) Non-occupant Loans on < 5 Family Dwellings (A B C & D)
Number
Average Value
Number
Average Value
Number
Average Value
Number
Average Value
LOANS ORIGINATED
10
$56,410
25
$65,922
3
$15,700
4
$40,585
APPLICATIONS APPROVED, NOT ACCEPTED
1
$22,480
6
$61,013
0
$0
0
$0
APPLICATIONS DENIED
8
$44,110
14
$63,587
2
$22,120
1
$38,180
APPLICATIONS WITHDRAWN
1
$62,440
5
$107,326
0
$0
0
$0
FILES CLOSED FOR INCOMPLETENESS
0
$0
2
$57,800
0
$0
0
$0
Aggregated Statistics For Year 2001 (Based on 2 partial tracts)
A) FHA, FSA/RHS & VA Home Purchase Loans
B) Conventional Home Purchase Loans
C) Refinancings
D) Home Improvement Loans
F) Non-occupant Loans on < 5 Family Dwellings (A B C & D)
Number
Average Value
Number
Average Value
Number
Average Value
Number
Average Value
Number
Average Value
LOANS ORIGINATED
1
$62,440
13
$50,144
19
$78,928
3
$32,827
2
$49,415
APPLICATIONS APPROVED, NOT ACCEPTED
0
$0
4
$52,360
3
$86,940
0
$0
0
$0
APPLICATIONS DENIED
0
$0
9
$39,922
17
$61,811
3
$17,603
0
$0
APPLICATIONS WITHDRAWN
0
$0
1
$43,530
9
$76,038
1
$19,270
0
$0
FILES CLOSED FOR INCOMPLETENESS
0
$0
0
$0
2
$69,935
0
$0
0
$0
Aggregated Statistics For Year 2000 (Based on 2 partial tracts)
A) FHA, FSA/RHS & VA Home Purchase Loans
B) Conventional Home Purchase Loans
C) Refinancings
D) Home Improvement Loans
F) Non-occupant Loans on < 5 Family Dwellings (A B C & D)
Number
Average Value
Number
Average Value
Number
Average Value
Number
Average Value
Number
Average Value
LOANS ORIGINATED
1
$34,250
14
$50,666
7
$79,057
4
$24,708
1
$64,940
APPLICATIONS APPROVED, NOT ACCEPTED
0
$0
5
$49,952
6
$66,187
0
$0
0
$0
APPLICATIONS DENIED
0
$0
12
$40,377
15
$44,576
3
$28,663
2
$22,835
APPLICATIONS WITHDRAWN
0
$0
1
$72,430
5
$40,390
0
$0
0
$0
FILES CLOSED FOR INCOMPLETENESS
0
$0
0
$0
1
$66,010
0
$0
0
$0
Aggregated Statistics For Year 1999 (Based on 1 partial tract)
A) FHA, FSA/RHS & VA Home Purchase Loans
B) Conventional Home Purchase Loans
C) Refinancings
D) Home Improvement Loans
F) Non-occupant Loans on < 5 Family Dwellings (A B C & D)


 Nearest zip codes: 64874, 64866, 64861, 65647, 64867, 65734.