Estimated zip code population in 2022: 1,195 Zip code population in 2010: 1,127 Zip code population in 2000: 1,171
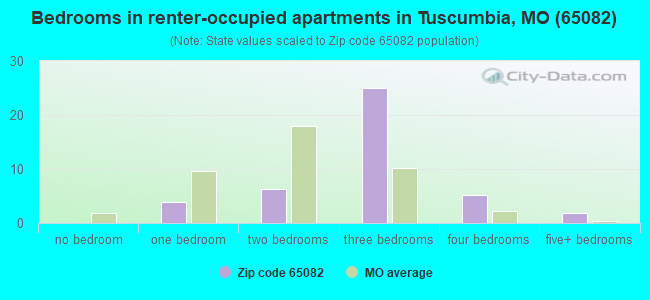
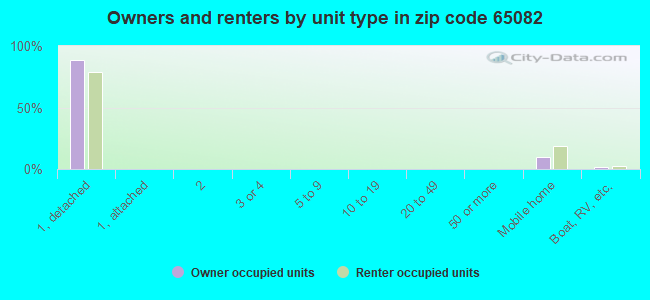
Houses and condos: 482 Renter-occupied apartments: 43
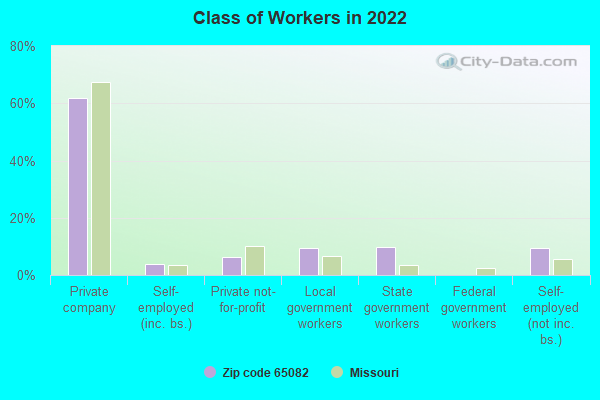
% of renters here:
11%
State:
32%
March 2022 cost of living index in zip code 65082: 77.9 (low, U.S. average is 100)
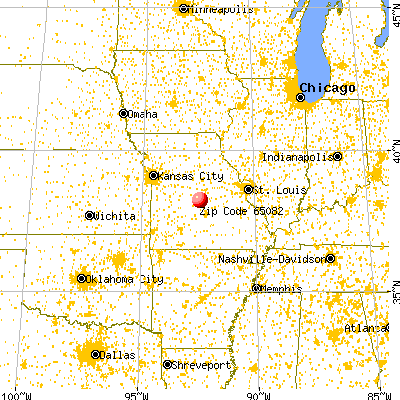
Land area: 67.3 sq. mi. Water area: 1.2 sq. mi.
Population density: 18 people per square mile
(very low).
OSM Map
General Map
Google Map
MSN Map
OSM Map
General Map
Google Map
MSN Map
OSM Map
General Map
Google Map
MSN Map
OSM Map
General Map
Google Map
MSN Map
Please wait while loading the map...
Real estate property taxes paid for housing units in 2022:
This zip code:
0.6% ($1,003)
Missouri:
0.8% ($1,810)
Median real estate property taxes paid for housing units with mortgages in 2022: $1,109 (0.5%) Median real estate property taxes paid for housing units with no mortgage in 2022: $792 (0.6%)
Business Search- 14 Million verified businesses
Males: 570
(47.7%)
Females: 625
(52.3%)
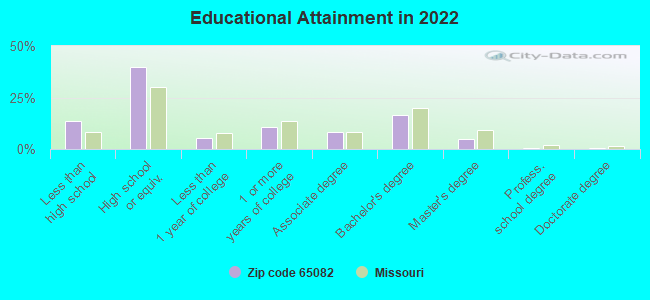
For population 25 years and over in 65082:
High school or higher: 85.2%
Bachelor's degree or higher: 22.0%
Graduate or professional degree: 5.9%
Unemployed: 5.0%
Mean travel time to work (commute): 32.4 minutes
For population 15 years and over in 65082:
Never married: 24.3%
Now married: 58.1%
Separated: 0.6%
Widowed: 10.9%
Divorced: 6.2%
Zip code 65082 compared to state average:
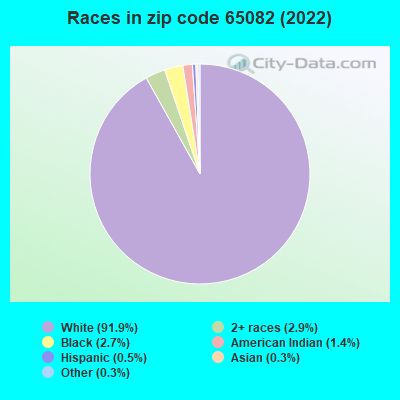
Black race population percentage significantly below state average.
Hispanic race population percentage significantly below state average.
Foreign-born population percentage significantly below state average.
Renting percentage significantly below state average.
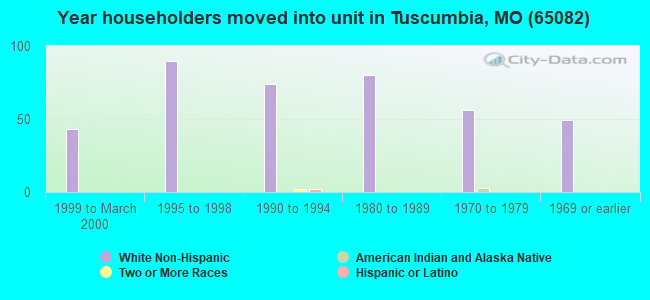
Length of stay since moving in significantly above state average.
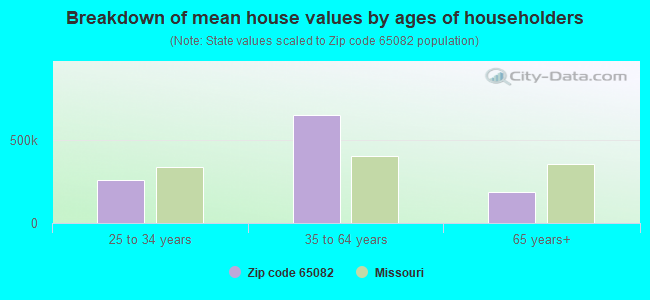
Estimated median house/condo value in 2022: $177,825
65082:
$177,825
Missouri:
$221,200
According to our research of Missouri and other state lists, there were 4 registered sex offenders living in 65082 zip code as of April 27, 2024. The ratio of all residents to sex offenders in zip code 65082 is 275 to 1. The ratio of registered sex offenders to all residents in this zip code is near the state average.
Median resident age:
This zip code:
41.8 years
Missouri median age:
39.1 years
Average household size:
This zip code:
2.7 people
Missouri:
2.4 people
Averages for the 2020 tax year for zip code 65082, filed in 2021:
Average Adjusted Gross Income (AGI) in 2020: $45,634 (Individual Income Tax Returns)
Here:
$45,634
State:
$68,151
Salary/wage: $40,951 (reported on 78.7% of returns)
Here:
$40,951
State:
$56,131
(% of AGI for various income ranges: 1346.7% for AGIs below $25k, 3626.0% for AGIs $25k-50k, 6703.3% for AGIs $50k-75k, 8870.0% for AGIs $75k-100k, 16135.0% for AGIs $100k-200k)
Taxable interest for individuals: $429 (reported on 29.8% of returns)
This zip code:
$429
Missouri:
$1,586
(% of AGI for various income ranges: 9.2% for AGIs below $25k, 23.0% for AGIs $25k-50k, 16.7% for AGIs $50k-75k, 53.3% for AGIs $75k-100k)
Ordinary dividends: $1,350 (reported on 8.5% of returns)
Here:
$1,350
State:
$10,947
(% of AGI for various income ranges: 90.0% for AGIs $50k-75k)
Net capital gain/loss in AGI: +$5,267 (reported on 12.8% of returns)
Here:
+$5,267
State:
+$18,453
(% of AGI for various income ranges: 11.7% for AGIs below $25k, 503.3% for AGIs $50k-75k)
Profit/loss from business: +$7,433 (reported on 12.8% of returns)
Here:
+$7,433
State:
+$12,260
(% of AGI for various income ranges: 75.8% for AGIs below $25k, 227.0% for AGIs $25k-50k, 213.3% for AGIs $50k-75k)
Taxable individual retirement arrangement distribution: $3,075 (reported on 8.5% of returns)
65082:
$3,075
Missouri:
$19,719
(% of AGI for various income ranges: 123.0% for AGIs $25k-50k)
Earned income credit: $2,522 (reported on 19.1% of returns)
Here:
$2,522
State:
$2,315
(% of AGI for various income ranges: 105.0% for AGIs below $25k, 101.0% for AGIs $25k-50k)
Percentage of individuals using paid preparers for their 2020 taxes: 93.6%
Here:
94%
State:
93%
(% for various income ranges: 94.1% for AGIs below $25k, 100.0% for AGIs $25k-50k, 77.8% for AGIs $50k-75k, 100.0% for AGIs $75k-100k, 100.0% for AGIs $100k-200k)
Averages for the 2012 tax year for zip code 65082, filed in 2013:
Average Adjusted Gross Income (AGI) in 2012: $33,578 (Individual Income Tax Returns)
Here:
$33,578
State:
$55,896
Salary/wage: $31,619 (reported on 82.2% of returns)
Here:
$31,619
State:
$46,205
(% of AGI for various income ranges: 74.6% for AGIs below $25k, 77.9% for AGIs $25k-50k, 79.5% for AGIs $50k-75k, 76.7% for AGIs $75k-100k)
Taxable interest for individuals: $400 (reported on 33.3% of returns)
This zip code:
$400
Missouri:
$1,559
(% of AGI for various income ranges: 1.0% for AGIs below $25k, 0.4% for AGIs $25k-50k, 0.2% for AGIs $50k-75k, 0.2% for AGIs $75k-100k)
Ordinary dividends: $450 (reported on 8.9% of returns)
Here:
$450
State:
$7,410
(% of AGI for various income ranges: 0.3% for AGIs below $25k, 0.3% for AGIs $50k-75k)
Net capital gain/loss in AGI: +$3,450 (reported on 8.9% of returns)
Here:
+$3,450
State:
+$11,579
(% of AGI for various income ranges: 3.2% for AGIs below $25k, 1.4% for AGIs $50k-75k)
Profit/loss from business: +$5,238 (reported on 17.8% of returns)
Here:
+$5,238
State:
+$11,688
(% of AGI for various income ranges: 5.8% for AGIs below $25k, 5.7% for AGIs $25k-50k)
Taxable individual retirement arrangement distribution: $3,375 (reported on 8.9% of returns)
65082:
$3,375
Missouri:
$14,773
Total itemized deductions: $15,325 (27% of AGI, reported on 17.8% of returns)
Here:
$15,325
State:
$22,730
Here:
26.8% of AGI
State:
19.2% of AGI
(% of AGI for various income ranges: 14.6% for AGIs $25k-50k, 13.8% for AGIs $75k-100k)
Charity contributions: $2,650 (reported on 8.9% of returns)
Here:
$2,650
State:
$4,745
(% of AGI for various income ranges: 2.7% for AGIs $50k-75k)
Taxes paid: $4,143 (reported on 15.6% of returns)
65082:
$4,143
State:
$8,399
(% of AGI for various income ranges: 2.5% for AGIs $25k-50k, 4.5% for AGIs $75k-100k)
Earned income credit: $2,115 (reported on 28.9% of returns)
Here:
$2,115
State:
$2,288
(% of AGI for various income ranges: 7.0% for AGIs below $25k, 1.9% for AGIs $25k-50k)
Percentage of individuals using paid preparers for their 2012 taxes: 64.4%
Here:
64%
State:
55%
(% for various income ranges: 61.9% for AGIs below $25k, 69.2% for AGIs $25k-50k, 57.1% for AGIs $50k-75k, 75.0% for AGIs $75k-100k)
Averages for the 2004 tax year for zip code 65082, filed in 2005:
Average Adjusted Gross Income (AGI) in 2004: $27,042 (Individual Income Tax Returns)
Here:
$27,042
State:
$44,591
Salary/wage: $26,192 (reported on 87.3% of returns)
Here:
$26,192
State:
$38,941
(% of AGI for various income ranges: 134.9% for AGIs below $10k, 82.4% for AGIs $10k-25k, 82.9% for AGIs $25k-50k, 90.4% for AGIs $50k-75k, 69.3% for AGIs $75k-100k)
Taxable interest for individuals: $971 (reported on 34.7% of returns)
This zip code:
$971
Missouri:
$1,801
(% of AGI for various income ranges: 11.6% for AGIs below $10k, 1.4% for AGIs $10k-25k, 1.3% for AGIs $25k-50k, 0.3% for AGIs $50k-75k, 0.3% for AGIs $75k-100k)
Taxable dividends: $547 (reported on 10.6% of returns)
Here:
$547
State:
$3,677
Net capital gain/loss: +$3,153 (reported on 11.8% of returns)
Here:
+$3,153
State:
+$8,915
Profit/loss from business: +$3,238 (reported on 15.9% of returns)
Here:
+$3,238
State:
+$9,793
Total itemized deductions: $13,438 (29% of AGI, reported on 12.7% of returns)
Here:
$13,438
State:
$18,261
Here:
28.8% of AGI
State:
20.5% of AGI
Charity contributions deductions: $1,432 (3% of AGI, reported on 8.8% of returns)
Here:
$1,432
State:
$3,665
Here:
2.9% of AGI
State:
3.9% of AGI
Total tax: $2,442 (reported on 70.3% of returns)
65082:
$2,442
State:
$6,999
(% of AGI for various income ranges: 3.6% for AGIs below $10k, 3.9% for AGIs $10k-25k, 6.0% for AGIs $25k-50k, 7.2% for AGIs $50k-75k, 10.2% for AGIs $75k-100k)
Earned income credit: $1,740 (reported on 19.1% of returns)
Here:
$1,740
State:
$1,728
Percentage of individuals using paid preparers for their 2004 taxes: 62.7%
Here:
63%
State:
62%
(% for various income ranges: 57.9% for AGIs below $10k, 65.9% for AGIs $10k-25k, 65.4% for AGIs $25k-50k, 57.9% for AGIs $50k-75k, 61.9% for AGIs $75k-100k)
Household received Food Stamps/SNAP in the past 12 months: 36 Household did not receive Food Stamps/SNAP in the past 12 months: 354
Women who had a birth in the past 12 months: 19 (16 now married, 2 unmarried) Women who did not have a birth in the past 12 months: 207 (114 now married, 92 unmarried)
Housing units in zip code 65082 with a mortgage: 167 (20 second mortgage, 18 both second mortgage and home equity loan) Houses without a mortgage: 2
Median monthly owner costs for units with a mortgage: $1,329 Median monthly owner costs for units without a mortgage: $401
Residents with income below the poverty level in 2022:
This zip code:
9.6%
Whole state:
13.2%
Residents with income below 50% of the poverty level in 2022:
This zip code:
6.2%
Whole state:
6.8%
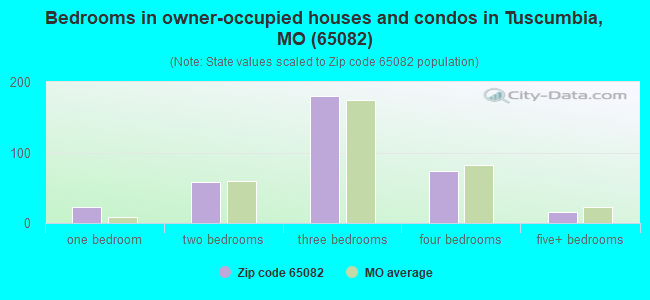
Median number of rooms in houses and condos:
Here:
5.8
State:
6.4
Median number of rooms in apartments:
Here:
6.8
State:
4.4
Notable locations in this zip code not listed on our city pages
Notable locations in zip code 65082: Tuscumbia Fire Protection District (A), Tuscumbia Fire Dept (B), Miller County Home (C). Display/hide their locations on the map
Streams, rivers, and creeks: Eagle Branch (A), Dry Creek (B), Dog Creek (C), Shutin Creek (D), Coon Creek (E), Lousy Creek (F), Cattail Creek (G), Little Saline Creek (H), Turkey Creek (I). Display/hide their locations on the map
In group quarters: 119 (-1 institutionalized population)
Size of family households: 160 2-persons, 61 3-persons, 34 4-persons, 54 5-persons, 8 7-or-more-persons
Size of nonfamily households: 66 1-person, 5 2-persons
213 married couples with children.
59 single-parent households (50 men, 9 women).
99.5% of residents of 65082 zip code speak English at home.
0.5% of residents speak other Indo-European language at home (100% very well).
0.2% of residents speak Asian or Pacific Island language at home (100% well).
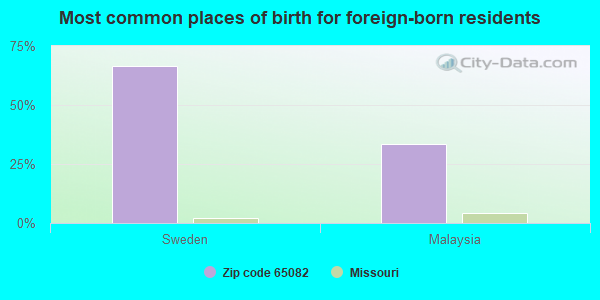
Foreign born population: 6 (0.6%) (28.8% of them are naturalized citizens)
This zip code:
0.6%
Whole state:
4.1%
67%Sweden
33%Malaysia
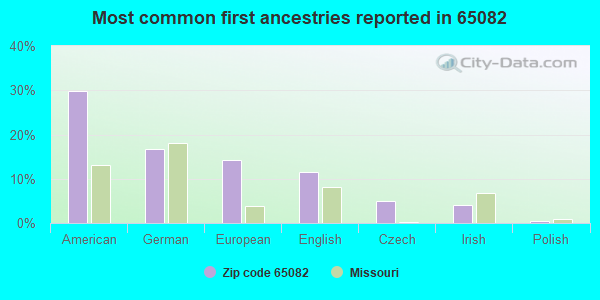
30%American
17%German
14%European
11%English
5%Czech
4%Irish
1%Polish
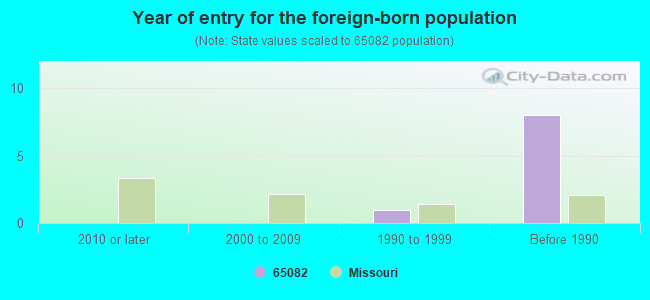
Year of entry for the foreign-born population
02010 or later
02000 to 2009
11990 to 1999
8Before 1990
Facilities with environmental interests located in this zip code:
PRYOR NOVELTY COMPANY (1991 HIGHWAY 52 in TUSCUMBIA, MO)
AIR MINOR (AIRS/AFS) STATE MASTER (Missouri monitoring and compilance) - AIRS/AFS-MO0938936, AIR MINOR, RCRAINFO-MOD006304521, NOT IN A UNIVERSE (Resource Conservation and Recovery Act (tracking hazardous waste)) Business SIC classification: WOOD PRODUCTS Alternative names: PRYOR NOVELTIES CO, PRYOR NOVELTY CO#
BROCKMAN WOOD PRODUCTS (NO STREET ADDRESS in TUSCUMBIA, MO)
AIR MINOR (AIRS/AFS) STATE MASTER (Missouri monitoring and compilance) - AIRS/AFS-MO0938938, AIR MINOR Business SIC classification: MILLWORK
GLAWSON FARMS (39 GLAWSON RD in TUSCUMBIA, MO)
CRITERIA AND HAZARDOUS AIR POLLUTANT INVENTORY (Inventory of air pollution sources)
Housing units lacking complete plumbing facilities: 8.7% Housing units lacking complete kitchen facilities: 9.1%
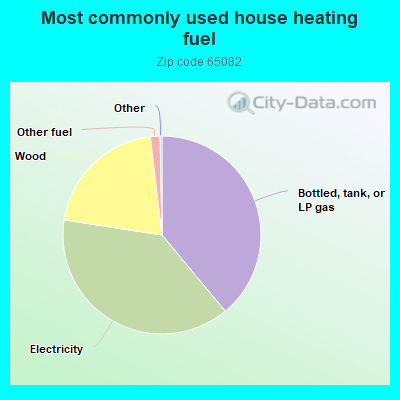
39.2%Bottled, tank, or LP gas
38.7%Electricity
20.8%Wood
1.6%Other fuel
Population in 1990: 1,181.
Place of birth for U.S.-born residents:
This state: 906
Northeast: 7
Midwest: 138
South: 81
West: 49
68% of the 65082 zip code residents lived in the same house 5 years ago. Out of people who lived in different houses, 49% lived in this county. Out of people who lived in different counties, 50% lived in Missouri.
93% of the 65082 zip code residents lived in the same house 1 year ago. Out of people who lived in different houses, 44% moved from this county. Out of people who lived in different houses, 47% moved from different county within same state. Out of people who lived in different houses, 9% moved from different state.
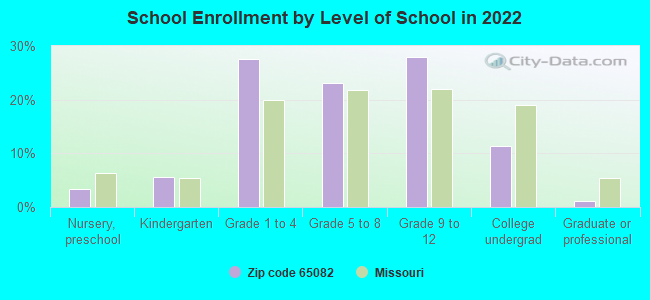
Private vs. public school enrollment:
Students in private schools in grades 1 to 8 (elementary and middle school): 7
Here:
5.4%
Missouri:
15.4%
Students in private schools in grades 9 to 12 (high school): 5
Here:
7.0%
Missouri:
13.9%
Students in private undergraduate colleges: 4
Here:
14.1%
Missouri:
22.6%
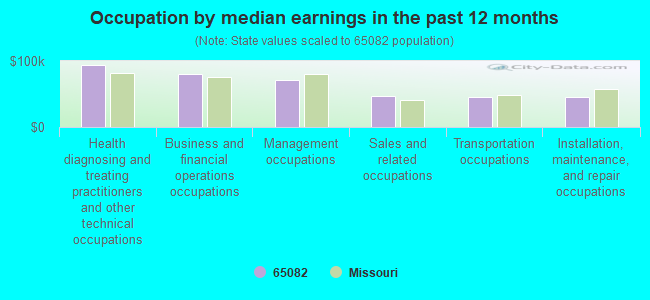
Occupation by median earnings in the past 12 months ($)
94,260Health diagnosing and treating practitioners and other technical occupations
80,627Business and financial operations occupations
71,327Management occupations
47,638Sales and related occupations
45,410Transportation occupations
45,246Installation, maintenance, and repair occupations
Top industries in this zip code by the number of employees in 2005:
Construction: Poured Concrete Foundation and Structure Contractors (10-19 employees: 2 establishments)
Finance and Insurance: Commercial Banking (5-9: 1)
Construction: Painting and Wall Covering Contractors (1-4: 1)
Other Services (except Public Administration): Beauty Salons (1-4: 1)
Accommodation and Food Services: Hotels (except Casino Hotels) and Motels (1-4: 1)
Real Estate and Rental and Leasing: Lessors of Nonfinancial Intangible Assets (except Copyrighted Works) (1-4: 1)
Construction: All Other Specialty Trade Contractors (1-4: 1)
Mining: Construction Sand and Gravel Mining (1-4: 1)
People in group quarters in 2010:
62 people in local jails and other municipal confinement facilities
53 people in nursing facilities/skilled-nursing facilities
People in group quarters in 2000:
84 people in local jails and other confinement facilities (including police lockups)
59 people in other noninstitutional group quarters
Fatal accident statistics in 2013:
Fatal accident count: 2
Vehicles involved in fatal accidents: 3
Fatal accidents caused by drunken drivers: 1
Fatalities: 2
Persons involved in fatal accidents: 3
Pedestrians involved in fatal accidents: 0
Fatal accident statistics in 2012:
Fatal accident count: 2
Vehicles involved in fatal accidents: 4
Fatal accidents caused by drunken drivers: 0
Fatalities: 4
Persons involved in fatal accidents: 7
Pedestrians involved in fatal accidents: 0
2004 - 2017 National Fire Incident Reporting System (NFIRS) incidents
According to the data from the years 2004 - 2017 the average number of fire incidents per year is 8. The highest number of fire incidents - 31 took place in 2006, and the least - 1 in 2010. The data has a declining trend.
When looking into fire subcategories, the most incidents belonged to: Outside Fires (64.9%), and Structure Fires (27.9%).
Fire incident types reported to NFIRS in Zip Code 65082


 Nearest zip codes: 65083, 65032, 65486, 65017, 65075, 65047.


 According to the data from the years 2004 - 2017 the average number of fire incidents per year is 8. The highest number of fire incidents - 31 took place in 2006, and the least - 1 in 2010. The data has a declining trend.
 When looking into fire subcategories, the most incidents belonged to: Outside Fires (64.9%), and Structure Fires (27.9%).