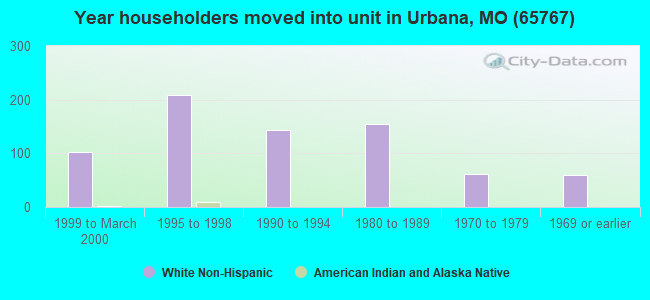
Estimated zip code population in 2022: 1,990 Zip code population in 2010: 2,106 Zip code population in 2000: 1,931
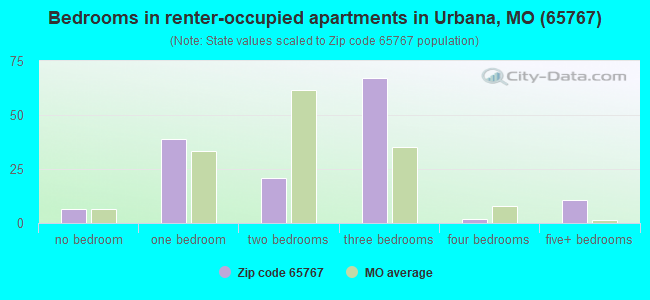
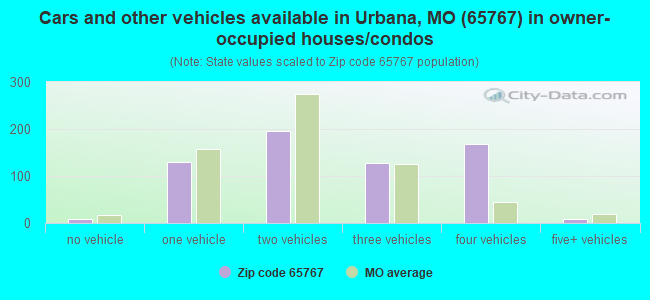
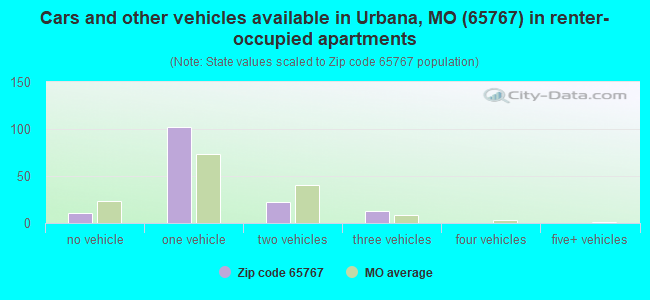
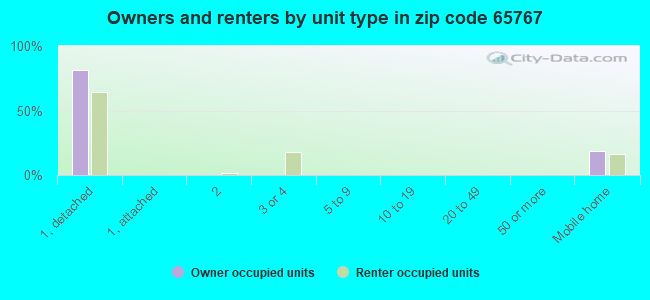
Houses and condos: 930 Renter-occupied apartments: 148
% of renters here:
19%
State:
32%
March 2022 cost of living index in zip code 65767: 75.5 (low, U.S. average is 100)
Land area: 86.2 sq. mi. Water area: 0.9 sq. mi.
Population density: 23 people per square mile
(very low).
OSM Map
General Map
Google Map
MSN Map
OSM Map
General Map
Google Map
MSN Map
OSM Map
General Map
Google Map
MSN Map
OSM Map
General Map
Google Map
MSN Map
Please wait while loading the map...
Real estate property taxes paid for housing units in 2022:
This zip code:
0.5% ($867)
Missouri:
0.8% ($1,810)
Median real estate property taxes paid for housing units with mortgages in 2022: $911 (0.3%) Median real estate property taxes paid for housing units with no mortgage in 2022: $779 (0.6%)
Averages for the 2020 tax year for zip code 65767, filed in 2021:
Average Adjusted Gross Income (AGI) in 2020: $46,884 (Individual Income Tax Returns)
Here:
$46,884
State:
$68,151
Salary/wage: $42,337 (reported on 74.7% of returns)
Here:
$42,337
State:
$56,131
(% of AGI for various income ranges: 1217.4% for AGIs below $25k, 3248.9% for AGIs $25k-50k, 6156.0% for AGIs $50k-75k, 9778.0% for AGIs $75k-100k, 15652.0% for AGIs $100k-200k)
Taxable interest for individuals: $1,167 (reported on 34.5% of returns)
This zip code:
$1,167
Missouri:
$1,586
(% of AGI for various income ranges: 19.6% for AGIs below $25k, 28.9% for AGIs $25k-50k, 42.0% for AGIs $50k-75k, 148.0% for AGIs $75k-100k, 274.0% for AGIs $100k-200k)
Ordinary dividends: $2,845 (reported on 12.6% of returns)
Here:
$2,845
State:
$10,947
(% of AGI for various income ranges: 21.7% for AGIs below $25k, 25.0% for AGIs $25k-50k, 46.0% for AGIs $50k-75k, 344.0% for AGIs $100k-200k)
Net capital gain/loss in AGI: +$6,007 (reported on 16.1% of returns)
Here:
+$6,007
State:
+$18,453
(% of AGI for various income ranges: 21.3% for AGIs below $25k, 71.7% for AGIs $25k-50k, 197.0% for AGIs $50k-75k, 932.0% for AGIs $100k-200k)
Profit/loss from business: +$7,585 (reported on 23.0% of returns)
Here:
+$7,585
State:
+$12,260
(% of AGI for various income ranges: 148.3% for AGIs below $25k, 238.3% for AGIs $25k-50k, 402.0% for AGIs $50k-75k, 690.0% for AGIs $75k-100k)
Taxable individual retirement arrangement distribution: $12,143 (reported on 8.0% of returns)
65767:
$12,143
Missouri:
$19,719
(% of AGI for various income ranges: 112.6% for AGIs below $25k, 591.0% for AGIs $50k-75k)
Earned income credit: $2,183 (reported on 20.7% of returns)
Here:
$2,183
State:
$2,315
(% of AGI for various income ranges: 115.7% for AGIs below $25k, 70.6% for AGIs $25k-50k)
Percentage of individuals using paid preparers for their 2020 taxes: 95.4%
Here:
95%
State:
93%
(% for various income ranges: 94.3% for AGIs below $25k, 91.3% for AGIs $25k-50k, 100.0% for AGIs $50k-75k, 100.0% for AGIs $75k-100k, 100.0% for AGIs $100k-200k)
Averages for the 2012 tax year for zip code 65767, filed in 2013:
Average Adjusted Gross Income (AGI) in 2012: $35,749 (Individual Income Tax Returns)
Here:
$35,749
State:
$55,896
Salary/wage: $31,185 (reported on 74.7% of returns)
Here:
$31,185
State:
$46,205
(% of AGI for various income ranges: 63.8% for AGIs below $25k, 71.5% for AGIs $25k-50k, 76.0% for AGIs $50k-75k, 64.7% for AGIs $75k-100k, 48.6% for AGIs $100k-200k)
Taxable interest for individuals: $1,037 (reported on 34.2% of returns)
This zip code:
$1,037
Missouri:
$1,559
(% of AGI for various income ranges: 2.7% for AGIs below $25k, 0.8% for AGIs $25k-50k, 0.7% for AGIs $50k-75k, 0.4% for AGIs $75k-100k, 0.5% for AGIs $100k-200k)
Ordinary dividends: $11,130 (reported on 12.7% of returns)
Here:
$11,130
State:
$7,410
(% of AGI for various income ranges: 0.5% for AGIs below $25k, 0.9% for AGIs $25k-50k, 26.4% for AGIs $75k-100k)
Net capital gain/loss in AGI: +$4,233 (reported on 15.2% of returns)
Here:
+$4,233
State:
+$11,579
(% of AGI for various income ranges: 2.3% for AGIs below $25k, 2.8% for AGIs $25k-50k, 5.0% for AGIs $75k-100k)
Profit/loss from business: +$5,300 (reported on 24.1% of returns)
Here:
+$5,300
State:
+$11,688
(% of AGI for various income ranges: 11.7% for AGIs below $25k, 3.6% for AGIs $25k-50k, 3.0% for AGIs $50k-75k, 0.3% for AGIs $75k-100k)
Taxable individual retirement arrangement distribution: $7,262 (reported on 10.1% of returns)
65767:
$7,262
Missouri:
$14,773
Total itemized deductions: $18,146 (23% of AGI, reported on 16.5% of returns)
Here:
$18,146
State:
$22,730
Here:
23.4% of AGI
State:
19.2% of AGI
(% of AGI for various income ranges: 6.1% for AGIs below $25k, 7.4% for AGIs $25k-50k, 11.1% for AGIs $50k-75k, 22.2% for AGIs $75k-100k)
Charity contributions: $2,500 (reported on 10.1% of returns)
Here:
$2,500
State:
$4,745
(% of AGI for various income ranges: 0.9% for AGIs below $25k, 1.1% for AGIs $50k-75k, 2.4% for AGIs $75k-100k)
Taxes paid: $4,100 (reported on 16.5% of returns)
65767:
$4,100
State:
$8,399
(% of AGI for various income ranges: 0.6% for AGIs below $25k, 1.0% for AGIs $25k-50k, 2.1% for AGIs $50k-75k, 8.0% for AGIs $75k-100k)
Earned income credit: $2,181 (reported on 26.6% of returns)
Here:
$2,181
State:
$2,288
(% of AGI for various income ranges: 6.8% for AGIs below $25k, 1.9% for AGIs $25k-50k)
Percentage of individuals using paid preparers for their 2012 taxes: 74.7%
Here:
75%
State:
55%
(% for various income ranges: 70.0% for AGIs below $25k, 76.2% for AGIs $25k-50k, 80.0% for AGIs $50k-75k, 80.0% for AGIs $75k-100k, 100.0% for AGIs $100k-200k)
Averages for the 2004 tax year for zip code 65767, filed in 2005:
Average Adjusted Gross Income (AGI) in 2004: $27,079 (Individual Income Tax Returns)
Here:
$27,079
State:
$44,591
Salary/wage: $27,022 (reported on 77.9% of returns)
Here:
$27,022
State:
$38,941
(% of AGI for various income ranges: 137.3% for AGIs below $10k, 73.6% for AGIs $10k-25k, 78.4% for AGIs $25k-50k, 79.1% for AGIs $50k-75k, 70.4% for AGIs $75k-100k, 70.3% for AGIs over 100k)
Taxable interest for individuals: $1,218 (reported on 42.3% of returns)
This zip code:
$1,218
Missouri:
$1,801
(% of AGI for various income ranges: 15.0% for AGIs below $10k, 2.6% for AGIs $10k-25k, 1.9% for AGIs $25k-50k, 0.7% for AGIs $50k-75k, 0.2% for AGIs $75k-100k, 1.2% for AGIs over 100k)
Taxable dividends: $784 (reported on 15.1% of returns)
Here:
$784
State:
$3,677
(% of AGI for various income ranges: 2.6% for AGIs below $10k, 0.4% for AGIs $10k-25k, 0.4% for AGIs $25k-50k, 0.2% for AGIs $50k-75k, 1.4% for AGIs $75k-100k)
Net capital gain/loss: +$2,789 (reported on 17.3% of returns)
Here:
+$2,789
State:
+$8,915
(% of AGI for various income ranges: 6.0% for AGIs below $10k, 2.0% for AGIs $10k-25k, 1.7% for AGIs $25k-50k, 2.2% for AGIs $50k-75k, 1.7% for AGIs $75k-100k)
Profit/loss from business: +$4,635 (reported on 22.1% of returns)
Here:
+$4,635
State:
+$9,793
(% of AGI for various income ranges: 14.4% for AGIs below $10k, 10.4% for AGIs $10k-25k, 4.2% for AGIs $25k-50k, -0.0% for AGIs $50k-75k)
IRA payment deduction: $3,000 (reported on 3.6% of returns)
65767:
$3,000
Missouri:
$2,972
Total itemized deductions: $14,603 (26% of AGI, reported on 15.1% of returns)
Here:
$14,603
State:
$18,261
Here:
26.4% of AGI
State:
20.5% of AGI
(% of AGI for various income ranges: 6.2% for AGIs $10k-25k, 8.6% for AGIs $25k-50k, 12.1% for AGIs $50k-75k, 9.4% for AGIs over 100k)
Charity contributions deductions: $2,026 (4% of AGI, reported on 9.9% of returns)
Here:
$2,026
State:
$3,665
Here:
3.9% of AGI
State:
3.9% of AGI
(% of AGI for various income ranges: 0.5% for AGIs $10k-25k, 1.0% for AGIs $25k-50k, 0.8% for AGIs $50k-75k, 1.3% for AGIs $75k-100k)
Total tax: $3,288 (reported on 64.1% of returns)
65767:
$3,288
State:
$6,999
(% of AGI for various income ranges: 7.7% for AGIs below $10k, 3.8% for AGIs $10k-25k, 5.4% for AGIs $25k-50k, 8.2% for AGIs $50k-75k, 12.1% for AGIs $75k-100k, 16.9% for AGIs over 100k)
Earned income credit: $1,586 (reported on 26.4% of returns)
Here:
$1,586
State:
$1,728
Percentage of individuals using paid preparers for their 2004 taxes: 73.6%
Here:
74%
State:
62%
(% for various income ranges: 67.6% for AGIs below $10k, 74.5% for AGIs $10k-25k, 73.7% for AGIs $25k-50k, 81.4% for AGIs $50k-75k, 90.0% for AGIs $75k-100k, 76.5% for AGIs over 100k)
Household received Food Stamps/SNAP in the past 12 months: 105 Household did not receive Food Stamps/SNAP in the past 12 months: 681
Women who had a birth in the past 12 months: 58 (13 now married, 48 unmarried) Women who did not have a birth in the past 12 months: 372 (228 now married, 142 unmarried)
Housing units in zip code 65767 with a mortgage: 306 (9 second mortgage, 4 both second mortgage and home equity loan) Houses without a mortgage: 192
Median monthly owner costs for units with a mortgage: $1,050 Median monthly owner costs for units without a mortgage: $381
Residents with income below the poverty level in 2022:
This zip code:
26.7%
Whole state:
13.2%
Residents with income below 50% of the poverty level in 2022:
This zip code:
8.9%
Whole state:
6.8%
Median number of rooms in houses and condos:
Here:
6.9
State:
6.4
Median number of rooms in apartments:
Here:
4.8
State:
4.4
Notable locations in this zip code not listed on our city pages
Notable locations in zip code 65767: Urbana Rural Fire Department Station 2 (A), Urbana Rural Fire Department Station 1 (B). Display/hide their locations on the map
Churches in zip code 65767 include: Pleasant Ridge Church (A), Hopewell Church (B), Howard Chapel (C), Bower Chapel (D), Elixer Church (E). Display/hide their locations on the map
Streams, rivers, and creeks: Cahoochie Creek (A), Ingalls Creek (B), Zeewick Branch (C), Stick Branch (D), Judge Creek (E), Monday Branch (F). Display/hide their locations on the map
In group quarters: 16 (-1 institutionalized population)
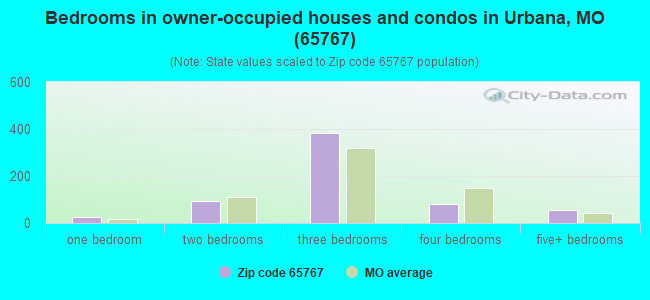
Size of family households: 416 2-persons, 38 3-persons, 84 4-persons, 34 5-persons, 1 6-persons, 12 7-or-more-persons
Size of nonfamily households: 191 1-person, 7 2-persons
248 married couples with children.
210 single-parent households (9 men, 201 women).
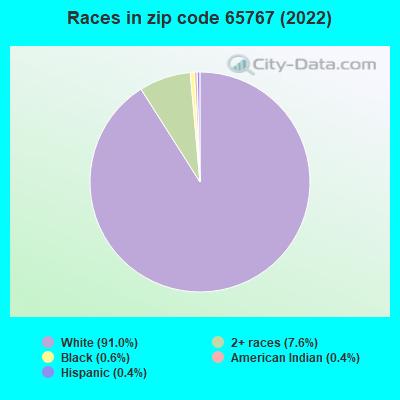
99.5% of residents of 65767 zip code speak English at home.
0.1% of residents speak Spanish at home (100% very well).
0.1% of residents speak other Indo-European language at home (50% very well, 50% not well).
Foreign born population: 13 (0.7%) (100.0% of them are naturalized citizens)
This zip code:
0.7%
Whole state:
4.1%
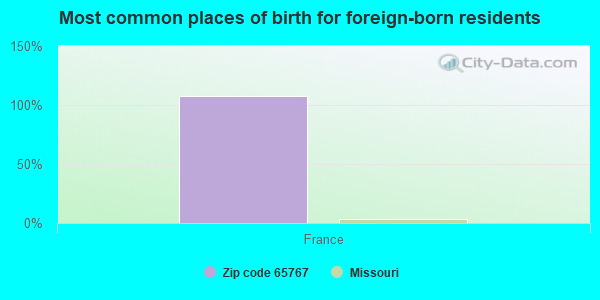
108%France
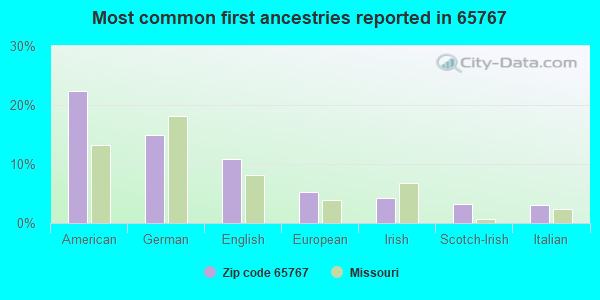
22%American
15%German
11%English
5%European
4%Irish
3%Scotch-Irish
3%Italian
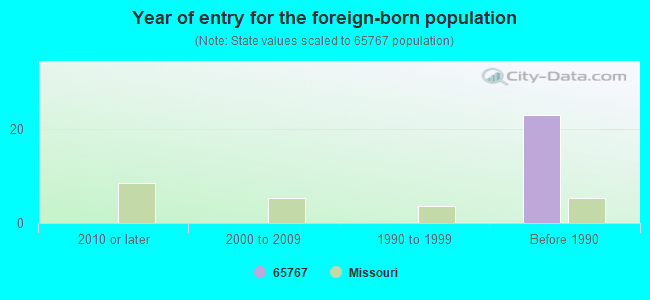
Year of entry for the foreign-born population
02010 or later
02000 to 2009
01990 to 1999
23Before 1990
Facilities with environmental interests located in this zip code:
RUTLEDGE WASTE WATER INC (ROUTE 1 BOX 130 in URBANA, MO)
STATE MASTER (Missouri monitoring and compilance) - RCRAINFO-MO0000129767, TRANSPORTER TRANSPORTER (Resource Conservation and Recovery Act (tracking hazardous waste)) Organizations: JAMES RUTLEDGE (CONTACT/OWNER)
HICKORY COUNTY SCHOOL DIST R-1 (RR 1 BOX 62 in URBANA, MO)
STATE MASTER (Missouri monitoring and compilance) - NCDB-I07#19891019R7012 1, COMPLIANCE ACTIVITY, NCDB-I07#19891019R7012 2, COMPLIANCE ACTIVITY (Tracking inspections of insecticide, fungicide, and rodenticide, and toxic substances) Alternative names: HICKORY COUNTY SCHOOL DIST (WP)
HICKORY COUNTY R-1 SCHOOL DIST (RR 1 BOX 42 in URBANA, MO)
STATE MASTER (Missouri monitoring and compilance) - NCDB-C07#07-90-513, COMPLIANCE ACTIVITY COMPLIANCE ACTIVITY (Tracking inspections of insecticide, fungicide, and rodenticide, and toxic substances)
HUBERTS MOTOR CO (118 S DALLAS ST in URBANA, MO)
(Resource Conservation and Recovery Act (tracking hazardous waste)) Organizations: HUBERT CARL WILLIAMS (CONTACT/OPERATOR)
Housing units lacking complete plumbing facilities: 3.5% Housing units lacking complete kitchen facilities: 3.9%
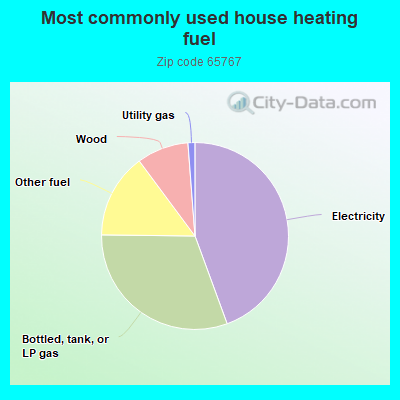
44.6%Electricity
30.9%Bottled, tank, or LP gas
14.7%Other fuel
9.0%Wood
1.2%Utility gas
Population in 1990: 755. Population change in the 1990s: +1,176 (+155.8%).
Place of birth for U.S.-born residents:
This state: 1,315
Northeast: 166
Midwest: 214
South: 114
West: 160
57% of the 65767 zip code residents lived in the same house 5 years ago. Out of people who lived in different houses, 36% lived in this county. Out of people who lived in different counties, 50% lived in Missouri.
96% of the 65767 zip code residents lived in the same house 1 year ago. Out of people who lived in different houses, 33% moved from this county. Out of people who lived in different houses, 78% moved from different county within same state.
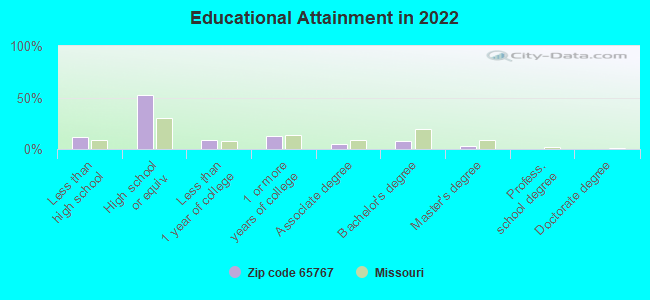
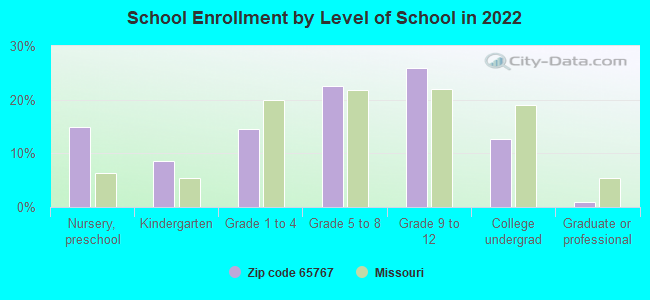
Private vs. public school enrollment:
Students in private schools in grades 1 to 8 (elementary and middle school): 6
Here:
5.7%
Missouri:
15.4%
Students in private schools in grades 9 to 12 (high school): 25
Here:
31.0%
Missouri:
13.9%
Students in private undergraduate colleges:
Here:
0.0%
Missouri:
22.6%
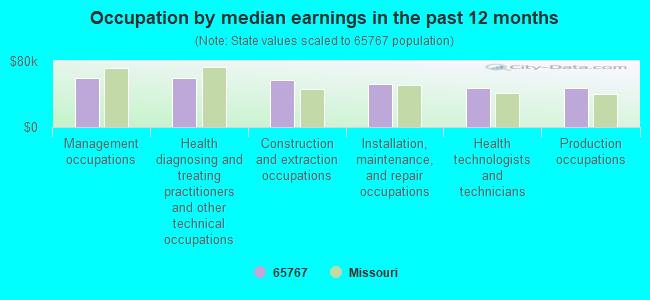
Occupation by median earnings in the past 12 months ($)
59,692Management occupations
58,873Health diagnosing and treating practitioners and other technical occupations
56,386Construction and extraction occupations
52,589Installation, maintenance, and repair occupations
47,425Health technologists and technicians
46,724Production occupations
Top industries in this zip code by the number of employees in 2005:
Finance and Insurance: Commercial Banking (20-49 employees: 1 establishment)
Professional, Scientific, and Technical Services: Marketing Consulting Services (20-49: 1)
Accommodation and Food Services: Limited-Service Restaurants (10-19: 1, 1-4: 1)
Health Care and Social Assistance: Residential Mental Health and Substance Abuse Facilities (5-9: 1)
Other Services (except Public Administration): Beauty Salons (1-4: 3)
People in group quarters in 2010:
20 people in workers' group living quarters and job corps centers
6 people in group homes intended for adults
People in group quarters in 2000:
12 people in homes for the mentally retarded
9 people in nursing homes
Fatal accident statistics in 2014:
Fatal accident count: 1
Vehicles involved in fatal accidents: 1
Fatal accidents caused by drunken drivers: 1
Fatalities: 2
Persons involved in fatal accidents: 3
Pedestrians involved in fatal accidents: 0
2002 - 2018 National Fire Incident Reporting System (NFIRS) incidents
Based on the data from the years 2002 - 2018 the average number of fires per year is 11. The highest number of reported fire incidents - 27 took place in 2005, and the least - 0 in 2007. The data has a rising trend.
When looking into fire subcategories, the most reports belonged to: Outside Fires (60.4%), and Structure Fires (27.5%).
Fire incident types reported to NFIRS in Zip Code 65767


 Nearest zip codes: 65732, 65685, 65668, 65724, 65634, 65727.
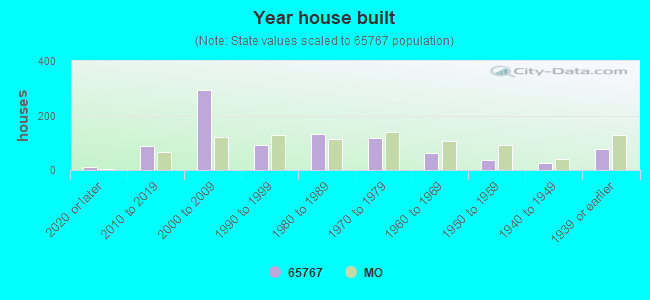


 Based on the data from the years 2002 - 2018 the average number of fires per year is 11. The highest number of reported fire incidents - 27 took place in 2005, and the least - 0 in 2007. The data has a rising trend.
 When looking into fire subcategories, the most reports belonged to: Outside Fires (60.4%), and Structure Fires (27.5%).