Estimated zip code population in 2022: 1,848 Zip code population in 2010: 1,442 Zip code population in 2000: 1,707
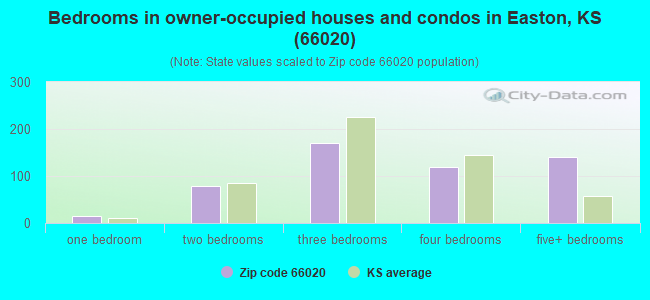
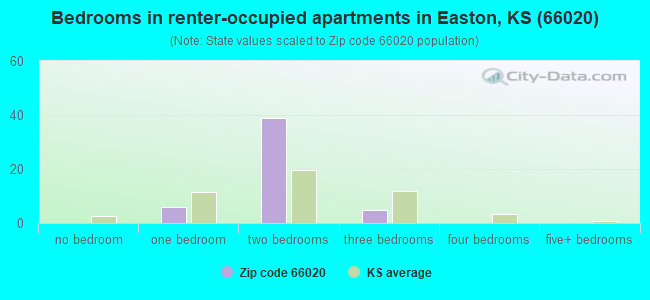
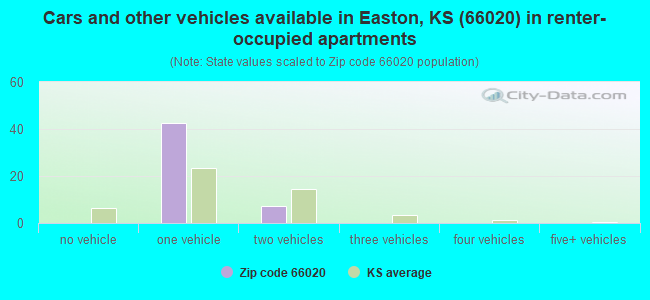
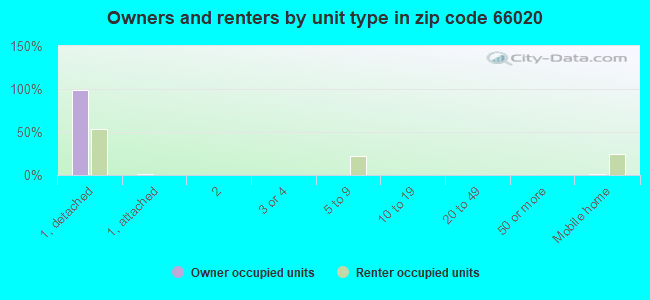
Houses and condos: 648 Renter-occupied apartments: 49
% of renters here:
9%
State:
32%
March 2022 cost of living index in zip code 66020: 80.8 (low, U.S. average is 100)
Land area: 61.9 sq. mi. Water area: 0.2 sq. mi.
Population density: 30 people per square mile
(very low).
OSM Map
General Map
Google Map
MSN Map
OSM Map
General Map
Google Map
MSN Map
OSM Map
General Map
Google Map
MSN Map
OSM Map
General Map
Google Map
MSN Map
Please wait while loading the map...
Real estate property taxes paid for housing units in 2022:
This zip code:
0.8% ($2,591)
Kansas:
1.2% ($2,578)
Median real estate property taxes paid for housing units with mortgages in 2022: $2,625 (0.8%) Median real estate property taxes paid for housing units with no mortgage in 2022: $2,527 (0.8%)
Business Search- 14 Million verified businesses
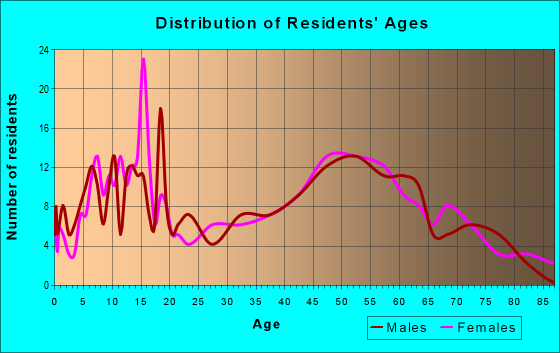
Males: 809
(43.8%)
Females: 1,039
(56.2%)
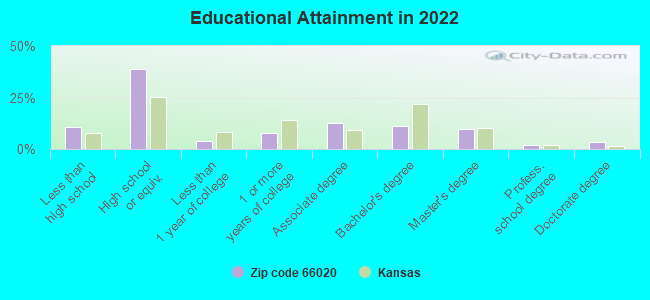
For population 25 years and over in 66020:
High school or higher: 88.5%
Bachelor's degree or higher: 26.1%
Graduate or professional degree: 15.0%
Unemployed: 1.8%
Mean travel time to work (commute): 25.6 minutes
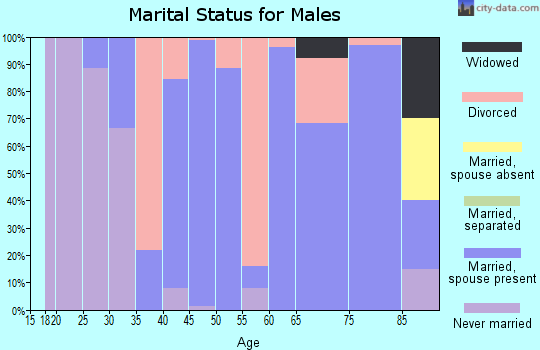
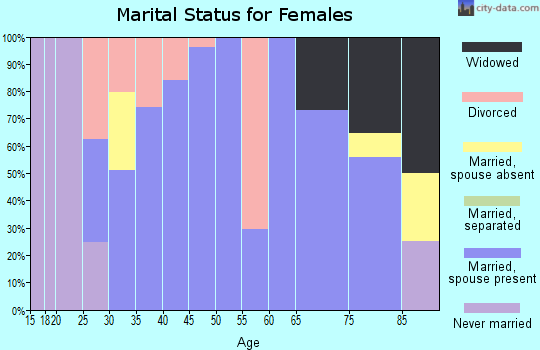
For population 15 years and over in 66020:
Never married: 21.3%
Now married: 56.2%
Separated: 0.0%
Widowed: 17.0%
Divorced: 5.5%
Zip code 66020 compared to state average:
Unemployed percentage below state average.
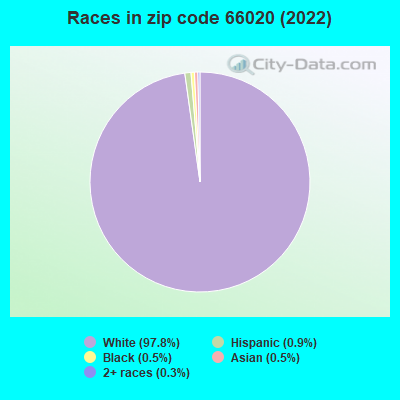
Black race population percentage significantly below state average.
Hispanic race population percentage significantly below state average.
Median age significantly above state average.
Foreign-born population percentage significantly below state average.
Renting percentage significantly below state average.
Length of stay since moving in significantly above state average.
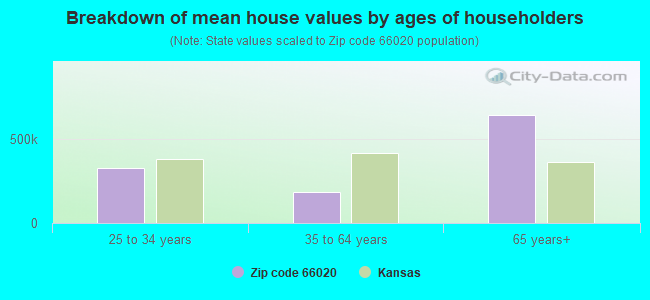
Estimated median house/condo value in 2022: $307,335
66020:
$307,335
Kansas:
$206,600
According to our research of Kansas and other state lists, there was 1 registered sex offender living in 66020 zip code as of April 27, 2024. The ratio of all residents to sex offenders in zip code 66020 is 1,545 to 1. The ratio of registered sex offenders to all residents in this zip code is much lower than the state average.
Median resident age:
This zip code:
47.5 years
Kansas median age:
37.6 years
Average household size:
This zip code:
3.2 people
Kansas:
2.4 people
Averages for the 2020 tax year for zip code 66020, filed in 2021:
Average Adjusted Gross Income (AGI) in 2020: $70,619 (Individual Income Tax Returns)
Here:
$70,619
State:
$72,721
Salary/wage: $62,960 (reported on 75.0% of returns)
Here:
$62,960
State:
$58,641
(% of AGI for various income ranges: 1175.4% for AGIs below $25k, 3351.7% for AGIs $25k-50k, 6024.4% for AGIs $50k-75k, 8511.4% for AGIs $75k-100k, 15667.3% for AGIs $100k-200k)
Taxable interest for individuals: $940 (reported on 43.8% of returns)
This zip code:
$940
Kansas:
$1,625
(% of AGI for various income ranges: 16.9% for AGIs below $25k, 18.3% for AGIs $25k-50k, 86.7% for AGIs $50k-75k, 78.6% for AGIs $75k-100k, 94.5% for AGIs $100k-200k)
Ordinary dividends: $3,750 (reported on 20.0% of returns)
Here:
$3,750
State:
$7,290
(% of AGI for various income ranges: 55.0% for AGIs $25k-50k, 68.6% for AGIs $75k-100k, 116.4% for AGIs $100k-200k)
Net capital gain/loss in AGI: +$9,975 (reported on 20.0% of returns)
Here:
+$9,975
State:
+$20,511
(% of AGI for various income ranges: 68.3% for AGIs $25k-50k, 185.6% for AGIs $50k-75k, 274.3% for AGIs $75k-100k, 1050.0% for AGIs $100k-200k)
Profit/loss from business: +$10,142 (reported on 15.0% of returns)
Here:
+$10,142
State:
+$13,852
(% of AGI for various income ranges: 215.8% for AGIs $25k-50k, 516.7% for AGIs $50k-75k, 448.2% for AGIs $100k-200k)
Taxable individual retirement arrangement distribution: $16,670 (reported on 12.5% of returns)
66020:
$16,670
Kansas:
$19,921
(% of AGI for various income ranges: 305.8% for AGIs $25k-50k, 646.7% for AGIs $50k-75k, 652.7% for AGIs $100k-200k)
Total itemized deductions: $29,186 (reported on 8.8% of returns)
Here:
$29,186
State:
$36,939
(% of AGI for various income ranges: 560.0% for AGIs $25k-50k, 1246.4% for AGIs $100k-200k)
Charity contributions: $7,300 (reported on 5.0% of returns)
Here:
$7,300
State:
$15,443
(% of AGI for various income ranges: 265.5% for AGIs $100k-200k)
Taxes paid: $7,386 (reported on 8.8% of returns)
66020:
$7,386
State:
$8,001
(% of AGI for various income ranges: 119.2% for AGIs $25k-50k, 340.0% for AGIs $100k-200k)
Earned income credit: $1,857 (reported on 8.8% of returns)
Here:
$1,857
State:
$2,267
(% of AGI for various income ranges: 70.0% for AGIs below $25k, 32.5% for AGIs $25k-50k)
Percentage of individuals using paid preparers for their 2020 taxes: 95.0%
Here:
95%
State:
95%
(% for various income ranges: 94.7% for AGIs below $25k, 100.0% for AGIs $25k-50k, 92.9% for AGIs $50k-75k, 90.9% for AGIs $75k-100k, 94.1% for AGIs $100k-200k, 100.0% for AGIs over 200k)
Averages for the 2012 tax year for zip code 66020, filed in 2013:
Average Adjusted Gross Income (AGI) in 2012: $54,506 (Individual Income Tax Returns)
Here:
$54,506
State:
$60,095
Salary/wage: $46,890 (reported on 80.8% of returns)
Here:
$46,890
State:
$48,770
(% of AGI for various income ranges: 67.1% for AGIs below $25k, 70.8% for AGIs $25k-50k, 74.7% for AGIs $50k-75k, 72.4% for AGIs $75k-100k, 65.4% for AGIs $100k-200k)
Taxable interest for individuals: $1,071 (reported on 39.7% of returns)
This zip code:
$1,071
Kansas:
$1,506
(% of AGI for various income ranges: 1.3% for AGIs below $25k, 0.9% for AGIs $25k-50k, 0.4% for AGIs $50k-75k, 0.5% for AGIs $75k-100k, 1.0% for AGIs $100k-200k)
Ordinary dividends: $1,213 (reported on 19.2% of returns)
Here:
$1,213
State:
$6,093
(% of AGI for various income ranges: 0.7% for AGIs below $25k, 0.4% for AGIs $25k-50k, 0.6% for AGIs $50k-75k, 0.5% for AGIs $100k-200k)
Net capital gain/loss in AGI: +$2,500 (reported on 16.7% of returns)
Here:
+$2,500
State:
+$14,598
(% of AGI for various income ranges: 0.5% for AGIs $25k-50k, 0.8% for AGIs $50k-75k, 1.1% for AGIs $75k-100k, 0.8% for AGIs $100k-200k)
Profit/loss from business: +$6,117 (reported on 15.4% of returns)
Here:
+$6,117
State:
+$12,554
(% of AGI for various income ranges: 4.1% for AGIs below $25k, 1.8% for AGIs $25k-50k, 1.3% for AGIs $50k-75k, 3.0% for AGIs $75k-100k, 0.8% for AGIs $100k-200k)
Taxable individual retirement arrangement distribution: $14,600 (reported on 11.5% of returns)
66020:
$14,600
Kansas:
$14,098
Total itemized deductions: $19,088 (21% of AGI, reported on 32.1% of returns)
Here:
$19,088
State:
$23,678
Here:
21.0% of AGI
State:
18.9% of AGI
(% of AGI for various income ranges: 13.4% for AGIs $25k-50k, 11.5% for AGIs $50k-75k, 11.3% for AGIs $75k-100k, 12.3% for AGIs $100k-200k)
Charity contributions: $3,235 (reported on 25.6% of returns)
Here:
$3,235
State:
$5,321
(% of AGI for various income ranges: 1.6% for AGIs $25k-50k, 1.8% for AGIs $50k-75k, 1.0% for AGIs $75k-100k, 1.9% for AGIs $100k-200k)
Taxes paid: $6,600 (reported on 32.1% of returns)
66020:
$6,600
State:
$9,548
(% of AGI for various income ranges: 2.9% for AGIs $25k-50k, 3.6% for AGIs $50k-75k, 4.0% for AGIs $75k-100k, 5.1% for AGIs $100k-200k)
Earned income credit: $2,089 (reported on 11.5% of returns)
Here:
$2,089
State:
$2,212
(% of AGI for various income ranges: 4.9% for AGIs below $25k, 0.6% for AGIs $25k-50k)
Percentage of individuals using paid preparers for their 2012 taxes: 62.8%
Here:
63%
State:
56%
(% for various income ranges: 51.9% for AGIs below $25k, 64.7% for AGIs $25k-50k, 69.2% for AGIs $50k-75k, 70.0% for AGIs $75k-100k, 72.7% for AGIs $100k-200k)
Averages for the 2004 tax year for zip code 66020, filed in 2005:
Average Adjusted Gross Income (AGI) in 2004: $49,987 (Individual Income Tax Returns)
Here:
$49,987
State:
$45,726
Salary/wage: $43,764 (reported on 85.0% of returns)
Here:
$43,764
State:
$40,112
(% of AGI for various income ranges: 115.7% for AGIs below $10k, 70.0% for AGIs $10k-25k, 77.9% for AGIs $25k-50k, 87.4% for AGIs $50k-75k, 81.5% for AGIs $75k-100k, 58.0% for AGIs over 100k)
Taxable interest for individuals: $1,631 (reported on 53.4% of returns)
This zip code:
$1,631
Kansas:
$1,749
(% of AGI for various income ranges: 9.3% for AGIs below $10k, 4.6% for AGIs $10k-25k, 2.0% for AGIs $25k-50k, 0.7% for AGIs $50k-75k, 1.2% for AGIs $75k-100k, 1.8% for AGIs over 100k)
Taxable dividends: $1,066 (reported on 20.5% of returns)
Here:
$1,066
State:
$3,066
(% of AGI for various income ranges: 0.6% for AGIs below $10k, 1.1% for AGIs $10k-25k, 1.0% for AGIs $25k-50k, 0.3% for AGIs $50k-75k, 0.2% for AGIs $75k-100k, 0.3% for AGIs over 100k)
Net capital gain/loss: +$4,949 (reported on 18.3% of returns)
Here:
+$4,949
State:
+$7,555
(% of AGI for various income ranges: 0.0% for AGIs below $10k, 1.3% for AGIs $10k-25k, 2.0% for AGIs $25k-50k, 1.0% for AGIs $50k-75k, 1.2% for AGIs $75k-100k, 2.9% for AGIs over 100k)
Profit/loss from business: +$4,412 (reported on 13.1% of returns)
Here:
+$4,412
State:
+$9,571
(% of AGI for various income ranges: 6.2% for AGIs below $10k, -0.7% for AGIs $10k-25k, 0.4% for AGIs $25k-50k, -0.1% for AGIs $50k-75k, 4.8% for AGIs $75k-100k)
IRA payment deduction: $2,267 (reported on 2.0% of returns)
66020:
$2,267
Kansas:
$2,922
Total itemized deductions: $15,664 (17% of AGI, reported on 34.5% of returns)
Here:
$15,664
State:
$18,779
Here:
17.3% of AGI
State:
20.5% of AGI
(% of AGI for various income ranges: 11.2% for AGIs $10k-25k, 7.1% for AGIs $25k-50k, 11.9% for AGIs $50k-75k, 13.4% for AGIs $75k-100k, 10.5% for AGIs over 100k)
Charity contributions deductions: $2,234 (2% of AGI, reported on 29.9% of returns)
Here:
$2,234
State:
$3,892
Here:
2.3% of AGI
State:
4.0% of AGI
(% of AGI for various income ranges: 1.7% for AGIs $10k-25k, 0.8% for AGIs $25k-50k, 1.5% for AGIs $50k-75k, 1.4% for AGIs $75k-100k, 1.4% for AGIs over 100k)
Total tax: $6,405 (reported on 78.6% of returns)
66020:
$6,405
State:
$7,203
(% of AGI for various income ranges: 2.3% for AGIs below $10k, 3.8% for AGIs $10k-25k, 6.6% for AGIs $25k-50k, 7.9% for AGIs $50k-75k, 10.4% for AGIs $75k-100k, 14.7% for AGIs over 100k)
Earned income credit: $1,692 (reported on 8.8% of returns)
Here:
$1,692
State:
$1,674
Percentage of individuals using paid preparers for their 2004 taxes: 66.0%
Here:
66%
State:
63%
(% for various income ranges: 52.4% for AGIs below $10k, 64.6% for AGIs $10k-25k, 68.8% for AGIs $25k-50k, 75.7% for AGIs $50k-75k, 67.7% for AGIs $75k-100k, 69.6% for AGIs over 100k)
Household received Food Stamps/SNAP in the past 12 months: 4 Household did not receive Food Stamps/SNAP in the past 12 months: 563
Women who had a birth in the past 12 months: 16 (16 now married, 0 unmarried) Women who did not have a birth in the past 12 months: 350 (172 now married, 177 unmarried)
Housing units in zip code 66020 with a mortgage: 354 (28 second mortgage, 18 both second mortgage and home equity loan) Median monthly owner costs for units with a mortgage: $1,809 Median monthly owner costs for units without a mortgage: $654
Residents with income below the poverty level in 2022:
This zip code:
4.8%
Whole state:
12.0%
Residents with income below 50% of the poverty level in 2022:
This zip code:
0.7%
Whole state:
6.4%
Median number of rooms in houses and condos:
Here:
7.0
State:
6.9
Median number of rooms in apartments:
Here:
5.8
State:
4.4
Notable locations in this zip code not listed on our city pages
Notable locations in zip code 66020: Easton Sewer Treatment Plant (A), Country Care Nursing Home (B), Kickapoo Township Fire Department Station 1 (C), Easton Township Fire Department (D). Display/hide their locations on the map
Cemeteries: Evergreen Cemetery (1), Oak Hill Cemetery (2), Bethel Cemetery (3), Saint Thomas Cemetery (4), Saint Lawrence Cemetery (5), Langley Cemetery (6), Easton Cemetery (7). Display/hide their locations on the map
Creeks: Buckhorn Creek (A), Cramer Creek (B), West Brush Creek (C), Dawson Creek (D), Buttermilk Creek (E), Walnut Creek (F), Branch Creek (G). Display/hide their locations on the map
In group quarters: 44 (-1 institutionalized population)
Size of family households: 169 2-persons, 82 3-persons, 88 4-persons, 27 5-persons, 79 6-persons
Size of nonfamily households: 117 1-person, 10 2-persons
358 married couples with children.
20 single-parent households (20 women).
98.2% of residents of 66020 zip code speak English at home.
1.3% of residents speak other Indo-European language at home (100% very well).
0.4% of residents speak Asian or Pacific Island language at home (71% very well, 29% well).
0.5% of residents speak other language at home (100% very well).
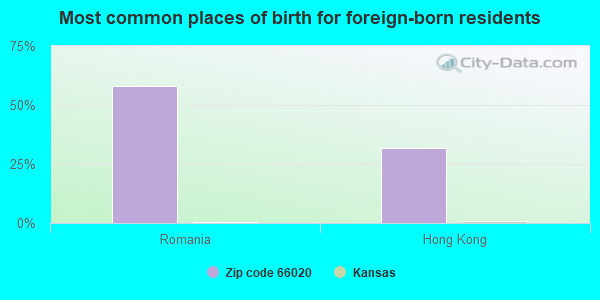
Foreign born population: 18 (1.0%) (67.7% of them are naturalized citizens)
This zip code:
1.0%
Whole state:
7.1%
58%Romania
32%Hong Kong
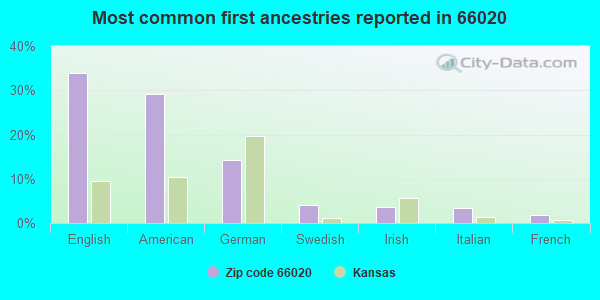
34%English
29%American
14%German
4%Swedish
4%Irish
3%Italian
2%French
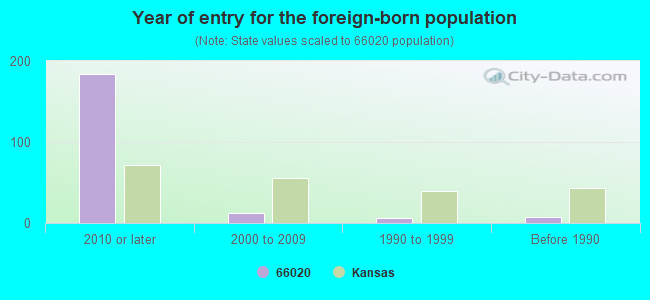
Year of entry for the foreign-born population
1842010 or later
122000 to 2009
61990 to 1999
8Before 1990
Facilities with environmental interests located in this zip code:
KOCH CONVENIENCE STORE (21315 EASTON ROAD in EASTON, KS)
STATE MASTER (Kansas Facility Profiler) - WWT-C-KS13-NO03, WASTEWATER FACILITY National Pollutant Discharge Elimination System NON-MAJOR (Tracking pollutant discharge elimination systems) - permit Organizations: DANIEL O & CYNTHIA A KOCH (CONTACT/OWNER)
Alternative names: DANIEL O. & CYNTHIA A. KOCH
N.R. HAMM QUARRY, INC. (S7-T8S-R21E in EASTON, KS)
AIR SYNTHETIC MINOR (AIRS/AFS) STATE MASTER (Kansas Facility Profiler) - ISTEPS-10300119, AIR MINOR CRITERIA AND HAZARDOUS AIR POLLUTANT INVENTORY (Inventory of air pollution sources) Business SIC and NAICS classification: CRUSHED AND BROKEN LIMESTONE
N R HAMM QUARRY (32521 231ST STREET in EASTON, KS)
National Pollutant Discharge Elimination System NON-MAJOR (Tracking pollutant discharge elimination systems) - permit Business SIC classification: CRUSHED AND BROKEN LIMESTONE Organizations: N. R. HAMM QUARRY,INC (CONTACT/OWNER)
, N. R. HAMM QUARRY, INC. (CONTACT/OWNER)
Alternative names: HAMM N R QUARRIES INC NO 66 PE
USD #449 PLEASANT RIDGE -EASTO (32500-32504 EASTON ROAD in EASTON, KS)
National Pollutant Discharge Elimination System NON-MAJOR (Tracking pollutant discharge elimination systems) - permit Business SIC classification: ELEMENTARY AND SECONDARY SCHOOLS Organizations: USD #449 PLEASANT RIDGE - EAST (CONTACT/OWNER)
Alternative names: USD #449 PLEASANT RIDGE - EAST
Housing units lacking complete plumbing facilities: 9.0% Housing units lacking complete kitchen facilities: 8.3%
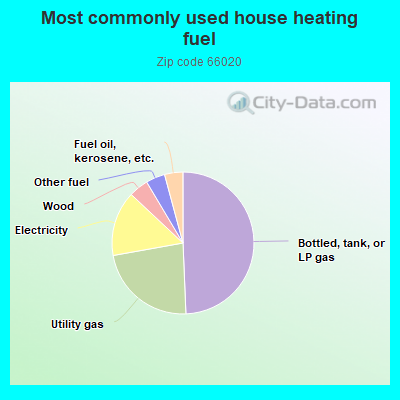
49.7%Bottled, tank, or LP gas
23.0%Utility gas
14.9%Electricity
4.5%Wood
4.4%Other fuel
4.2%Fuel oil, kerosene, etc.
Population in 1990: 2,801.
Place of birth for U.S.-born residents:
This state: 1,081
Northeast: 83
Midwest: 251
South: 156
West: 80
57% of the 66020 zip code residents lived in the same house 5 years ago. Out of people who lived in different houses, 75% lived in this county. Out of people who lived in different counties, 50% lived in Kansas.
93% of the 66020 zip code residents lived in the same house 1 year ago. Out of people who lived in different houses, 26% moved from this county. Out of people who lived in different houses, 78% moved from different county within same state. Out of people who lived in different houses, 3% moved from different state.
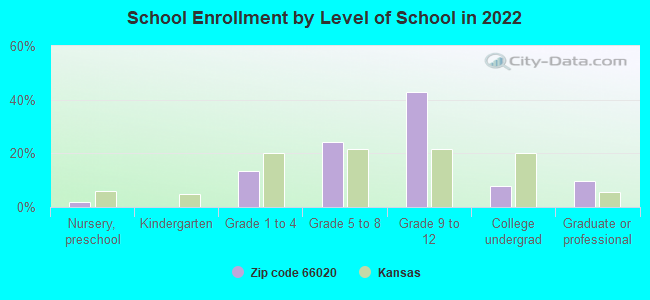
Private vs. public school enrollment:
Students in private schools in grades 1 to 8 (elementary and middle school): 32
Here:
19.1%
Kansas:
14.1%
Students in private schools in grades 9 to 12 (high school): 12
Here:
6.8%
Kansas:
10.8%
Students in private undergraduate colleges:
Here:
0.0%
Kansas:
15.4%
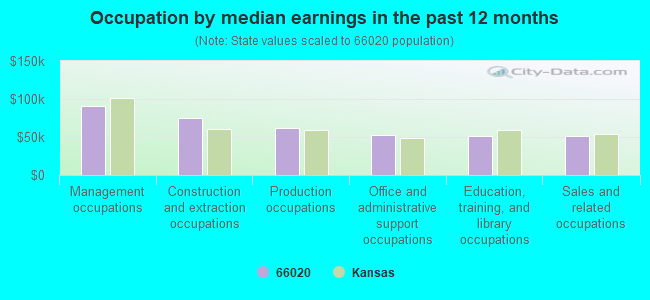
Occupation by median earnings in the past 12 months ($)
90,490Management occupations
74,615Construction and extraction occupations
62,041Production occupations
53,232Office and administrative support occupations
51,525Education, training, and library occupations
51,273Sales and related occupations
Companies with federal contracts located in this zip code:
WASS DE CZEGE CONSULTING (22247 TURNER ROAD in EASTON, KS; small business) : $427,113 in 6 contractsfrom 2000 to 2003
Contracts for Other Professional Services, Personal Services Contracts, Defense Studies by Army Signed by year:2000: $192,588; 2001: $30,000; 2002: $144,525; 2003: $60,000; 2004: $0; 2005: $0; 2006: $0.
Biggest contracts:
$150,000 with Army for Other Professional Services. Taking place in VA. Signed on 2002-01-23. Completion date: 2002-12-31.
$100,000 with Army for Personal Services Contracts. Taking place in VA. Signed on 2000-12-05. Completion date: 2001-11-01.
$92,588, same as above.Signed on 2000-03-13. Completion date: 2000-09-30.
$60,000 with Army for Other Professional Services. Taking place in VA. Signed on 2003-03-31. Completion date: 2003-05-31.
CULBERTSON WANDA (22045 MILLWOOD RD in EASTON, KS; small business) : $94,263 in 11 contractsfrom 2002 to 2006
Contracts for Other Education and Training Services, Education Services by Army Signed by year:2000: $0; 2001: $0; 2002: $9,484; 2003: $29,966; 2004: $29,966; 2005: $6,283; 2006: $18,564.
Biggest contracts:
$29,966 with Army for Other Education and Training Services. Signed on 2004-11-16. Completion date: 2005-09-30.
$29,966 with Army for Education Services. Signed on 2003-10-01. Completion date: 2004-09-30.
$16,065, same as above.Signed on 2006-02-28. Completion date: 2006-09-30.
$9,484, same as above.Signed on 2002-06-14. Completion date: 2002-09-30.
Top industries in this zip code by the number of employees in 2005:
Health Care and Social Assistance: Nursing Care Facilities (50-99 employees: 1 establishment, 10-19 employees: 1 establishment)
Other Services (except Public Administration): Religious Organizations (5-9: 1, 1-4: 1)
Finance and Insurance: Commercial Banking (5-9: 1)
Construction: Highway, Street, and Bridge Construction (5-9: 1)
Administrative and Support and Waste Management and Remediation Services: Janitorial Services (1-4: 1)
Construction: Siding Contractors (1-4: 1)
Real Estate and Rental and Leasing: Other Activities Related to Real Estate (1-4: 1)
Professional, Scientific, and Technical Services: Veterinary Services (1-4: 1)
People in group quarters in 2010:
45 people in nursing facilities/skilled-nursing facilities
People in group quarters in 2000:
50 people in nursing homes
Fatal accident statistics in 2012:
Fatal accident count: 1
Vehicles involved in fatal accidents: 1
Fatal accidents caused by drunken drivers: 1
Fatalities: 1
Persons involved in fatal accidents: 1
Pedestrians involved in fatal accidents: 0
Fatal accident statistics in 2011:
Fatal accident count: 1
Vehicles involved in fatal accidents: 1
Fatal accidents caused by drunken drivers: 1
Fatalities: 1
Persons involved in fatal accidents: 2
Pedestrians involved in fatal accidents: 0
Home Mortgage Disclosure Act Aggregated Statistics For Year 2009 (Based on 4 partial tracts)
A) FHA, FSA/RHS & VA Home Purchase Loans
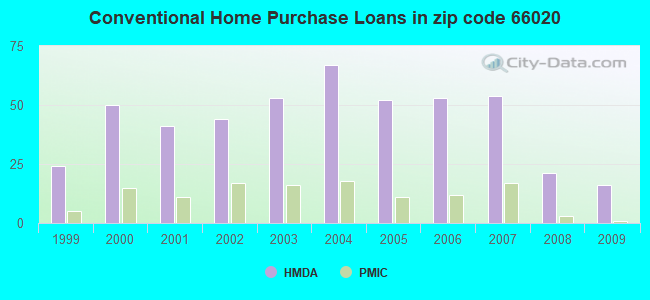
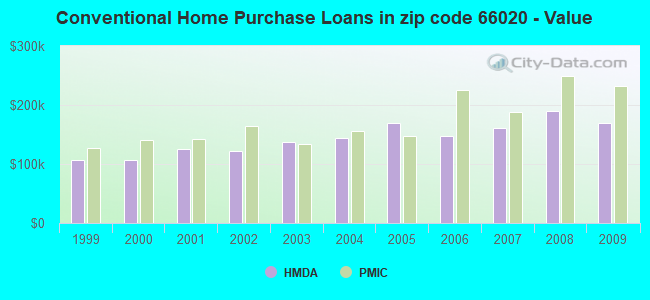
B) Conventional Home Purchase Loans
C) Refinancings
D) Home Improvement Loans
F) Non-occupant Loans on < 5 Family Dwellings (A B C & D)
G) Loans On Manufactured Home Dwelling (A B C & D)
Number
Average Value
Number
Average Value
Number
Average Value
Number
Average Value
Number
Average Value
Number
Average Value
LOANS ORIGINATED
22
$192,784
16
$169,477
149
$166,373
15
$99,400
5
$162,340
1
$32,260
APPLICATIONS APPROVED, NOT ACCEPTED
0
$0
0
$0
10
$175,950
1
$25,220
1
$193,090
0
$0
APPLICATIONS DENIED
0
$0
8
$128,758
39
$184,248
3
$27,010
5
$58,852
1
$75,720
APPLICATIONS WITHDRAWN
2
$364,955
3
$71,090
19
$185,491
0
$0
2
$122,790
1
$207,250
FILES CLOSED FOR INCOMPLETENESS
0
$0
0
$0
2
$181,645
0
$0
0
$0
0
$0
Aggregated Statistics For Year 2008 (Based on 4 partial tracts)
A) FHA, FSA/RHS & VA Home Purchase Loans
B) Conventional Home Purchase Loans
C) Refinancings
D) Home Improvement Loans
F) Non-occupant Loans on < 5 Family Dwellings (A B C & D)
G) Loans On Manufactured Home Dwelling (A B C & D)
Number
Average Value
Number
Average Value
Number
Average Value
Number
Average Value
Number
Average Value
Number
Average Value
LOANS ORIGINATED
18
$186,886
21
$190,350
90
$149,228
19
$75,047
10
$127,301
4
$120,968
APPLICATIONS APPROVED, NOT ACCEPTED
0
$0
1
$136,860
6
$166,542
0
$0
0
$0
0
$0
APPLICATIONS DENIED
3
$126,680
6
$114,340
41
$177,141
7
$47,510
1
$105,580
7
$108,670
APPLICATIONS WITHDRAWN
3
$157,373
1
$90,180
19
$147,499
2
$126,630
0
$0
1
$46,160
FILES CLOSED FOR INCOMPLETENESS
0
$0
1
$383,220
1
$224,810
0
$0
0
$0
0
$0
Aggregated Statistics For Year 2007 (Based on 4 partial tracts)
A) FHA, FSA/RHS & VA Home Purchase Loans
B) Conventional Home Purchase Loans
C) Refinancings
D) Home Improvement Loans
E) Loans on Dwellings For 5+ Families
F) Non-occupant Loans on < 5 Family Dwellings (A B C & D)
G) Loans On Manufactured Home Dwelling (A B C & D)
Number
Average Value
Number
Average Value
Number
Average Value
Number
Average Value
Number
Average Value
Number
Average Value
Number
Average Value
LOANS ORIGINATED
8
$211,332
54
$161,621
92
$147,388
25
$58,240
1
$107,540
7
$125,107
5
$71,514
APPLICATIONS APPROVED, NOT ACCEPTED
0
$0
4
$82,725
18
$173,631
3
$61,590
0
$0
0
$0
1
$95,400
APPLICATIONS DENIED
1
$53,770
12
$140,819
60
$161,956
13
$99,014
0
$0
3
$135,613
4
$87,260
APPLICATIONS WITHDRAWN
1
$214,090
6
$155,667
28
$156,603
5
$117,904
0
$0
1
$319,550
0
$0
FILES CLOSED FOR INCOMPLETENESS
0
$0
0
$0
9
$177,533
2
$124,415
0
$0
1
$76,250
0
$0
Aggregated Statistics For Year 2006 (Based on 4 partial tracts)
A) FHA, FSA/RHS & VA Home Purchase Loans
B) Conventional Home Purchase Loans
C) Refinancings
D) Home Improvement Loans
F) Non-occupant Loans on < 5 Family Dwellings (A B C & D)
G) Loans On Manufactured Home Dwelling (A B C & D)
Number
Average Value
Number
Average Value
Number
Average Value
Number
Average Value
Number
Average Value
Number
Average Value
LOANS ORIGINATED
17
$197,992
53
$148,045
105
$125,499
30
$60,668
13
$66,315
8
$121,269
APPLICATIONS APPROVED, NOT ACCEPTED
0
$0
7
$135,183
20
$138,832
6
$33,392
0
$0
1
$108,380
APPLICATIONS DENIED
0
$0
13
$147,457
74
$137,086
8
$37,249
3
$176,660
2
$106,615
APPLICATIONS WITHDRAWN
0
$0
9
$159,862
42
$136,042
4
$125,102
2
$43,810
0
$0
FILES CLOSED FOR INCOMPLETENESS
1
$210,180
1
$166,690
6
$182,867
0
$0
0
$0
0
$0
Aggregated Statistics For Year 2005 (Based on 4 partial tracts)
A) FHA, FSA/RHS & VA Home Purchase Loans
B) Conventional Home Purchase Loans
C) Refinancings
D) Home Improvement Loans
F) Non-occupant Loans on < 5 Family Dwellings (A B C & D)
G) Loans On Manufactured Home Dwelling (A B C & D)
Number
Average Value
Number
Average Value
Number
Average Value
Number
Average Value
Number
Average Value
Number
Average Value
LOANS ORIGINATED
14
$184,877
52
$169,774
124
$131,789
29
$60,061
12
$138,886
6
$80,478
APPLICATIONS APPROVED, NOT ACCEPTED
0
$0
6
$140,528
17
$145,898
4
$23,980
2
$51,815
2
$137,355
APPLICATIONS DENIED
1
$175,970
14
$145,869
92
$165,498
22
$73,411
5
$128,302
4
$100,465
APPLICATIONS WITHDRAWN
4
$180,275
12
$123,890
51
$147,261
13
$111,704
4
$44,970
1
$276,180
FILES CLOSED FOR INCOMPLETENESS
0
$0
0
$0
16
$171,366
1
$117,310
0
$0
0
$0
Aggregated Statistics For Year 2004 (Based on 4 partial tracts)
A) FHA, FSA/RHS & VA Home Purchase Loans
B) Conventional Home Purchase Loans
C) Refinancings
D) Home Improvement Loans
F) Non-occupant Loans on < 5 Family Dwellings (A B C & D)
G) Loans On Manufactured Home Dwelling (A B C & D)
Number
Average Value
Number
Average Value
Number
Average Value
Number
Average Value
Number
Average Value
Number
Average Value
LOANS ORIGINATED
13
$160,778
67
$143,595
149
$127,731
20
$58,518
12
$101,346
7
$96,207
APPLICATIONS APPROVED, NOT ACCEPTED
0
$0
5
$140,774
20
$118,140
2
$11,240
0
$0
0
$0
APPLICATIONS DENIED
2
$120,245
16
$160,657
73
$143,292
7
$59,506
1
$118,380
6
$131,952
APPLICATIONS WITHDRAWN
0
$0
7
$156,871
60
$124,657
6
$79,280
3
$144,673
0
$0
FILES CLOSED FOR INCOMPLETENESS
0
$0
2
$93,595
24
$159,020
0
$0
0
$0
1
$225,720
Aggregated Statistics For Year 2003 (Based on 4 partial tracts)
A) FHA, FSA/RHS & VA Home Purchase Loans
B) Conventional Home Purchase Loans
C) Refinancings
D) Home Improvement Loans
F) Non-occupant Loans on < 5 Family Dwellings (A B C & D)
Number
Average Value
Number
Average Value
Number
Average Value
Number
Average Value
Number
Average Value
LOANS ORIGINATED
17
$143,065
53
$136,676
273
$113,823
12
$20,615
16
$73,328
APPLICATIONS APPROVED, NOT ACCEPTED
1
$153,980
4
$89,612
21
$105,889
1
$14,960
0
$0
APPLICATIONS DENIED
1
$281,860
15
$104,049
101
$133,983
6
$23,177
5
$139,324
APPLICATIONS WITHDRAWN
2
$134,190
4
$114,275
80
$145,498
1
$34,220
1
$84,070
FILES CLOSED FOR INCOMPLETENESS
0
$0
0
$0
7
$99,660
0
$0
0
$0
Aggregated Statistics For Year 2002 (Based on 4 partial tracts)
A) FHA, FSA/RHS & VA Home Purchase Loans
B) Conventional Home Purchase Loans
C) Refinancings
D) Home Improvement Loans
F) Non-occupant Loans on < 5 Family Dwellings (A B C & D)
Number
Average Value
Number
Average Value
Number
Average Value
Number
Average Value
Number
Average Value
LOANS ORIGINATED
8
$156,740
44
$122,459
203
$120,441
14
$13,826
7
$87,019
APPLICATIONS APPROVED, NOT ACCEPTED
0
$0
2
$103,430
20
$92,700
3
$36,127
0
$0
APPLICATIONS DENIED
0
$0
7
$80,333
43
$100,660
9
$17,519
1
$97,760
APPLICATIONS WITHDRAWN
0
$0
6
$81,763
61
$121,266
2
$65,065
3
$43,340
FILES CLOSED FOR INCOMPLETENESS
0
$0
2
$147,620
21
$119,852
0
$0
0
$0
Aggregated Statistics For Year 2001 (Based on 4 partial tracts)
A) FHA, FSA/RHS & VA Home Purchase Loans
B) Conventional Home Purchase Loans
C) Refinancings
D) Home Improvement Loans
F) Non-occupant Loans on < 5 Family Dwellings (A B C & D)
Number
Average Value
Number
Average Value
Number
Average Value
Number
Average Value
Number
Average Value
LOANS ORIGINATED
9
$144,744
41
$125,732
164
$95,188
20
$25,578
6
$54,172
APPLICATIONS APPROVED, NOT ACCEPTED
0
$0
2
$108,750
14
$115,265
0
$0
0
$0
APPLICATIONS DENIED
0
$0
8
$103,314
41
$104,543
4
$30,365
1
$97,760
APPLICATIONS WITHDRAWN
1
$107,280
7
$89,053
47
$107,478
3
$6,107
2
$81,340
FILES CLOSED FOR INCOMPLETENESS
0
$0
0
$0
7
$88,509
0
$0
1
$62,830
Aggregated Statistics For Year 2000 (Based on 4 partial tracts)
A) FHA, FSA/RHS & VA Home Purchase Loans
B) Conventional Home Purchase Loans
C) Refinancings
D) Home Improvement Loans
F) Non-occupant Loans on < 5 Family Dwellings (A B C & D)
Number
Average Value
Number
Average Value
Number
Average Value
Number
Average Value
Number
Average Value
LOANS ORIGINATED
5
$123,128
50
$106,399
64
$85,529
26
$15,790
12
$63,678
APPLICATIONS APPROVED, NOT ACCEPTED
0
$0
4
$97,340
5
$93,980
2
$13,715
0
$0
APPLICATIONS DENIED
1
$131,010
16
$53,013
25
$69,465
11
$16,961
0
$0
APPLICATIONS WITHDRAWN
0
$0
5
$135,588
15
$79,147
0
$0
1
$87,980
FILES CLOSED FOR INCOMPLETENESS
0
$0
1
$72,230
7
$81,284
0
$0
0
$0
Aggregated Statistics For Year 1999 (Based on 2 partial tracts)
A) FHA, FSA/RHS & VA Home Purchase Loans
B) Conventional Home Purchase Loans
C) Refinancings
D) Home Improvement Loans
F) Non-occupant Loans on < 5 Family Dwellings (A B C & D)
Detailed PMIC statistics for the following Tracts:0709.00
, 0710.00
2002 - 2018 National Fire Incident Reporting System (NFIRS) incidents
Based on the data from the years 2002 - 2018 the average number of fire incidents per year is 18. The highest number of reported fires - 50 took place in 2018, and the least - 3 in 2011. The data has a rising trend.
When looking into fire subcategories, the most incidents belonged to: Outside Fires (55.9%), and Structure Fires (31.6%).
Fire incident types reported to NFIRS in Zip Code 66020
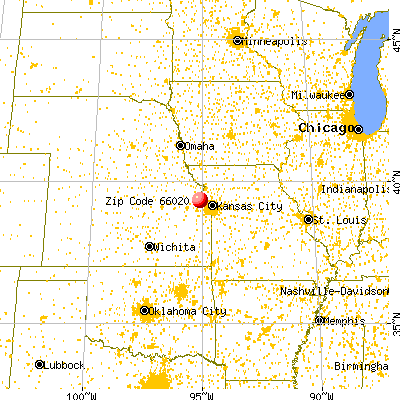


 Nearest zip codes: 66097, 66048, 66054, 66016, 66002, 66027.
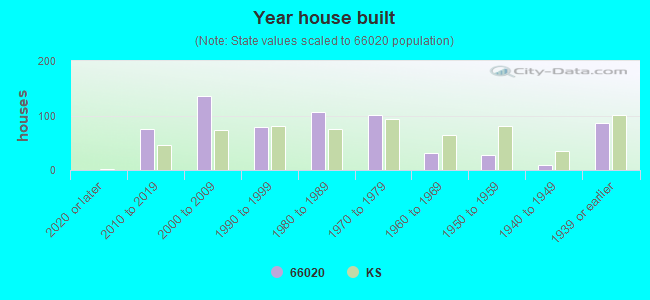


 Based on the data from the years 2002 - 2018 the average number of fire incidents per year is 18. The highest number of reported fires - 50 took place in 2018, and the least - 3 in 2011. The data has a rising trend.
 When looking into fire subcategories, the most incidents belonged to: Outside Fires (55.9%), and Structure Fires (31.6%).