Estimated zip code population in 2022: 27,674
Zip code population in 2010: 25,401
Zip code population in 2000: 27,452
Houses and condos: 11,457
Renter-occupied apartments: 3,386
% of renters here:
35%State:
32%
March 2022 cost of living index in zip code 66104: 85.6
(less than average, U.S. average is 100)
Land area: 16.1
sq. mi.
Water area: 0.7
sq. mi.
Population density: 1,716 people per square mile (low).
OSM Map
General Map
Google Map
MSN Map
OSM Map
General Map
Google Map
MSN Map
OSM Map
General Map
Google Map
MSN Map
OSM Map
General Map
Google Map
MSN Map
Please wait while loading the map...
Real estate property taxes paid for housing units in 2022:
This zip code:
1.2% ($1,493)Kansas:
1.2% ($2,578)
Median real estate property taxes paid for housing units with mortgages in 2022: $1,809 (1.4%)
Median real estate property taxes paid for housing units with no mortgage in 2022: $995 (1.1%)
Profiles of local businesses
Business Search - 14 Million verified businesses
Males: 13,527 Females: 14,148
For population 25 years and over in 66104:
High school or higher: 75.3%Bachelor's degree or higher: 11.3%Graduate or professional degree: 3.5%Unemployed: 6.2%Mean travel time to work (commute): 22.2 minutes
For population 15 years and over in 66104:
Never married: 36.5%Now married: 41.8%Separated: 2.6%Widowed: 6.1%Divorced: 13.0%
Zip code 66104 compared to state average:
Median house value below state average. Unemployed percentage above state average. Black race population percentage significantly above state average. Hispanic race population percentage above state average. Foreign-born population percentage significantly above state average. Length of stay since moving in significantly above state average. House age above state average. Number of college students below state average. Percentage of population with a bachelor's degree or higher significantly below state average. 9,678 35.0% Black 9,550 34.5% Hispanic or Latino 5,622 20.3% White 1,321 4.8% Asian 1,125 4.1% Two or more races 313 1.1% Some other race 51 0.2% American Indian 12 0.04% Native Hawaiian and Other
Data:
Median household income ($)
Median household income (% change since 2000)
Household income diversity
Ratio of average income to average house value (%)
Ratio of average income to average rent
Median household income ($) - White
Median household income ($) - Black or African American
Median household income ($) - Asian
Median household income ($) - Hispanic or Latino
Median household income ($) - American Indian and Alaska Native
Median household income ($) - Multirace
Median household income ($) - Other Race
Median household income for houses/condos with a mortgage ($)
Median household income for apartments without a mortgage ($)
Races - White alone (%)
Races - White alone (% change since 2000)
Races - Black alone (%)
Races - Black alone (% change since 2000)
Races - American Indian alone (%)
Races - American Indian alone (% change since 2000)
Races - Asian alone (%)
Races - Asian alone (% change since 2000)
Races - Hispanic (%)
Races - Hispanic (% change since 2000)
Races - Native Hawaiian and Other Pacific Islander alone (%)
Races - Native Hawaiian and Other Pacific Islander alone (% change since 2000)
Races - Two or more races (%)
Races - Two or more races (% change since 2000)
Races - Other race alone (%)
Races - Other race alone (% change since 2000)
Racial diversity
Unemployment (%)
Unemployment (% change since 2000)
Unemployment (%) - White
Unemployment (%) - Black or African American
Unemployment (%) - Asian
Unemployment (%) - Hispanic or Latino
Unemployment (%) - American Indian and Alaska Native
Unemployment (%) - Multirace
Unemployment (%) - Other Race
Population density (people per square mile)
Population - Males (%)
Population - Females (%)
Population - Males (%) - White
Population - Males (%) - Black or African American
Population - Males (%) - Asian
Population - Males (%) - Hispanic or Latino
Population - Males (%) - American Indian and Alaska Native
Population - Males (%) - Multirace
Population - Males (%) - Other Race
Population - Females (%) - White
Population - Females (%) - Black or African American
Population - Females (%) - Asian
Population - Females (%) - Hispanic or Latino
Population - Females (%) - American Indian and Alaska Native
Population - Females (%) - Multirace
Population - Females (%) - Other Race
Coronavirus confirmed cases (Apr 27, 2024)
Deaths caused by coronavirus (Apr 27, 2024)
Coronavirus confirmed cases (per 100k population) (Apr 27, 2024)
Deaths caused by coronavirus (per 100k population) (Apr 27, 2024)
Daily increase in number of cases (Apr 27, 2024)
Weekly increase in number of cases (Apr 27, 2024)
Cases doubled (in days) (Apr 27, 2024)
Hospitalized patients (Apr 18, 2022)
Negative test results (Apr 18, 2022)
Total test results (Apr 18, 2022)
COVID Vaccine doses distributed (per 100k population) (Sep 19, 2023)
COVID Vaccine doses administered (per 100k population) (Sep 19, 2023)
COVID Vaccine doses distributed (Sep 19, 2023)
COVID Vaccine doses administered (Sep 19, 2023)
Likely homosexual households (%)
Likely homosexual households (% change since 2000)
Likely homosexual households - Lesbian couples (%)
Likely homosexual households - Lesbian couples (% change since 2000)
Likely homosexual households - Gay men (%)
Likely homosexual households - Gay men (% change since 2000)
Cost of living index
Median gross rent ($)
Median contract rent ($)
Median monthly housing costs ($)
Median house or condo value ($)
Median house or condo value ($ change since 2000)
Mean house or condo value by units in structure - 1, detached ($)
Mean house or condo value by units in structure - 1, attached ($)
Mean house or condo value by units in structure - 2 ($)
Mean house or condo value by units in structure by units in structure - 3 or 4 ($)
Mean house or condo value by units in structure - 5 or more ($)
Mean house or condo value by units in structure - Boat, RV, van, etc. ($)
Mean house or condo value by units in structure - Mobile home ($)
Median house or condo value ($) - White
Median house or condo value ($) - Black or African American
Median house or condo value ($) - Asian
Median house or condo value ($) - Hispanic or Latino
Median house or condo value ($) - American Indian and Alaska Native
Median house or condo value ($) - Multirace
Median house or condo value ($) - Other Race
Median resident age
Resident age diversity
Median resident age - Males
Median resident age - Females
Median resident age - White
Median resident age - Black or African American
Median resident age - Asian
Median resident age - Hispanic or Latino
Median resident age - American Indian and Alaska Native
Median resident age - Multirace
Median resident age - Other Race
Median resident age - Males - White
Median resident age - Males - Black or African American
Median resident age - Males - Asian
Median resident age - Males - Hispanic or Latino
Median resident age - Males - American Indian and Alaska Native
Median resident age - Males - Multirace
Median resident age - Males - Other Race
Median resident age - Females - White
Median resident age - Females - Black or African American
Median resident age - Females - Asian
Median resident age - Females - Hispanic or Latino
Median resident age - Females - American Indian and Alaska Native
Median resident age - Females - Multirace
Median resident age - Females - Other Race
Commute - mean travel time to work (minutes)
Travel time to work - Less than 5 minutes (%)
Travel time to work - Less than 5 minutes (% change since 2000)
Travel time to work - 5 to 9 minutes (%)
Travel time to work - 5 to 9 minutes (% change since 2000)
Travel time to work - 10 to 19 minutes (%)
Travel time to work - 10 to 19 minutes (% change since 2000)
Travel time to work - 20 to 29 minutes (%)
Travel time to work - 20 to 29 minutes (% change since 2000)
Travel time to work - 30 to 39 minutes (%)
Travel time to work - 30 to 39 minutes (% change since 2000)
Travel time to work - 40 to 59 minutes (%)
Travel time to work - 40 to 59 minutes (% change since 2000)
Travel time to work - 60 to 89 minutes (%)
Travel time to work - 60 to 89 minutes (% change since 2000)
Travel time to work - 90 or more minutes (%)
Travel time to work - 90 or more minutes (% change since 2000)
Marital status - Never married (%)
Marital status - Now married (%)
Marital status - Separated (%)
Marital status - Widowed (%)
Marital status - Divorced (%)
Median family income ($)
Median family income (% change since 2000)
Median non-family income ($)
Median non-family income (% change since 2000)
Median per capita income ($)
Median per capita income (% change since 2000)
Median family income ($) - White
Median family income ($) - Black or African American
Median family income ($) - Asian
Median family income ($) - Hispanic or Latino
Median family income ($) - American Indian and Alaska Native
Median family income ($) - Multirace
Median family income ($) - Other Race
Median year house/condo built
Median year apartment built
Year house built - Built 2005 or later (%)
Year house built - Built 2000 to 2004 (%)
Year house built - Built 1990 to 1999 (%)
Year house built - Built 1980 to 1989 (%)
Year house built - Built 1970 to 1979 (%)
Year house built - Built 1960 to 1969 (%)
Year house built - Built 1950 to 1959 (%)
Year house built - Built 1940 to 1949 (%)
Year house built - Built 1939 or earlier (%)
Average household size
Household density (households per square mile)
Average household size - White
Average household size - Black or African American
Average household size - Asian
Average household size - Hispanic or Latino
Average household size - American Indian and Alaska Native
Average household size - Multirace
Average household size - Other Race
Occupied housing units (%)
Vacant housing units (%)
Owner occupied housing units (%)
Renter occupied housing units (%)
Vacancy status - For rent (%)
Vacancy status - For sale only (%)
Vacancy status - Rented or sold, not occupied (%)
Vacancy status - For seasonal, recreational, or occasional use (%)
Vacancy status - For migrant workers (%)
Vacancy status - Other vacant (%)
Residents with income below the poverty level (%)
Residents with income below 50% of the poverty level (%)
Children below poverty level (%)
Poor families by family type - Married-couple family (%)
Poor families by family type - Male, no wife present (%)
Poor families by family type - Female, no husband present (%)
Poverty status for native-born residents (%)
Poverty status for foreign-born residents (%)
Poverty among high school graduates not in families (%)
Poverty among people who did not graduate high school not in families (%)
Residents with income below the poverty level (%) - White
Residents with income below the poverty level (%) - Black or African American
Residents with income below the poverty level (%) - Asian
Residents with income below the poverty level (%) - Hispanic or Latino
Residents with income below the poverty level (%) - American Indian and Alaska Native
Residents with income below the poverty level (%) - Multirace
Residents with income below the poverty level (%) - Other Race
Air pollution - Air Quality Index (AQI)
Air pollution - CO
Air pollution - NO2
Air pollution - SO2
Air pollution - Ozone
Air pollution - PM10
Air pollution - PM25
Air pollution - Pb
Crime - Murders per 100,000 population
Crime - Rapes per 100,000 population
Crime - Robberies per 100,000 population
Crime - Assaults per 100,000 population
Crime - Burglaries per 100,000 population
Crime - Thefts per 100,000 population
Crime - Auto thefts per 100,000 population
Crime - Arson per 100,000 population
Crime - City-data.com crime index
Crime - Violent crime index
Crime - Property crime index
Crime - Murders per 100,000 population (5 year average)
Crime - Rapes per 100,000 population (5 year average)
Crime - Robberies per 100,000 population (5 year average)
Crime - Assaults per 100,000 population (5 year average)
Crime - Burglaries per 100,000 population (5 year average)
Crime - Thefts per 100,000 population (5 year average)
Crime - Auto thefts per 100,000 population (5 year average)
Crime - Arson per 100,000 population (5 year average)
Crime - City-data.com crime index (5 year average)
Crime - Violent crime index (5 year average)
Crime - Property crime index (5 year average)
1996 Presidential Elections Results (%) - Democratic Party (Clinton)
1996 Presidential Elections Results (%) - Republican Party (Dole)
1996 Presidential Elections Results (%) - Other
2000 Presidential Elections Results (%) - Democratic Party (Gore)
2000 Presidential Elections Results (%) - Republican Party (Bush)
2000 Presidential Elections Results (%) - Other
2004 Presidential Elections Results (%) - Democratic Party (Kerry)
2004 Presidential Elections Results (%) - Republican Party (Bush)
2004 Presidential Elections Results (%) - Other
2008 Presidential Elections Results (%) - Democratic Party (Obama)
2008 Presidential Elections Results (%) - Republican Party (McCain)
2008 Presidential Elections Results (%) - Other
2012 Presidential Elections Results (%) - Democratic Party (Obama)
2012 Presidential Elections Results (%) - Republican Party (Romney)
2012 Presidential Elections Results (%) - Other
2016 Presidential Elections Results (%) - Democratic Party (Clinton)
2016 Presidential Elections Results (%) - Republican Party (Trump)
2016 Presidential Elections Results (%) - Other
2020 Presidential Elections Results (%) - Democratic Party (Biden)
2020 Presidential Elections Results (%) - Republican Party (Trump)
2020 Presidential Elections Results (%) - Other
Ancestries Reported - Arab (%)
Ancestries Reported - Czech (%)
Ancestries Reported - Danish (%)
Ancestries Reported - Dutch (%)
Ancestries Reported - English (%)
Ancestries Reported - French (%)
Ancestries Reported - French Canadian (%)
Ancestries Reported - German (%)
Ancestries Reported - Greek (%)
Ancestries Reported - Hungarian (%)
Ancestries Reported - Irish (%)
Ancestries Reported - Italian (%)
Ancestries Reported - Lithuanian (%)
Ancestries Reported - Norwegian (%)
Ancestries Reported - Polish (%)
Ancestries Reported - Portuguese (%)
Ancestries Reported - Russian (%)
Ancestries Reported - Scotch-Irish (%)
Ancestries Reported - Scottish (%)
Ancestries Reported - Slovak (%)
Ancestries Reported - Subsaharan African (%)
Ancestries Reported - Swedish (%)
Ancestries Reported - Swiss (%)
Ancestries Reported - Ukrainian (%)
Ancestries Reported - United States (%)
Ancestries Reported - Welsh (%)
Ancestries Reported - West Indian (%)
Ancestries Reported - Other (%)
Educational Attainment - No schooling completed (%)
Educational Attainment - Less than high school (%)
Educational Attainment - High school or equivalent (%)
Educational Attainment - Less than 1 year of college (%)
Educational Attainment - 1 or more years of college (%)
Educational Attainment - Associate degree (%)
Educational Attainment - Bachelor's degree (%)
Educational Attainment - Master's degree (%)
Educational Attainment - Professional school degree (%)
Educational Attainment - Doctorate degree (%)
School Enrollment - Nursery, preschool (%)
School Enrollment - Kindergarten (%)
School Enrollment - Grade 1 to 4 (%)
School Enrollment - Grade 5 to 8 (%)
School Enrollment - Grade 9 to 12 (%)
School Enrollment - College undergrad (%)
School Enrollment - Graduate or professional (%)
School Enrollment - Not enrolled in school (%)
School enrollment - Public schools (%)
School enrollment - Private schools (%)
School enrollment - Not enrolled (%)
Median number of rooms in houses and condos
Median number of rooms in apartments
Housing units lacking complete plumbing facilities (%)
Housing units lacking complete kitchen facilities (%)
Density of houses
Urban houses (%)
Rural houses (%)
Households with people 60 years and over (%)
Households with people 65 years and over (%)
Households with people 75 years and over (%)
Households with one or more nonrelatives (%)
Households with no nonrelatives (%)
Population in households (%)
Family households (%)
Nonfamily households (%)
Population in families (%)
Family households with own children (%)
Median number of bedrooms in owner occupied houses
Mean number of bedrooms in owner occupied houses
Median number of bedrooms in renter occupied houses
Mean number of bedrooms in renter occupied houses
Median number of vehichles in owner occupied houses
Mean number of vehichles in owner occupied houses
Median number of vehichles in renter occupied houses
Mean number of vehichles in renter occupied houses
Mortgage status - with mortgage (%)
Mortgage status - with second mortgage (%)
Mortgage status - with home equity loan (%)
Mortgage status - with both second mortgage and home equity loan (%)
Mortgage status - without a mortgage (%)
Average family size
Average family size - White
Average family size - Black or African American
Average family size - Asian
Average family size - Hispanic or Latino
Average family size - American Indian and Alaska Native
Average family size - Multirace
Average family size - Other Race
Geographical mobility - Same house 1 year ago (%)
Geographical mobility - Moved within same county (%)
Geographical mobility - Moved from different county within same state (%)
Geographical mobility - Moved from different state (%)
Geographical mobility - Moved from abroad (%)
Place of birth - Born in state of residence (%)
Place of birth - Born in other state (%)
Place of birth - Native, outside of US (%)
Place of birth - Foreign born (%)
Housing units in structures - 1, detached (%)
Housing units in structures - 1, attached (%)
Housing units in structures - 2 (%)
Housing units in structures - 3 or 4 (%)
Housing units in structures - 5 to 9 (%)
Housing units in structures - 10 to 19 (%)
Housing units in structures - 20 to 49 (%)
Housing units in structures - 50 or more (%)
Housing units in structures - Mobile home (%)
Housing units in structures - Boat, RV, van, etc. (%)
House/condo owner moved in on average (years ago)
Renter moved in on average (years ago)
Year householder moved into unit - Moved in 1999 to March 2000 (%)
Year householder moved into unit - Moved in 1995 to 1998 (%)
Year householder moved into unit - Moved in 1990 to 1994 (%)
Year householder moved into unit - Moved in 1980 to 1989 (%)
Year householder moved into unit - Moved in 1970 to 1979 (%)
Year householder moved into unit - Moved in 1969 or earlier (%)
Means of transportation to work - Drove car alone (%)
Means of transportation to work - Carpooled (%)
Means of transportation to work - Public transportation (%)
Means of transportation to work - Bus or trolley bus (%)
Means of transportation to work - Streetcar or trolley car (%)
Means of transportation to work - Subway or elevated (%)
Means of transportation to work - Railroad (%)
Means of transportation to work - Ferryboat (%)
Means of transportation to work - Taxicab (%)
Means of transportation to work - Motorcycle (%)
Means of transportation to work - Bicycle (%)
Means of transportation to work - Walked (%)
Means of transportation to work - Other means (%)
Working at home (%)
Industry diversity
Most Common Industries - Agriculture, forestry, fishing and hunting, and mining (%)
Most Common Industries - Agriculture, forestry, fishing and hunting (%)
Most Common Industries - Mining, quarrying, and oil and gas extraction (%)
Most Common Industries - Construction (%)
Most Common Industries - Manufacturing (%)
Most Common Industries - Wholesale trade (%)
Most Common Industries - Retail trade (%)
Most Common Industries - Transportation and warehousing, and utilities (%)
Most Common Industries - Transportation and warehousing (%)
Most Common Industries - Utilities (%)
Most Common Industries - Information (%)
Most Common Industries - Finance and insurance, and real estate and rental and leasing (%)
Most Common Industries - Finance and insurance (%)
Most Common Industries - Real estate and rental and leasing (%)
Most Common Industries - Professional, scientific, and management, and administrative and waste management services (%)
Most Common Industries - Professional, scientific, and technical services (%)
Most Common Industries - Management of companies and enterprises (%)
Most Common Industries - Administrative and support and waste management services (%)
Most Common Industries - Educational services, and health care and social assistance (%)
Most Common Industries - Educational services (%)
Most Common Industries - Health care and social assistance (%)
Most Common Industries - Arts, entertainment, and recreation, and accommodation and food services (%)
Most Common Industries - Arts, entertainment, and recreation (%)
Most Common Industries - Accommodation and food services (%)
Most Common Industries - Other services, except public administration (%)
Most Common Industries - Public administration (%)
Occupation diversity
Most Common Occupations - Management, business, science, and arts occupations (%)
Most Common Occupations - Management, business, and financial occupations (%)
Most Common Occupations - Management occupations (%)
Most Common Occupations - Business and financial operations occupations (%)
Most Common Occupations - Computer, engineering, and science occupations (%)
Most Common Occupations - Computer and mathematical occupations (%)
Most Common Occupations - Architecture and engineering occupations (%)
Most Common Occupations - Life, physical, and social science occupations (%)
Most Common Occupations - Education, legal, community service, arts, and media occupations (%)
Most Common Occupations - Community and social service occupations (%)
Most Common Occupations - Legal occupations (%)
Most Common Occupations - Education, training, and library occupations (%)
Most Common Occupations - Arts, design, entertainment, sports, and media occupations (%)
Most Common Occupations - Healthcare practitioners and technical occupations (%)
Most Common Occupations - Health diagnosing and treating practitioners and other technical occupations (%)
Most Common Occupations - Health technologists and technicians (%)
Most Common Occupations - Service occupations (%)
Most Common Occupations - Healthcare support occupations (%)
Most Common Occupations - Protective service occupations (%)
Most Common Occupations - Fire fighting and prevention, and other protective service workers including supervisors (%)
Most Common Occupations - Law enforcement workers including supervisors (%)
Most Common Occupations - Food preparation and serving related occupations (%)
Most Common Occupations - Building and grounds cleaning and maintenance occupations (%)
Most Common Occupations - Personal care and service occupations (%)
Most Common Occupations - Sales and office occupations (%)
Most Common Occupations - Sales and related occupations (%)
Most Common Occupations - Office and administrative support occupations (%)
Most Common Occupations - Natural resources, construction, and maintenance occupations (%)
Most Common Occupations - Farming, fishing, and forestry occupations (%)
Most Common Occupations - Construction and extraction occupations (%)
Most Common Occupations - Installation, maintenance, and repair occupations (%)
Most Common Occupations - Production, transportation, and material moving occupations (%)
Most Common Occupations - Production occupations (%)
Most Common Occupations - Transportation occupations (%)
Most Common Occupations - Material moving occupations (%)
People in Group quarters - Institutionalized population (%)
People in Group quarters - Correctional institutions (%)
People in Group quarters - Federal prisons and detention centers (%)
People in Group quarters - Halfway houses (%)
People in Group quarters - Local jails and other confinement facilities (including police lockups) (%)
People in Group quarters - Military disciplinary barracks (%)
People in Group quarters - State prisons (%)
People in Group quarters - Other types of correctional institutions (%)
People in Group quarters - Nursing homes (%)
People in Group quarters - Hospitals/wards, hospices, and schools for the handicapped (%)
People in Group quarters - Hospitals/wards and hospices for chronically ill (%)
People in Group quarters - Hospices or homes for chronically ill (%)
People in Group quarters - Military hospitals or wards for chronically ill (%)
People in Group quarters - Other hospitals or wards for chronically ill (%)
People in Group quarters - Hospitals or wards for drug/alcohol abuse (%)
People in Group quarters - Mental (Psychiatric) hospitals or wards (%)
People in Group quarters - Schools, hospitals, or wards for the mentally retarded (%)
People in Group quarters - Schools, hospitals, or wards for the physically handicapped (%)
People in Group quarters - Institutions for the deaf (%)
People in Group quarters - Institutions for the blind (%)
People in Group quarters - Orthopedic wards and institutions for the physically handicapped (%)
People in Group quarters - Wards in general hospitals for patients who have no usual home elsewhere (%)
People in Group quarters - Wards in military hospitals for patients who have no usual home elsewhere (%)
People in Group quarters - Juvenile institutions (%)
People in Group quarters - Long-term care (%)
People in Group quarters - Homes for abused, dependent, and neglected children (%)
People in Group quarters - Residential treatment centers for emotionally disturbed children (%)
People in Group quarters - Training schools for juvenile delinquents (%)
People in Group quarters - Short-term care, detention or diagnostic centers for delinquent children (%)
People in Group quarters - Type of juvenile institution unknown (%)
People in Group quarters - Noninstitutionalized population (%)
People in Group quarters - College dormitories (includes college quarters off campus) (%)
People in Group quarters - Military quarters (%)
People in Group quarters - On base (%)
People in Group quarters - Barracks, unaccompanied personnel housing (UPH), (Enlisted/Officer), ;and similar group living quarters for military personnel (%)
People in Group quarters - Transient quarters for temporary residents (%)
People in Group quarters - Military ships (%)
People in Group quarters - Group homes (%)
People in Group quarters - Homes or halfway houses for drug/alcohol abuse (%)
People in Group quarters - Homes for the mentally ill (%)
People in Group quarters - Homes for the mentally retarded (%)
People in Group quarters - Homes for the physically handicapped (%)
People in Group quarters - Other group homes (%)
People in Group quarters - Religious group quarters (%)
People in Group quarters - Dormitories (%)
People in Group quarters - Agriculture workers' dormitories on farms (%)
People in Group quarters - Job Corps and vocational training facilities (%)
People in Group quarters - Other workers' dormitories (%)
People in Group quarters - Crews of maritime vessels (%)
People in Group quarters - Other nonhousehold living situations (%)
People in Group quarters - Other noninstitutional group quarters (%)
Residents speaking English at home (%)
Residents speaking English at home - Born in the United States (%)
Residents speaking English at home - Native, born elsewhere (%)
Residents speaking English at home - Foreign born (%)
Residents speaking Spanish at home (%)
Residents speaking Spanish at home - Born in the United States (%)
Residents speaking Spanish at home - Native, born elsewhere (%)
Residents speaking Spanish at home - Foreign born (%)
Residents speaking other language at home (%)
Residents speaking other language at home - Born in the United States (%)
Residents speaking other language at home - Native, born elsewhere (%)
Residents speaking other language at home - Foreign born (%)
Class of Workers - Employee of private company (%)
Class of Workers - Self-employed in own incorporated business (%)
Class of Workers - Private not-for-profit wage and salary workers (%)
Class of Workers - Local government workers (%)
Class of Workers - State government workers (%)
Class of Workers - Federal government workers (%)
Class of Workers - Self-employed workers in own not incorporated business and Unpaid family workers (%)
House heating fuel used in houses and condos - Utility gas (%)
House heating fuel used in houses and condos - Bottled, tank, or LP gas (%)
House heating fuel used in houses and condos - Electricity (%)
House heating fuel used in houses and condos - Fuel oil, kerosene, etc. (%)
House heating fuel used in houses and condos - Coal or coke (%)
House heating fuel used in houses and condos - Wood (%)
House heating fuel used in houses and condos - Solar energy (%)
House heating fuel used in houses and condos - Other fuel (%)
House heating fuel used in houses and condos - No fuel used (%)
House heating fuel used in apartments - Utility gas (%)
House heating fuel used in apartments - Bottled, tank, or LP gas (%)
House heating fuel used in apartments - Electricity (%)
House heating fuel used in apartments - Fuel oil, kerosene, etc. (%)
House heating fuel used in apartments - Coal or coke (%)
House heating fuel used in apartments - Wood (%)
House heating fuel used in apartments - Solar energy (%)
House heating fuel used in apartments - Other fuel (%)
House heating fuel used in apartments - No fuel used (%)
Armed forces status - In Armed Forces (%)
Armed forces status - Civilian (%)
Armed forces status - Civilian - Veteran (%)
Armed forces status - Civilian - Nonveteran (%)
Fatal accidents locations in years 2005-2021
Fatal accidents locations in 2005
Fatal accidents locations in 2006
Fatal accidents locations in 2007
Fatal accidents locations in 2008
Fatal accidents locations in 2009
Fatal accidents locations in 2010
Fatal accidents locations in 2011
Fatal accidents locations in 2012
Fatal accidents locations in 2013
Fatal accidents locations in 2014
Fatal accidents locations in 2015
Fatal accidents locations in 2016
Fatal accidents locations in 2017
Fatal accidents locations in 2018
Fatal accidents locations in 2019
Fatal accidents locations in 2020
Fatal accidents locations in 2021
Alcohol use - People drinking some alcohol every month (%)
Alcohol use - People not drinking at all (%)
Alcohol use - Average days/month drinking alcohol
Alcohol use - Average drinks/week
Alcohol use - Average days/year people drink much
Audiometry - Average condition of hearing (%)
Audiometry - People that can hear a whisper from across a quiet room (%)
Audiometry - People that can hear normal voice from across a quiet room (%)
Audiometry - Ears ringing, roaring, buzzing (%)
Audiometry - Had a job exposure to loud noise (%)
Audiometry - Had off-work exposure to loud noise (%)
Blood Pressure & Cholesterol - Has high blood pressure (%)
Blood Pressure & Cholesterol - Checking blood pressure at home (%)
Blood Pressure & Cholesterol - Frequently checking blood cholesterol (%)
Blood Pressure & Cholesterol - Has high cholesterol level (%)
Consumer Behavior - Money monthly spent on food at supermarket/grocery store
Consumer Behavior - Money monthly spent on food at other stores
Consumer Behavior - Money monthly spent on eating out
Consumer Behavior - Money monthly spent on carryout/delivered foods
Consumer Behavior - Income spent on food at supermarket/grocery store (%)
Consumer Behavior - Income spent on food at other stores (%)
Consumer Behavior - Income spent on eating out (%)
Consumer Behavior - Income spent on carryout/delivered foods (%)
Current Health Status - General health condition (%)
Current Health Status - Blood donors (%)
Current Health Status - Has blood ever tested for HIV virus (%)
Current Health Status - Left-handed people (%)
Dermatology - People using sunscreen (%)
Diabetes - Diabetics (%)
Diabetes - Had a blood test for high blood sugar (%)
Diabetes - People taking insulin (%)
Diet Behavior & Nutrition - Diet health (%)
Diet Behavior & Nutrition - Milk product consumption (# of products/month)
Diet Behavior & Nutrition - Meals not home prepared (#/week)
Diet Behavior & Nutrition - Meals from fast food or pizza place (#/week)
Diet Behavior & Nutrition - Ready-to-eat foods (#/month)
Diet Behavior & Nutrition - Frozen meals/pizza (#/month)
Drug Use - People that ever used marijuana or hashish (%)
Drug Use - Ever used hard drugs (%)
Drug Use - Ever used any form of cocaine (%)
Drug Use - Ever used heroin (%)
Drug Use - Ever used methamphetamine (%)
Health Insurance - People covered by health insurance (%)
Kidney Conditions-Urology - Avg. # of times urinating at night
Medical Conditions - People with asthma (%)
Medical Conditions - People with anemia (%)
Medical Conditions - People with psoriasis (%)
Medical Conditions - People with overweight (%)
Medical Conditions - Elderly people having difficulties in thinking or remembering (%)
Medical Conditions - People who ever received blood transfusion (%)
Medical Conditions - People having trouble seeing even with glass/contacts (%)
Medical Conditions - People with arthritis (%)
Medical Conditions - People with gout (%)
Medical Conditions - People with congestive heart failure (%)
Medical Conditions - People with coronary heart disease (%)
Medical Conditions - People with angina pectoris (%)
Medical Conditions - People who ever had heart attack (%)
Medical Conditions - People who ever had stroke (%)
Medical Conditions - People with emphysema (%)
Medical Conditions - People with thyroid problem (%)
Medical Conditions - People with chronic bronchitis (%)
Medical Conditions - People with any liver condition (%)
Medical Conditions - People who ever had cancer or malignancy (%)
Mental Health - People who have little interest in doing things (%)
Mental Health - People feeling down, depressed, or hopeless (%)
Mental Health - People who have trouble sleeping or sleeping too much (%)
Mental Health - People feeling tired or having little energy (%)
Mental Health - People with poor appetite or overeating (%)
Mental Health - People feeling bad about themself (%)
Mental Health - People who have trouble concentrating on things (%)
Mental Health - People moving or speaking slowly or too fast (%)
Mental Health - People having thoughts they would be better off dead (%)
Oral Health - Average years since last visit a dentist
Oral Health - People embarrassed because of mouth (%)
Oral Health - People with gum disease (%)
Oral Health - General health of teeth and gums (%)
Oral Health - Average days a week using dental floss/device
Oral Health - Average days a week using mouthwash for dental problem
Oral Health - Average number of teeth
Pesticide Use - Households using pesticides to control insects (%)
Pesticide Use - Households using pesticides to kill weeds (%)
Physical Activity - People doing vigorous-intensity work activities (%)
Physical Activity - People doing moderate-intensity work activities (%)
Physical Activity - People walking or bicycling (%)
Physical Activity - People doing vigorous-intensity recreational activities (%)
Physical Activity - People doing moderate-intensity recreational activities (%)
Physical Activity - Average hours a day doing sedentary activities
Physical Activity - Average hours a day watching TV or videos
Physical Activity - Average hours a day using computer
Physical Functioning - People having limitations keeping them from working (%)
Physical Functioning - People limited in amount of work they can do (%)
Physical Functioning - People that need special equipment to walk (%)
Physical Functioning - People experiencing confusion/memory problems (%)
Physical Functioning - People requiring special healthcare equipment (%)
Prescription Medications - Average number of prescription medicines taking
Preventive Aspirin Use - Adults 40+ taking low-dose aspirin (%)
Reproductive Health - Vaginal deliveries (%)
Reproductive Health - Cesarean deliveries (%)
Reproductive Health - Deliveries resulted in a live birth (%)
Reproductive Health - Pregnancies resulted in a delivery (%)
Reproductive Health - Women breastfeeding newborns (%)
Reproductive Health - Women that had a hysterectomy (%)
Reproductive Health - Women that had both ovaries removed (%)
Reproductive Health - Women that have ever taken birth control pills (%)
Reproductive Health - Women taking birth control pills (%)
Reproductive Health - Women that have ever used Depo-Provera or injectables (%)
Reproductive Health - Women that have ever used female hormones (%)
Sexual Behavior - People 18+ that ever had sex (vaginal, anal, or oral) (%)
Sexual Behavior - Males 18+ that ever had vaginal sex with a woman (%)
Sexual Behavior - Males 18+ that ever performed oral sex on a woman (%)
Sexual Behavior - Males 18+ that ever had anal sex with a woman (%)
Sexual Behavior - Males 18+ that ever had any sex with a man (%)
Sexual Behavior - Females 18+ that ever had vaginal sex with a man (%)
Sexual Behavior - Females 18+ that ever performed oral sex on a man (%)
Sexual Behavior - Females 18+ that ever had anal sex with a man (%)
Sexual Behavior - Females 18+ that ever had any kind of sex with a woman (%)
Sexual Behavior - Average age people first had sex
Sexual Behavior - Average number of female sex partners in lifetime (males 18+)
Sexual Behavior - Average number of female vaginal sex partners in lifetime (males 18+)
Sexual Behavior - Average age people first performed oral sex on a woman (18+)
Sexual Behavior - Average number of woman performed oral sex on in lifetime (18+)
Sexual Behavior - Average number of male sex partners in lifetime (males 18+)
Sexual Behavior - Average number of male anal sex partners in lifetime (males 18+)
Sexual Behavior - Average age people first performed oral sex on a man (18+)
Sexual Behavior - Average number of male oral sex partners in lifetime (18+)
Sexual Behavior - People using protection when performing oral sex (%)
Sexual Behavior - Average number of times people have vaginal or anal sex a year
Sexual Behavior - People having sex without condom (%)
Sexual Behavior - Average number of male sex partners in lifetime (females 18+)
Sexual Behavior - Average number of male vaginal sex partners in lifetime (females 18+)
Sexual Behavior - Average number of female sex partners in lifetime (females 18+)
Sexual Behavior - Circumcised males 18+ (%)
Sleep Disorders - Average hours sleeping at night
Sleep Disorders - People that has trouble sleeping (%)
Smoking-Cigarette Use - People smoking cigarettes (%)
Taste & Smell - People 40+ having problems with smell (%)
Taste & Smell - People 40+ having problems with taste (%)
Taste & Smell - People 40+ that ever had wisdom teeth removed (%)
Taste & Smell - People 40+ that ever had tonsils teeth removed (%)
Taste & Smell - People 40+ that ever had a loss of consciousness because of a head injury (%)
Taste & Smell - People 40+ that ever had a broken nose or other serious injury to face or skull (%)
Taste & Smell - People 40+ that ever had two or more sinus infections (%)
Weight - Average height (inches)
Weight - Average weight (pounds)
Weight - Average BMI
Weight - People that are obese (%)
Weight - People that ever were obese (%)
Weight - People trying to lose weight (%)
Urban population: 27,086
Rural population: 587
Estimated median house/condo value in 2022: $119,616
66104:
$119,616Kansas:
$206,600
Median resident age: This zip code:
35.0 yearsKansas median age:
37.6 years
Average household size: This zip code:
2.8 peopleKansas:
2.4 people
Averages for the 2020 tax year for zip code 66104, filed in 2021:
Average Adjusted Gross Income (AGI) in 2020: $35,294 (Individual Income Tax Returns) Here:
$35,294State:
$72,721
Salary/wage: $33,245 (reported on 85.0% of returns )Here:
$33,245State:
$58,641
(% of AGI for various income ranges: 1246.3% for AGIs below $25k , 3899.7% for AGIs $25k-50k , 7228.3% for AGIs $50k-75k , 10207.0% for AGIs $75k-100k , 15670.4% for AGIs $100k-200k ) Taxable interest for individuals: $483 (reported on 11.4% of returns )This zip code:
$483Kansas:
$1,625
(% of AGI for various income ranges: 4.2% for AGIs below $25k , 4.1% for AGIs $25k-50k , 14.7% for AGIs $50k-75k , 12.8% for AGIs $75k-100k , 61.3% for AGIs $100k-200k ) Ordinary dividends: $1,416 (reported on 4.1% of returns )(% of AGI for various income ranges: 2.5% for AGIs below $25k , 3.9% for AGIs $25k-50k , 23.1% for AGIs $50k-75k , 17.0% for AGIs $75k-100k , 60.4% for AGIs $100k-200k ) Net capital gain/loss in AGI: +$4,751 (reported on 3.4% of returns )Here:
+$4,751State:
+$20,511
(% of AGI for various income ranges: 2.8% for AGIs below $25k , 7.0% for AGIs $25k-50k , 44.3% for AGIs $50k-75k , 40.9% for AGIs $75k-100k , 397.9% for AGIs $100k-200k ) Profit/loss from business: +$10,143 (reported on 13.9% of returns )Here:
+$10,143State:
+$13,852
(% of AGI for various income ranges: 188.9% for AGIs below $25k , 144.8% for AGIs $25k-50k , 201.4% for AGIs $50k-75k , 314.0% for AGIs $75k-100k , 496.7% for AGIs $100k-200k ) Taxable individual retirement arrangement distribution: $11,193 (reported on 3.6% of returns )66104:
$11,193Kansas:
$19,921
(% of AGI for various income ranges: 18.4% for AGIs below $25k , 24.4% for AGIs $25k-50k , 111.0% for AGIs $50k-75k , 236.7% for AGIs $75k-100k , 446.7% for AGIs $100k-200k ) Total itemized deductions: $26,417 (reported on 1.9% of returns )Here:
$26,417State:
$36,939
(% of AGI for various income ranges: 11.3% for AGIs below $25k , 38.6% for AGIs $25k-50k , 171.7% for AGIs $50k-75k , 240.0% for AGIs $75k-100k , 617.9% for AGIs $100k-200k ) Charity contributions: $9,100 (reported on 1.7% of returns )(% of AGI for various income ranges: 12.3% for AGIs $25k-50k , 50.1% for AGIs $50k-75k , 75.6% for AGIs $75k-100k , 230.0% for AGIs $100k-200k ) Taxes paid: $5,700 (reported on 1.9% of returns )(% of AGI for various income ranges: 1.8% for AGIs below $25k , 5.6% for AGIs $25k-50k , 33.0% for AGIs $50k-75k , 57.9% for AGIs $75k-100k , 188.3% for AGIs $100k-200k ) Earned income credit: $2,639 (reported on 29.0% of returns )(% of AGI for various income ranges: 150.4% for AGIs below $25k , 98.0% for AGIs $25k-50k , 1.7% for AGIs $50k-75k ) Percentage of individuals using paid preparers for their 2020 taxes: 91.5%(% for various income ranges: 91.0% for AGIs below $25k , 91.6% for AGIs $25k-50k , 91.7% for AGIs $50k-75k , 92.3% for AGIs $75k-100k , 95.0% for AGIs $100k-200k , 100.0% for AGIs over 200k )
Averages for the 2012 tax year for zip code 66104, filed in 2013:
Average Adjusted Gross Income (AGI) in 2012: $30,179 (Individual Income Tax Returns) Here:
$30,179State:
$60,095
Salary/wage: $27,740 (reported on 86.7% of returns )Here:
$27,740State:
$48,770
(% of AGI for various income ranges: 77.2% for AGIs below $25k , 84.3% for AGIs $25k-50k , 81.6% for AGIs $50k-75k , 76.8% for AGIs $75k-100k , 67.6% for AGIs $100k-200k ) Taxable interest for individuals: $696 (reported on 13.9% of returns )This zip code:
$696Kansas:
$1,506
(% of AGI for various income ranges: 0.4% for AGIs below $25k , 0.2% for AGIs $25k-50k , 0.3% for AGIs $50k-75k , 0.3% for AGIs $75k-100k , 0.5% for AGIs $100k-200k ) Ordinary dividends: $1,708 (reported on 5.5% of returns )(% of AGI for various income ranges: 0.2% for AGIs below $25k , 0.2% for AGIs $25k-50k , 0.4% for AGIs $50k-75k , 0.4% for AGIs $75k-100k , 0.7% for AGIs $100k-200k ) Net capital gain/loss in AGI: +$507 (reported on 2.8% of returns )(% of AGI for various income ranges: 0.1% for AGIs $75k-100k , 0.2% for AGIs $100k-200k ) Profit/loss from business: +$5,810 (reported on 11.0% of returns )Here:
+$5,810State:
+$12,554
(% of AGI for various income ranges: 6.7% for AGIs below $25k , 0.8% for AGIs $25k-50k , 0.9% for AGIs $50k-75k , 0.9% for AGIs $75k-100k , 0.3% for AGIs $100k-200k ) Taxable individual retirement arrangement distribution: $8,994 (reported on 4.8% of returns )66104:
$8,994Kansas:
$14,098
(% of AGI for various income ranges: 1.0% for AGIs below $25k , 0.7% for AGIs $25k-50k , 1.4% for AGIs $50k-75k , 2.6% for AGIs $75k-100k , 3.7% for AGIs $100k-200k ) Total itemized deductions: $15,095 (26% of AGI, reported on 16.1% of returns )Here:
$15,095State:
$23,678
Here:
26.5% of AGIState:
18.9% of AGI
(% of AGI for various income ranges: 4.9% for AGIs below $25k , 6.6% for AGIs $25k-50k , 9.8% for AGIs $50k-75k , 11.7% for AGIs $75k-100k , 12.8% for AGIs $100k-200k ) Charity contributions: $3,865 (reported on 12.7% of returns )(% of AGI for various income ranges: 0.7% for AGIs below $25k , 1.3% for AGIs $25k-50k , 1.9% for AGIs $50k-75k , 2.9% for AGIs $75k-100k , 2.9% for AGIs $100k-200k ) Taxes paid: $4,681 (reported on 15.9% of returns )(% of AGI for various income ranges: 1.1% for AGIs below $25k , 1.7% for AGIs $25k-50k , 2.9% for AGIs $50k-75k , 4.2% for AGIs $75k-100k , 5.4% for AGIs $100k-200k ) Earned income credit: $2,613 (reported on 35.1% of returns )(% of AGI for various income ranges: 10.8% for AGIs below $25k , 1.8% for AGIs $25k-50k ) Percentage of individuals using paid preparers for their 2012 taxes: 51.2%(% for various income ranges: 49.1% for AGIs below $25k , 51.1% for AGIs $25k-50k , 56.7% for AGIs $50k-75k , 59.1% for AGIs $75k-100k , 60.9% for AGIs $100k-200k )
Averages for the 2004 tax year for zip code 66104, filed in 2005:
Average Adjusted Gross Income (AGI) in 2004: $28,483 (Individual Income Tax Returns) Here:
$28,483State:
$45,726
Salary/wage: $26,897 (reported on 88.1% of returns )Here:
$26,897State:
$40,112
(% of AGI for various income ranges: 86.2% for AGIs below $10k , 80.3% for AGIs $10k-25k , 86.9% for AGIs $25k-50k , 84.9% for AGIs $50k-75k , 80.5% for AGIs $75k-100k , 67.5% for AGIs over 100k ) Taxable interest for individuals: $1,146 (reported on 23.4% of returns )This zip code:
$1,146Kansas:
$1,749
(% of AGI for various income ranges: 2.3% for AGIs below $10k , 1.4% for AGIs $10k-25k , 0.7% for AGIs $25k-50k , 0.6% for AGIs $50k-75k , 0.8% for AGIs $75k-100k , 1.3% for AGIs over 100k ) Taxable dividends: $965 (reported on 9.0% of returns )(% of AGI for various income ranges: 0.7% for AGIs below $10k , 0.3% for AGIs $10k-25k , 0.3% for AGIs $25k-50k , 0.2% for AGIs $50k-75k , 0.5% for AGIs $75k-100k , 0.4% for AGIs over 100k ) Net capital gain/loss: +$1,697 (reported on 5.3% of returns )Here:
+$1,697State:
+$7,555
(% of AGI for various income ranges: -0.3% for AGIs below $10k , 0.2% for AGIs $10k-25k , 0.1% for AGIs $25k-50k , 0.3% for AGIs $50k-75k , 0.9% for AGIs $75k-100k , 1.2% for AGIs over 100k ) Profit/loss from business: +$3,227 (reported on 9.4% of returns )Here:
+$3,227State:
+$9,571
(% of AGI for various income ranges: 2.1% for AGIs below $10k , 2.8% for AGIs $10k-25k , 0.6% for AGIs $25k-50k , 1.0% for AGIs $50k-75k , -0.2% for AGIs $75k-100k , 0.2% for AGIs over 100k ) IRA payment deduction: $1,968 (reported on 0.9% of returns )66104:
$1,968Kansas:
$2,922
Total itemized deductions: $13,419 (27% of AGI, reported on 22.7% of returns )Here:
$13,419State:
$18,779
Here:
26.7% of AGIState:
20.5% of AGI
(% of AGI for various income ranges: 5.7% for AGIs below $10k , 6.1% for AGIs $10k-25k , 9.9% for AGIs $25k-50k , 13.1% for AGIs $50k-75k , 14.8% for AGIs $75k-100k , 16.8% for AGIs over 100k ) Charity contributions deductions: $3,171 (6% of AGI, reported on 19.6% of returns )Here:
6.1% of AGIState:
4.0% of AGI
(% of AGI for various income ranges: 0.7% for AGIs below $10k , 1.1% for AGIs $10k-25k , 2.0% for AGIs $25k-50k , 2.7% for AGIs $50k-75k , 3.5% for AGIs $75k-100k , 3.1% for AGIs over 100k ) Total tax: $3,173 (reported on 62.4% of returns )(% of AGI for various income ranges: 1.8% for AGIs below $10k , 2.9% for AGIs $10k-25k , 6.0% for AGIs $25k-50k , 9.1% for AGIs $50k-75k , 10.6% for AGIs $75k-100k , 14.2% for AGIs over 100k ) Earned income credit: $1,876 (reported on 30.2% of returns )Percentage of individuals using paid preparers for their 2004 taxes: 65.4%(% for various income ranges: 58.2% for AGIs below $10k , 70.2% for AGIs $10k-25k , 64.3% for AGIs $25k-50k , 67.6% for AGIs $50k-75k , 67.1% for AGIs $75k-100k , 69.8% for AGIs over 100k )
Estimated median household income in 2022: This zip code:
$51,631Kansas:
$68,925
Nearest zip codes: 66102 ,
64150 ,
66101 ,
64152 ,
66105 ,
66106 .
Kansas City Zip Code Map
Percentage of family households: This zip code:
44.6%Kansas:
45.7%
Percentage of households with unmarried partners: This zip code:
7.4%Kansas:
48.9%
Likely homosexual households (counted as self-reported same-sex unmarried-partner households)
Lesbian couples: 0.0% of all households Gay men: 0.1% of all households
Household received Food Stamps/SNAP in the past 12 months: 1,900Household did not receive Food Stamps/SNAP in the past 12 months: 7,897
Women who had a birth in the past 12 months: 753 (432 now married , 317 unmarried) Women who did not have a birth in the past 12 months: 5,370 (2,042 now married , 3,333 unmarried)
Housing units in zip code 66104 with a mortgage: 3,625 (262
second mortgage , 2
home equity loan , 176
both second mortgage and home equity loan )
Houses without a mortgage: 101
Median monthly owner costs for units with a mortgage: $1,217
Median monthly owner costs for units without a mortgage: $556
Residents with income below the poverty level in 2022:
This zip code:
21.6%Whole state:
12.0%
Residents with income below 50% of the poverty level in 2022:
This zip code:
10.5%Whole state:
6.4%
Median number of rooms in houses and condos: Median number of rooms in apartments: Notable locations in this zip code not listed on our city pages
Click to draw/clear zip code borders Notable locations in zip code 66104: (A) , Nearman Creek Power Station (B) , Kansas City Plant Number 3 Wastewater Treatment Plant (C) , Plaza West (D) , Barker Plaza (E) , The Manor of Kansas City Nursing Home (F) , Medicalodge Post - Acute Care Center (G) , Medicalodge East of Kansas City Nursing Home (H) , Kansas City Kansas Fire Department Station 5 (I) , Kansas City Kansas Fire Department Station 18 (J) , Kansas City Kansas Fire Department Station 14 (K) . Display/hide their locations on the map
Shopping Centers: (1) , Chelsea Shopping Center (2) . Display/hide their locations on the map
Churches in zip code 66104 include: (A) , Brenner Heights Baptist Church (B) , Sunset Hills Christian Church (C) , Rising Star Baptist Church (D) , Welborn Community United Church of Christ (E) , Brenner Heights Baptist Church (F) , King Solomon Missionary Baptist Church (G) , Christ Church of the New Covenant (H) , Christ the King Church of Kansas (I) . Display/hide their locations on the map
Cemeteries: (1) , Mount Hope Cemetery (2) , Quindaro Cemetery (3) , Saylor Cemetery (4) , Old Quindaro Cemetery (5) . Display/hide their locations on the map
Reservoir: (A) . Display/hide its location on the map
Creeks: (A) , Eddy Creek (B) . Display/hide their locations on the map
Parks in zip code 66104 include: (1) , Klamm Park (2) , Quindaro Park (3) , Turkey Creek Streamway Park (4) , Westheight Park (5) . Display/hide their locations on the map
Year house built (houses)
9 2020 or later302 2010 to 2019414 2000 to 2009233 1990 to 1999319 1980 to 19891,000 1970 to 19791,585 1960 to 19693,058 1950 to 19591,506 1940 to 19492,766 1939 or earlier
Zip code 66104 household income distribution in 2022 878 Less than $10,000652 $10,000 to $14,999546 $15,000 to $19,999422 $20,000 to $24,999414 $25,000 to $29,999622 $30,000 to $34,999414 $35,000 to $39,999336 $40,000 to $44,999520 $45,000 to $49,9991,024 $50,000 to $59,9991,036 $60,000 to $74,9991,134 $75,000 to $99,999696 $100,000 to $124,999471 $125,000 to $149,999539 $150,000 to $199,999139 $200,000 or moreEstimate of home value of owner-occupied houses/condos in 2022 in zip code 66104 92 Less than $10,00065 $10,000 to $14,99953 $15,000 to $19,99960 $20,000 to $24,999119 $25,000 to $29,999128 $30,000 to $34,999110 $35,000 to $39,999264 $40,000 to $49,999430 $50,000 to $59,999206 $60,000 to $69,999255 $70,000 to $79,999358 $80,000 to $89,999341 $90,000 to $99,9991,109 $100,000 to $124,999544 $125,000 to $149,999904 $150,000 to $174,999146 $175,000 to $199,999284 $200,000 to $249,999126 $250,000 to $299,999170 $300,000 to $399,9998 $400,000 to $499,999104 $500,000 to $749,99954 $750,000 to $999,9997 $1,000,000 to $1,499,999Rent paid by renters in 2022 in zip code 66104 26 Less than $10067 $100 to $14939 $150 to $19930 $200 to $24947 $250 to $299102 $300 to $349197 $350 to $39936 $400 to $449126 $450 to $499207 $500 to $549257 $550 to $599231 $600 to $649163 $650 to $699149 $700 to $749380 $750 to $799428 $800 to $899104 $900 to $999451 $1,000 to $1,24929 $1,250 to $1,49921 $1,500 to $1,9997 $3,500 or more216 No cash rent
Median gross rent in 2022: $995.
Median price asked for vacant for-sale houses and condos in 2022: $157,926.
Estimated median house (or condo) value in 2022 for: White Non-Hispanic householders: $136,853Black or African American householders: $102,901American Indian or Alaska Native householders: $102,378Asian householders: $221,995Native Hawaiian and other Pacific Islander householders: $248,112Some other race householders: $96,894Two or more races householders: $161,403Hispanic or Latino householders: $102,117Estimated median house or condo value in 2022: $119,616
66104:
$119,616Kansas:
$206,600
Lower value quartile - upper value quartile: $71,173 - $173,899
Mean price in 2022: Detached houses: $192,618Here:
$192,618State:
$264,181
Townhouses or other attached units: $160,971Here:
$160,971State:
$219,178
In 2-unit structures: $177,109Here:
$177,109State:
$190,919
In 3-to-4-unit structures: $122,001Here:
$122,001State:
$161,859
In 5-or-more-unit structures: $52,573Here:
$52,573State:
$267,030
Mobile homes: $48,175Here:
$48,175State:
$74,712
Occupied boats, RVs, vans, etc.: $20,037Here:
$20,037State:
$32,385
Housing units in structures:
One, detached: 9,341One, attached: 606Two: 1623 or 4: 3205 to 9: 25210 to 19: 25820 to 49: 10850 or more: 423Mobile homes: 14Unemployment : 6.2%
Means of transportation to work in zip code 66104 77.3% 8,739 Drove a car alone13.7% 1,548 Carpooled1.1% 127 Bus or trolley bus0.1% 15 Taxi0.0% 4 Motorcycle0.1% 10 Bicycle0.4% 41 Walked0.3% 37 Other means4.9% 553 Worked at homeTravel time to work (commute) in zip code 66104 182 Less than 5 minutes429 5 to 9 minutes1,363 10 to 14 minutes2,743 15 to 19 minutes2,047 20 to 24 minutes953 25 to 29 minutes1,657 30 to 34 minutes164 35 to 39 minutes226 40 to 44 minutes512 45 to 59 minutes203 60 to 89 minutes72 90 or more minutes
Neighborhoods in zip code 66104: Percentage of zip code residents living and working in this county: 56.8%
Household type by relationship:
Households: 27,674
Male householders: 4,542 (1,280 living alone ), Female householders: 5,260 (1,690 living alone )3,507 spouses (3,507 opposite-sex spouses ), 714 unmarried partners , (709 opposite-sex unmarried partners ), 9,061 children (8,663 natural , 184 adopted , 227 stepchildren ), 1,259 grandchildren , 299 brothers or sisters , 593 parents , 26 foster children , 1,114 other relatives , 770 non-relatives In group quarters: 355 (-1 institutionalized population )
Size of family households: 2,318 2-persons , 1,402 3-persons , 1,096 4-persons , 723 5-persons , 511 6-persons , 312 7-or-more-persons
Size of nonfamily households: 2,976 1-person , 448 2-persons , 5 3-persons , 12 5-persons
3,526 married couples with children. single-parent households (817 men , 1,979 women ).
62.9% of residents of 66104 zip code speak English at home. of residents speak Spanish at home (54% very well, 19% well, 15% not well, 13% not at all ).of residents speak other Indo-European language at home (76% very well, 10% well, 15% not well ).of residents speak Asian or Pacific Island language at home (48% very well, 17% well, 18% not well, 16% not at all ).of residents speak other language at home (58% very well, 11% well, 32% not well ).
Foreign born population: 5,328 (19.3%)
(22.1%
of them are naturalized citizens )
This zip code:
19.3%Whole state:
7.1%
55% Honduras 10% El Salvador 7% Guatemala 6% Costa Rica 5% Zimbabwe 4% Indonesia 2% Cameroon 4% African 2% American 2% German 1% English 1% Irish 0% Italian 0% French Canadian
Year of entry for the foreign-born population
2,157 2010 or later 2,091 2000 to 2009 1,022 1990 to 1999 512 Before 1990
There are
40 Medical Specialists in Zip Code 66104 .
Major facilities with environmental interests located in this zip code:
WELBORN ELEMENTARY SCHOOL (5200 LEAVENWORTH RD in KANSAS CITY, KS)
STATE MASTER (Kansas Facility Profiler) - TANKS-25924, UNDERGROUND STORAGE TANK PROGRAM (National Center for Education Statistics) - STATE ID-8352 Organizations: USD #500 % LINDA CARR (OWNER/OPERATOR)
, KANSAS CITY (SCHOOL DISTRICT)
WEST MIDDLE SCHOOL (2600 N 44TH ST in KANSAS CITY, KS)
STATE MASTER (Kansas Facility Profiler) - TANKS-25901, UNDERGROUND STORAGE TANK PROGRAM (National Center for Education Statistics) - STATE ID-8319 Organizations: USD #500 % LINDA CARR (OWNER/OPERATOR)
, KANSAS CITY (SCHOOL DISTRICT)
USD 500 F L SCHLAGLE HIGH SCHOOL (2214 N 59TH in KANSAS CITY, KS)
(National Center for Education Statistics) - STATE ID-8329 (Resource Conservation and Recovery Act (tracking hazardous waste)) Organizations: USD #500 (CONTACT/OWNER)
, KANSAS CITY KANSAS PUBLIC SCHOOL (CONTACT/OWNER)
, KANSAS CITY (SCHOOL DISTRICT)
ANNS LAUNDRY & DRY CLEANERS (2900 BROWN AVE in KANSAS CITY, KS)
AIR MINOR (AIRS/AFS) STATE MASTER (Kansas Facility Profiler) - ISTEPS-20900293, AIR PROGRAM, DRYCLEAN-0261 Conditionally Exempt Small Quantity Generators, less than 100 kg/month of hazardous waste (Resource Conservation and Recovery Act (tracking hazardous waste)) - notification Business SIC classification: DRYCLEANING PLANTS, EXCEPT RUG CLEANINGOrganizations: BERNADINE DEBRICK (CONTACT/OWNER)
Alternative names: ANNS LAUNDRY & DRY CLNRS, ANNS LAUNDRY/DRY CLEANERS
ARORA S BP (4701 PARALLEL PKWY in KANSAS CITY, KS)
STATE MASTER (Kansas Facility Profiler) - TANKS-28688, UNDERGROUND STORAGE TANK PROGRAM (Resource Conservation and Recovery Act (tracking hazardous waste)) Organizations: AMOCO OIL CO (CONTACT/OWNER)
, ARORA INC. (OWNER/OPERATOR)
Alternative names: AMOCO OIL SS #2355
J & D AUTOMOTIVE INC (5415 LEAVENWORTH RD in KANSAS CITY, KS)
STATE MASTER (Kansas Facility Profiler) - TANKS-10038, UNDERGROUND STORAGE TANK PROGRAM (Resource Conservation and Recovery Act (tracking hazardous waste)) Organizations: DOLORES COLE (CONTACT/OWNER)
, COLE, DOLORES J. (OWNER/OPERATOR)
KAW ROOFING & SHEET METAL (2105 N 13TH in KANSAS CITY, KS)
STATE MASTER (Kansas Facility Profiler) - TANKS-25760, UNDERGROUND STORAGE TANK PROGRAM Small Quantity Generators, between 100 kg and 1000 kg of hazardous waste/month (Resource Conservation and Recovery Act (tracking hazardous waste)) - notification Organizations: BOB DALY (CONTACT/OPERATOR)
, KAW ROOFING & SHEET METAL INC (OWNER/OPERATOR)
AMERICAN SECURITY COMPANY (1801 N. 13TH STREET in KANSAS CITY, KS)
AIR MINOR (AIRS/AFS) STATE MASTER (Kansas Facility Profiler) - ISTEPS-20900250, AIR PROGRAM Business SIC classification: METAL DOORS, SASH, FRAMES, MOLDING, AND TRIMBusiness NAICS classification: METAL WINDOW AND DOOR MANUFACTURING.
AREA VOCATIONAL TECHNICAL SCHOOOL (2220 NORTH 59TH STREET in KANSAS CITY, KS)
STATE MASTER (Kansas Facility Profiler) - TANKS-25893, UNDERGROUND STORAGE TANK PROGRAM Small Quantity Generators, between 100 kg and 1000 kg of hazardous waste/month (Resource Conservation and Recovery Act (tracking hazardous waste)) - notification Organizations: USD #500 (CONTACT/OWNER)
, USD #500 % LINDA CARR (OWNER/OPERATOR)
Alternative names: KANSAS CITY AVTS
BEE GEE STATION (4828 PARALLEL PKWY in KANSAS CITY, KS)
ENFORCEMENT/COMPLIANCE ACTIVITY (Integrated Compliance Information System) STATE MASTER (Kansas Facility Profiler) - TANKS-06599, UNDERGROUND STORAGE TANK PROGRAM Organizations: SALI S INC. ATTN: DANNY ATIE (OWNER/OPERATOR)
BERTRAM CARUTHERS ELEM (1100 WAVERLY in KANSAS CITY, KS)
(National Center for Education Statistics) - STATE ID-8293 Organizations: KANSAS CITY (SCHOOL DISTRICT)
CHELSEA ELEM (2500 WOOD in KANSAS CITY, KS)
(National Center for Education Statistics) - STATE ID-8284 Organizations: KANSAS CITY (SCHOOL DISTRICT)
WM A WHITE ELEM (2600 N 43RD TERR in KANSAS CITY, KS)
(National Center for Education Statistics) - STATE ID-8312 Organizations: KANSAS CITY (SCHOOL DISTRICT)
Housing units lacking complete plumbing facilities: 5.6%
Housing units lacking complete kitchen facilities: 5.2%
74.9% Utility gas 23.0% Electricity 1.4% Bottled, tank, or LP gas
Population in 1990: 32,071.
Place of birth for U.S.-born residents:
This state: 13,685Northeast: 381Midwest: 3,874South: 2,606West: 1,495
63% of the 66104 zip code residents lived in the same house 5 years ago.
Out of people who lived in different houses, 74% lived in this county.
Out of people who lived in different counties, 50% lived in Kansas.
87% of the 66104 zip code residents lived in the same house 1 year ago.
Out of people who lived in different houses, 44% moved from this county.
Out of people who lived in different houses, 14% moved from different county within same state.
Out of people who lived in different houses, 38% moved from different state.
Out of people who lived in different houses, 4% moved from abroad.
Private vs. public school enrollment:
Students in private schools in grades 1 to 8 (elementary and middle school): 105
Students in private schools in grades 9 to 12 (high school): 105
Students in private undergraduate colleges: 165
Occupation by median earnings in the past 12 months ($)
60,364 Architecture and engineering occupations 56,132 Community and social service occupations 55,322 Computer and mathematical occupations 51,793 Installation, maintenance, and repair occupations 51,591 Legal occupations 50,303 Law enforcement workers including supervisors
Companies with federal contracts located in this zip code:
JAY S PLUMBING, HEATING, AIR (5715 PARALLEL PKWY in KANSAS CITY, KS; small business)
$13,570 with Army for Maintenance, Repair or Alteration of Real Property -- Office Buildings. Signed on 2002-06-13. Completion date: 2002-06-24.
Bread of life outreach ministries (2019 n 18th st in kansas city, ks; small business)
$2,000 with Bureau of Prisoners/Federal Prison System for Training/Curriculum Development. Signed on 2006-01-30. Completion date: 2006-02-27.
Top industries in this zip code by the number of employees in 2005:
Health Care and Social Assistance: Nursing Care Facilities (100-249 employees: 2 establishments, 20-49 employees: 1 establishment)Other Services (except Public Administration): Religious Organizations (50-99: 1, 10-19: 3, 5-9: 5, 1-4: 5)Educational Services: Elementary and Secondary Schools (50-99: 1, 20-49: 1, 10-19: 1, 5-9: 2)Health Care and Social Assistance: Other Residential Care Facilities (50-99: 1, 1-4: 4)Health Care and Social Assistance: Homes for the Elderly (50-99: 1)Health Care and Social Assistance: Child Day Care Services (20-49: 1, 10-19: 1, 5-9: 1, 1-4: 4)Accommodation and Food Services: Limited-Service Restaurants (20-49: 1, 10-19: 1, 1-4: 1)
People in group quarters in 2010:
211 people in nursing facilities/skilled-nursing facilities
86 people in residential treatment centers for juveniles (non-correctional)
35 people in emergency and transitional shelters (with sleeping facilities) for people experiencing homelessness
11 people in correctional facilities intended for juveniles
People in group quarters in 2000:
320 people in nursing homes
38 people in homes or halfway houses for drug/alcohol abuse
37 people in other group homes
5 people in religious group quarters
Fatal accident statistics in 2014:
Fatal accident count: 5Vehicles involved in fatal accidents: 9Fatal accidents caused by drunken drivers: 2Fatalities: 5Persons involved in fatal accidents: 17Pedestrians involved in fatal accidents: 0
Fatal accident statistics in 2013:
Fatal accident count: 1Vehicles involved in fatal accidents: 1Fatal accidents caused by drunken drivers: 0Fatalities: 1Persons involved in fatal accidents: 1Pedestrians involved in fatal accidents: 1
Home Mortgage Disclosure Act Aggregated Statistics For Year 2009(Based on 15 full and 6 partial tracts) A) FHA, FSA/RHS & VA B) Conventional C) Refinancings D) Home Improvement Loans E) Loans on Dwellings For 5+ Families F) Non-occupant Loans on G) Loans On Manufactured Number Average Value Number Average Value Number Average Value Number Average Value Number Average Value Number Average Value Number Average Value
LOANS ORIGINATED 119 $79,424 89 $53,595 235 $81,127 25 $20,736 1 $510,000 108 $50,157 1 $88,770 APPLICATIONS APPROVED, NOT ACCEPTED 9 $84,120 3 $50,113 39 $87,980 10 $22,616 0 $0 4 $24,835 0 $0 APPLICATIONS DENIED 17 $84,532 23 $55,351 204 $92,712 52 $28,121 0 $0 29 $100,418 0 $0 APPLICATIONS WITHDRAWN 16 $95,846 8 $48,564 81 $84,376 12 $58,668 0 $0 7 $60,406 0 $0 FILES CLOSED FOR INCOMPLETENESS 5 $80,752 2 $29,000 34 $117,564 5 $70,316 0 $0 1 $700,000 0 $0
Aggregated Statistics For Year 2008(Based on 15 full and 6 partial tracts) A) FHA, FSA/RHS & VA B) Conventional C) Refinancings D) Home Improvement Loans E) Loans on Dwellings For 5+ Families F) Non-occupant Loans on G) Loans On Manufactured Number Average Value Number Average Value Number Average Value Number Average Value Number Average Value Number Average Value Number Average Value
LOANS ORIGINATED 112 $80,325 143 $55,500 319 $80,925 59 $32,768 0 $0 170 $58,793 1 $67,340 APPLICATIONS APPROVED, NOT ACCEPTED 11 $94,439 15 $52,221 61 $81,060 19 $34,281 0 $0 16 $43,668 0 $0 APPLICATIONS DENIED 31 $83,731 45 $47,967 457 $83,597 144 $34,938 2 $1,932,500 69 $46,843 3 $94,243 APPLICATIONS WITHDRAWN 19 $81,275 23 $66,913 171 $84,716 13 $63,525 0 $0 27 $62,807 1 $63,060 FILES CLOSED FOR INCOMPLETENESS 5 $105,760 8 $84,209 44 $92,475 10 $48,581 0 $0 8 $72,995 0 $0
Aggregated Statistics For Year 2007(Based on 15 full and 6 partial tracts) A) FHA, FSA/RHS & VA B) Conventional C) Refinancings D) Home Improvement Loans E) Loans on Dwellings For 5+ Families F) Non-occupant Loans on G) Loans On Manufactured Number Average Value Number Average Value Number Average Value Number Average Value Number Average Value Number Average Value Number Average Value
LOANS ORIGINATED 71 $95,078 349 $68,718 655 $73,208 114 $42,855 2 $10,571,380 325 $54,727 1 $2,450 APPLICATIONS APPROVED, NOT ACCEPTED 4 $151,040 56 $69,481 164 $78,876 26 $39,034 0 $0 39 $62,104 2 $29,965 APPLICATIONS DENIED 20 $101,531 204 $71,227 880 $79,953 195 $41,752 0 $0 156 $69,147 0 $0 APPLICATIONS WITHDRAWN 3 $118,050 58 $64,673 331 $83,131 29 $60,423 0 $0 58 $62,503 0 $0 FILES CLOSED FOR INCOMPLETENESS 1 $73,000 33 $74,732 102 $85,847 1 $90,000 0 $0 23 $65,614 0 $0
Aggregated Statistics For Year 2006(Based on 15 full and 6 partial tracts) A) FHA, FSA/RHS & VA B) Conventional C) Refinancings D) Home Improvement Loans E) Loans on Dwellings For 5+ Families F) Non-occupant Loans on G) Loans On Manufactured Number Average Value Number Average Value Number Average Value Number Average Value Number Average Value Number Average Value Number Average Value
LOANS ORIGINATED 81 $92,436 640 $68,629 896 $72,989 147 $28,125 5 $433,318 353 $57,528 1 $92,440 APPLICATIONS APPROVED, NOT ACCEPTED 4 $95,850 108 $64,361 229 $74,433 30 $31,317 0 $0 46 $54,520 1 $92,440 APPLICATIONS DENIED 11 $111,165 336 $61,563 1,092 $78,058 258 $35,719 0 $0 193 $56,985 5 $73,198 APPLICATIONS WITHDRAWN 11 $101,805 132 $71,333 606 $77,640 56 $56,796 0 $0 69 $60,194 0 $0 FILES CLOSED FOR INCOMPLETENESS 2 $115,860 38 $63,948 121 $79,863 1 $52,000 0 $0 10 $49,506 1 $94,000
Aggregated Statistics For Year 2005(Based on 15 full and 6 partial tracts) A) FHA, FSA/RHS & VA B) Conventional C) Refinancings D) Home Improvement Loans E) Loans on Dwellings For 5+ Families F) Non-occupant Loans on G) Loans On Manufactured Number Average Value Number Average Value Number Average Value Number Average Value Number Average Value Number Average Value Number Average Value
LOANS ORIGINATED 84 $85,850 616 $65,750 1,045 $72,064 148 $36,660 3 $674,333 367 $56,800 3 $66,963 APPLICATIONS APPROVED, NOT ACCEPTED 4 $56,988 151 $64,488 257 $68,059 31 $32,870 0 $0 61 $58,587 0 $0 APPLICATIONS DENIED 8 $78,426 308 $64,337 1,247 $73,008 262 $33,114 0 $0 180 $54,314 7 $35,734 APPLICATIONS WITHDRAWN 2 $106,395 182 $82,075 707 $81,611 75 $79,791 1 $61,090 93 $60,983 2 $46,060 FILES CLOSED FOR INCOMPLETENESS 4 $67,982 36 $75,829 92 $76,259 6 $77,263 0 $0 9 $53,496 0 $0
Aggregated Statistics For Year 2004(Based on 15 full and 6 partial tracts) A) FHA, FSA/RHS & VA B) Conventional C) Refinancings D) Home Improvement Loans E) Loans on Dwellings For 5+ Families F) Non-occupant Loans on G) Loans On Manufactured Number Average Value Number Average Value Number Average Value Number Average Value Number Average Value Number Average Value Number Average Value
LOANS ORIGINATED 109 $80,794 489 $67,349 1,129 $67,447 117 $27,369 3 $582,667 359 $56,491 3 $18,333 APPLICATIONS APPROVED, NOT ACCEPTED 6 $72,518 141 $56,451 339 $68,398 26 $29,100 0 $0 46 $56,404 3 $88,003 APPLICATIONS DENIED 16 $98,637 244 $69,785 1,140 $67,157 177 $29,044 0 $0 133 $53,456 6 $26,680 APPLICATIONS WITHDRAWN 4 $64,155 88 $65,389 552 $74,204 40 $52,567 0 $0 46 $54,605 0 $0 FILES CLOSED FOR INCOMPLETENESS 2 $104,950 19 $89,587 116 $71,092 9 $53,992 0 $0 8 $53,280 0 $0
Aggregated Statistics For Year 2003(Based on 15 full and 6 partial tracts) A) FHA, FSA/RHS & VA B) Conventional C) Refinancings D) Home Improvement Loans E) Loans on Dwellings For 5+ Families F) Non-occupant Loans on Number Average Value Number Average Value Number Average Value Number Average Value Number Average Value Number Average Value
LOANS ORIGINATED 117 $74,695 397 $61,062 1,241 $61,957 82 $12,740 1 $146,260 260 $48,688 APPLICATIONS APPROVED, NOT ACCEPTED 5 $71,886 91 $59,849 250 $63,084 16 $39,251 0 $0 39 $49,521 APPLICATIONS DENIED 21 $73,583 208 $60,985 929 $61,135 109 $15,320 1 $60,000 133 $47,382 APPLICATIONS WITHDRAWN 6 $71,958 87 $74,363 545 $69,981 21 $26,441 0 $0 35 $46,384 FILES CLOSED FOR INCOMPLETENESS 3 $82,597 23 $61,324 66 $62,563 2 $32,500 0 $0 7 $47,513
Aggregated Statistics For Year 2002(Based on 15 full and 4 partial tracts) A) FHA, FSA/RHS & VA B) Conventional C) Refinancings D) Home Improvement Loans E) Loans on Dwellings For 5+ Families F) Non-occupant Loans on Number Average Value Number Average Value Number Average Value Number Average Value Number Average Value Number Average Value
LOANS ORIGINATED 158 $75,078 274 $61,158 846 $59,890 81 $11,977 1 $1,233,540 154 $48,953 APPLICATIONS APPROVED, NOT ACCEPTED 3 $54,253 49 $67,236 240 $53,223 14 $20,686 0 $0 32 $46,215 APPLICATIONS DENIED 23 $56,094 155 $54,409 883 $56,029 129 $12,185 0 $0 54 $47,672 APPLICATIONS WITHDRAWN 8 $53,284 61 $65,287 476 $58,452 22 $22,047 0 $0 35 $41,179 FILES CLOSED FOR INCOMPLETENESS 9 $57,530 30 $57,495 117 $64,505 2 $42,780 0 $0 22 $51,303
Aggregated Statistics For Year 2001(Based on 15 full and 4 partial tracts) A) FHA, FSA/RHS & VA B) Conventional C) Refinancings D) Home Improvement Loans E) Loans on Dwellings For 5+ Families F) Non-occupant Loans on Number Average Value Number Average Value Number Average Value Number Average Value Number Average Value Number Average Value
LOANS ORIGINATED 155 $66,464 271 $50,473 691 $56,142 118 $48,014 6 $335,752 120 $44,686 APPLICATIONS APPROVED, NOT ACCEPTED 2 $52,150 41 $48,098 180 $51,764 22 $23,316 0 $0 13 $44,878 APPLICATIONS DENIED 16 $50,951 182 $45,761 771 $46,299 197 $18,232 0 $0 42 $32,080 APPLICATIONS WITHDRAWN 9 $47,186 44 $52,647 430 $52,309 40 $17,429 0 $0 15 $34,199 FILES CLOSED FOR INCOMPLETENESS 5 $47,300 21 $51,926 103 $53,822 2 $6,060 0 $0 11 $38,115
Aggregated Statistics For Year 2000(Based on 15 full and 6 partial tracts) A) FHA, FSA/RHS & VA B) Conventional C) Refinancings D) Home Improvement Loans E) Loans on Dwellings For 5+ Families F) Non-occupant Loans on Number Average Value Number Average Value Number Average Value Number Average Value Number Average Value Number Average Value
LOANS ORIGINATED 165 $62,638 279 $43,830 542 $45,466 123 $14,351 3 $2,811,087 110 $35,972 APPLICATIONS APPROVED, NOT ACCEPTED 10 $53,979 53 $60,211 166 $46,181 54 $20,282 0 $0 20 $78,224 APPLICATIONS DENIED 35 $51,372 195 $47,208 655 $43,544 243 $14,314 0 $0 54 $39,273 APPLICATIONS WITHDRAWN 14 $57,105 63 $45,939 309 $44,273 25 $20,004 0 $0 22 $41,286 FILES CLOSED FOR INCOMPLETENESS 10 $56,864 10 $41,147 139 $49,549 5 $33,366 0 $0 7 $26,257
Aggregated Statistics For Year 1999(Based on 11 full and 6 partial tracts) A) FHA, FSA/RHS & VA B) Conventional C) Refinancings D) Home Improvement Loans E) Loans on Dwellings For 5+ Families F) Non-occupant Loans on Number Average Value Number Average Value Number Average Value Number Average Value Number Average Value Number Average Value
LOANS ORIGINATED 119 $57,186 169 $41,848 499 $40,863 133 $11,662 5 $335,756 73 $31,435 APPLICATIONS APPROVED, NOT ACCEPTED 1 $33,430 25 $44,425 152 $42,602 79 $14,596 0 $0 22 $28,260 APPLICATIONS DENIED 13 $51,823 116 $41,692 463 $38,838 218 $13,192 0 $0 48 $29,206 APPLICATIONS WITHDRAWN 4 $63,888 51 $39,392 277 $40,981 28 $17,612 0 $0 20 $34,822 FILES CLOSED FOR INCOMPLETENESS 0 $0 10 $40,960 96 $42,640 3 $28,163 0 $0 9 $37,553
Private Mortgage Insurance Companies Aggregated Statistics For Year 2009(Based on 9 full and 2 partial tracts) A) Conventional B) Refinancings Number Average Value Number Average Value
LOANS ORIGINATED 5 $68,592 8 $85,902 APPLICATIONS APPROVED, NOT ACCEPTED 2 $27,500 2 $173,255 APPLICATIONS DENIED 0 $0 1 $165,290 APPLICATIONS WITHDRAWN 0 $0 3 $67,563 FILES CLOSED FOR INCOMPLETENESS 0 $0 1 $64,000
Aggregated Statistics For Year 2008(Based on 12 full and 6 partial tracts) A) Conventional B) Refinancings C) Non-occupant Loans on Number Average Value Number Average Value Number Average Value
LOANS ORIGINATED 34 $73,091 28 $95,464 7 $60,404 APPLICATIONS APPROVED, NOT ACCEPTED 18 $72,091 13 $96,418 4 $65,240 APPLICATIONS DENIED 8 $57,374 1 $100,400 0 $0 APPLICATIONS WITHDRAWN 6 $65,320 3 $86,000 2 $40,980 FILES CLOSED FOR INCOMPLETENESS 1 $20,200 0 $0 0 $0
Aggregated Statistics For Year 2007(Based on 15 full and 6 partial tracts) A) Conventional B) Refinancings C) Non-occupant Loans on Number Average Value Number Average Value Number Average Value
LOANS ORIGINATED 128 $76,134 72 $85,499 37 $59,322 APPLICATIONS APPROVED, NOT ACCEPTED 15 $77,876 14 $81,381 6 $72,917 APPLICATIONS DENIED 5 $74,244 3 $86,667 3 $60,043 APPLICATIONS WITHDRAWN 5 $59,886 7 $68,934 2 $34,000 FILES CLOSED FOR INCOMPLETENESS 0 $0 2 $96,000 0 $0
Aggregated Statistics For Year 2006(Based on 15 full and 6 partial tracts) A) Conventional B) Refinancings C) Non-occupant Loans on Number Average Value Number Average Value Number Average Value
LOANS ORIGINATED 114 $77,964 74 $92,407 26 $62,717 APPLICATIONS APPROVED, NOT ACCEPTED 12 $91,046 19 $81,327 3 $65,307 APPLICATIONS DENIED 3 $51,630 6 $75,167 4 $77,472 APPLICATIONS WITHDRAWN 2 $34,950 6 $95,830 1 $32,890 FILES CLOSED FOR INCOMPLETENESS 1 $36,120 0 $0 0 $0
Aggregated Statistics For Year 2005(Based on 15 full and 6 partial tracts) A) Conventional B) Refinancings C) Non-occupant Loans on Number Average Value Number Average Value Number Average Value
LOANS ORIGINATED 130 $81,061 97 $87,969 38 $67,694 APPLICATIONS APPROVED, NOT ACCEPTED 21 $79,264 21 $88,197 7 $44,621 APPLICATIONS DENIED 3 $64,667 6 $86,957 8 $81,718 APPLICATIONS WITHDRAWN 8 $83,621 10 $93,516 1 $71,000 FILES CLOSED FOR INCOMPLETENESS 2 $104,700 0 $0 0 $0
Aggregated Statistics For Year 2004(Based on 15 full and 6 partial tracts) A) Conventional B) Refinancings C) Non-occupant Loans on Number Average Value Number Average Value Number Average Value
LOANS ORIGINATED 171 $78,217 95 $73,231 47 $55,867 APPLICATIONS APPROVED, NOT ACCEPTED 19 $80,361 36 $77,827 7 $57,420 APPLICATIONS DENIED 2 $72,500 2 $72,000 2 $50,500 APPLICATIONS WITHDRAWN 7 $72,166 14 $89,391 6 $77,322 FILES CLOSED FOR INCOMPLETENESS 2 $54,160 1 $61,830 2 $56,915
Aggregated Statistics For Year 2003(Based on 15 full and 8 partial tracts) A) Conventional B) Refinancings C) Non-occupant Loans on Number Average Value Number Average Value Number Average Value
LOANS ORIGINATED 154 $69,100 135 $73,349 48 $56,964 APPLICATIONS APPROVED, NOT ACCEPTED 24 $61,381 38 $81,149 11 $46,965 APPLICATIONS DENIED 3 $61,000 8 $80,136 4 $91,872 APPLICATIONS WITHDRAWN 3 $63,333 6 $82,398 0 $0 FILES CLOSED FOR INCOMPLETENESS 2 $112,000 0 $0 0 $0
Aggregated Statistics For Year 2002(Based on 15 full and 4 partial tracts) A) Conventional B) Refinancings C) Non-occupant Loans on Number Average Value Number Average Value Number Average Value
LOANS ORIGINATED 108 $61,779 110 $71,262 37 $48,648 APPLICATIONS APPROVED, NOT ACCEPTED 13 $89,707 26 $64,891 3 $34,333 APPLICATIONS DENIED 1 $48,750 0 $0 0 $0 APPLICATIONS WITHDRAWN 5 $75,960 8 $72,195 3 $71,007 FILES CLOSED FOR INCOMPLETENESS 0 $0 4 $53,938 1 $56,000
Aggregated Statistics For Year 2001(Based on 15 full and 4 partial tracts) A) Conventional B) Refinancings C) Non-occupant Loans on Number Average Value Number Average Value Number Average Value
LOANS ORIGINATED 104 $57,452 75 $71,297 27 $42,321 APPLICATIONS APPROVED, NOT ACCEPTED 15 $60,341 17 $71,587 5 $56,072 APPLICATIONS DENIED 0 $0 2 $48,870 0 $0 APPLICATIONS WITHDRAWN 4 $29,555 1 $25,000 5 $28,644 FILES CLOSED FOR INCOMPLETENESS 1 $39,180 2 $57,930 1 $39,180
Aggregated Statistics For Year 2000(Based on 15 full and 4 partial tracts) A) Conventional B) Refinancings C) Non-occupant Loans on Number Average Value Number Average Value Number Average Value
LOANS ORIGINATED 86 $53,230 54 $51,273 16 $45,081 APPLICATIONS APPROVED, NOT ACCEPTED 14 $49,488 3 $56,983 9 $54,486 APPLICATIONS DENIED 8 $50,196 1 $68,000 5 $53,170 APPLICATIONS WITHDRAWN 3 $59,893 1 $63,000 1 $48,980 FILES CLOSED FOR INCOMPLETENESS 0 $0 1 $40,000 0 $0
Aggregated Statistics For Year 1999(Based on 10 full and 3 partial tracts) A) Conventional B) Refinancings C) Non-occupant Loans on Number Average Value Number Average Value Number Average Value
LOANS ORIGINATED 53 $48,220 23 $53,928 9 $34,956 APPLICATIONS APPROVED, NOT ACCEPTED 7 $39,000 7 $48,286 3 $26,333 APPLICATIONS DENIED 5 $45,500 3 $57,457 0 $0 APPLICATIONS WITHDRAWN 5 $46,222 2 $57,555 2 $27,000 FILES CLOSED FOR INCOMPLETENESS 1 $39,000 0 $0 0 $0
2002 - 2018 National Fire Incident Reporting System (NFIRS) incidents See full 2006 National Fire Incident Reporting System statistics for zip code 66104, Kansas
Most common first names in zip code 66104 among deceased individuals Name Count Lived (average)
Mary 278 79.1 years John 264 73.4 years James 236 73.1 years William 230 73.3 years Charles 170 73.0 years Robert 150 70.7 years George 146 75.5 years Anna 109 81.3 years Joseph 105 73.4 years Frank 101 76.3 years
Most common last names in zip code 66104 among deceased individuals Last name Count Lived (average)
Smith 149 71.8 years Williams 145 71.9 years Johnson 129 74.1 years Jones 116 71.9 years Brown 96 76.4 years Davis 85 72.1 years Moore 69 72.5 years Jackson 64 73.3 years Thomas 63 72.3 years White 58 69.9 years
Businesses in zip code 66104
Name Count Name Count
Church's Chicken 1 FedEx 1 Cricket Wireless 1 SONIC Drive-In 1

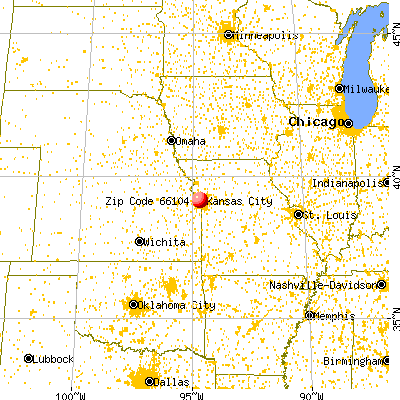


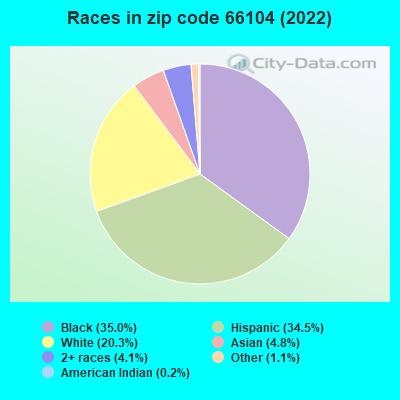


 Nearest zip codes: 66102, 64150, 66101, 64152, 66105, 66106.
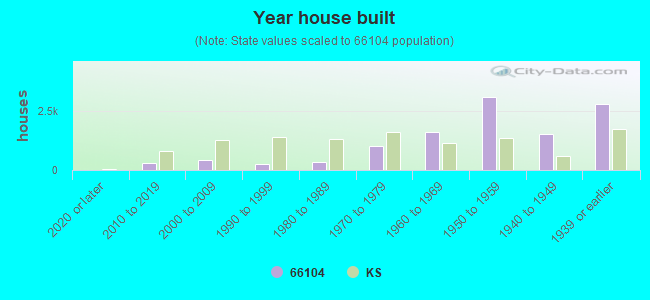

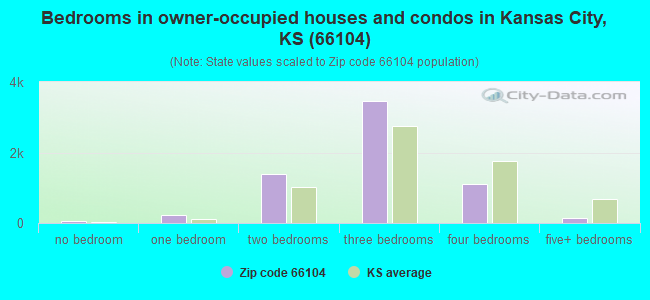
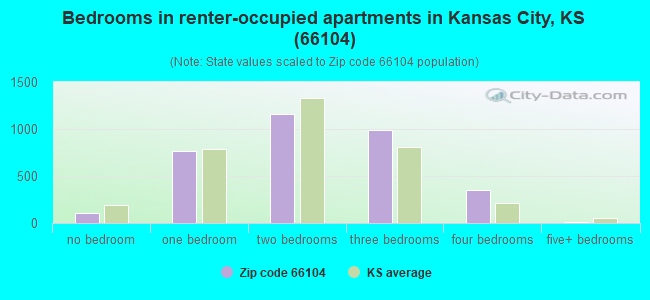
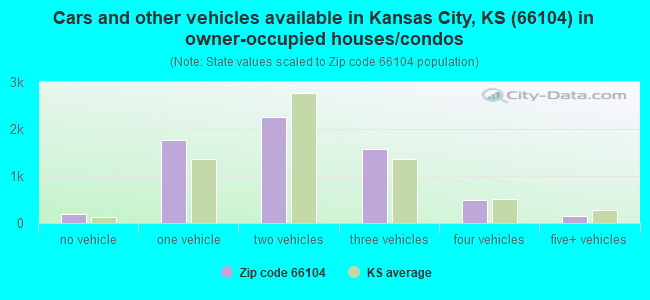
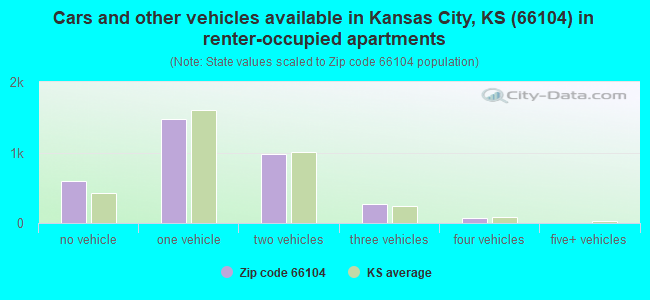


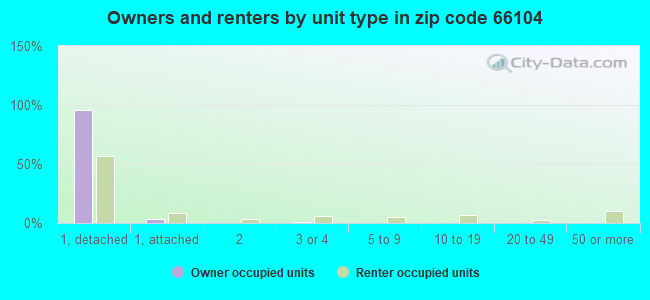
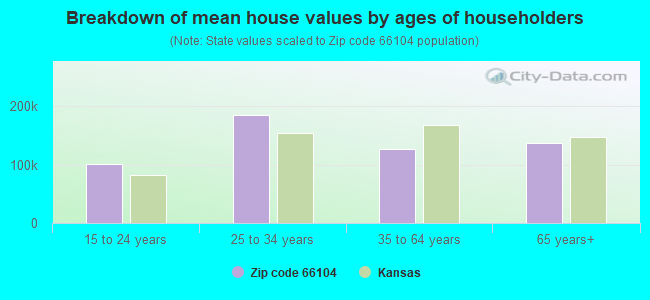


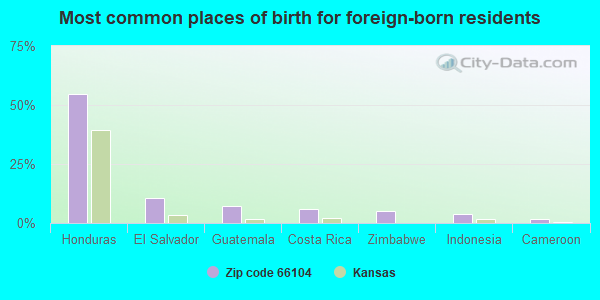
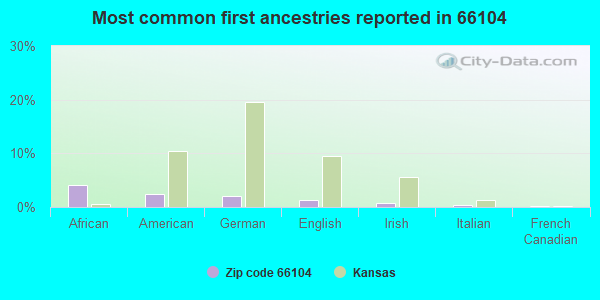
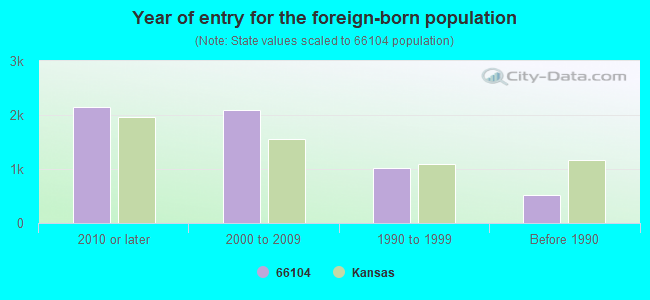


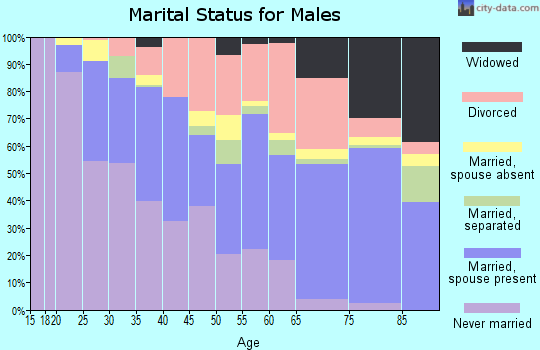
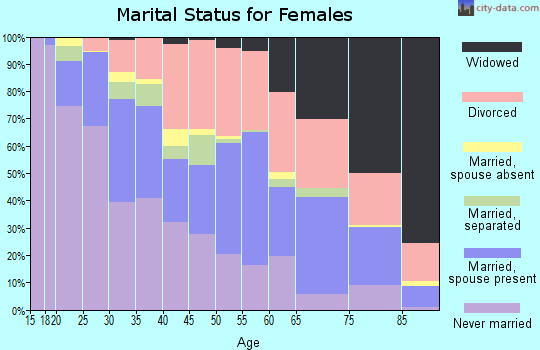
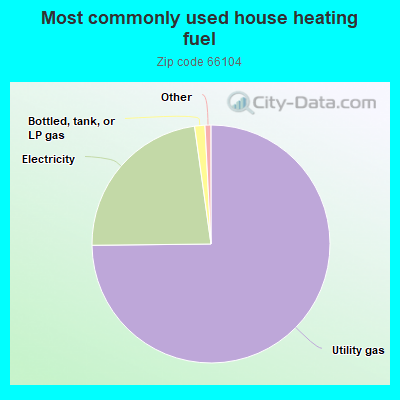
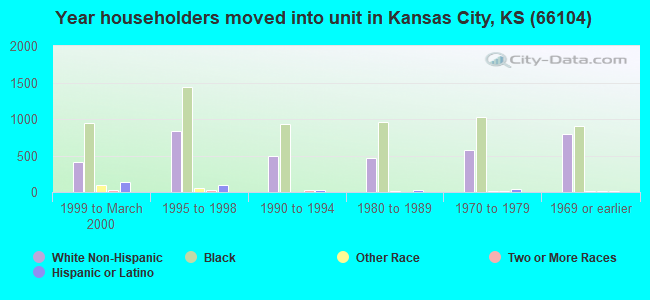
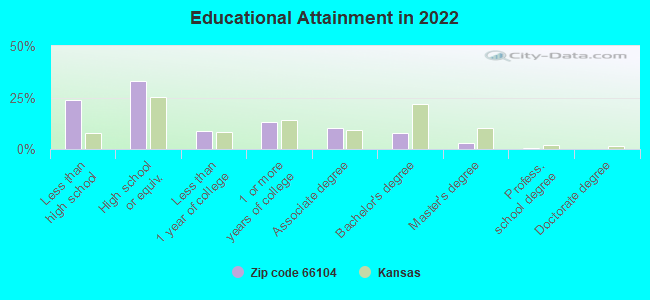
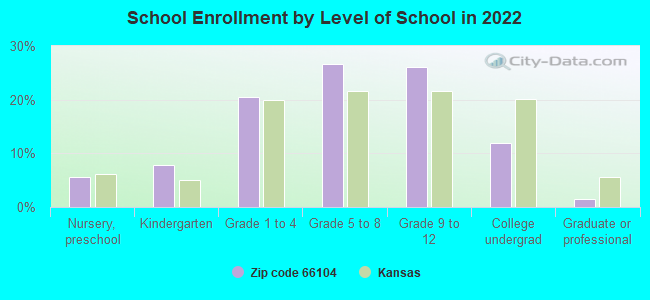
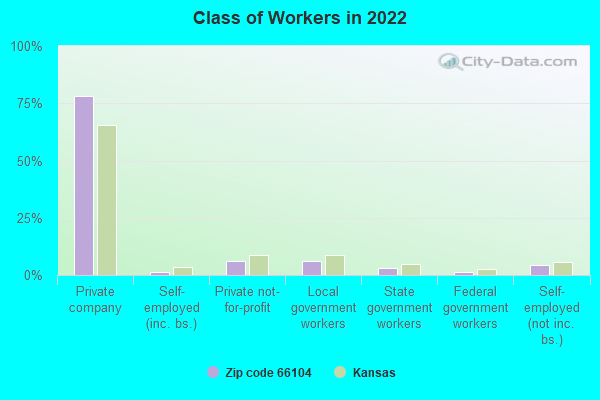
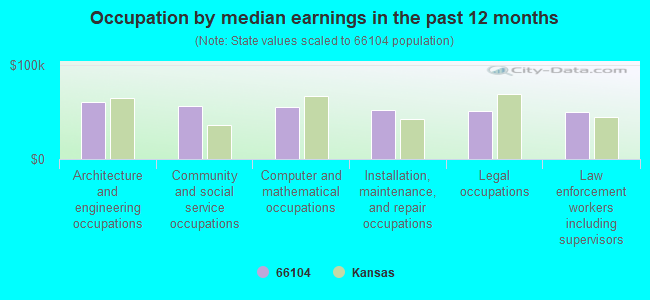
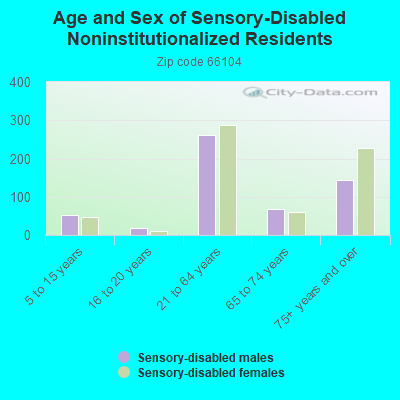
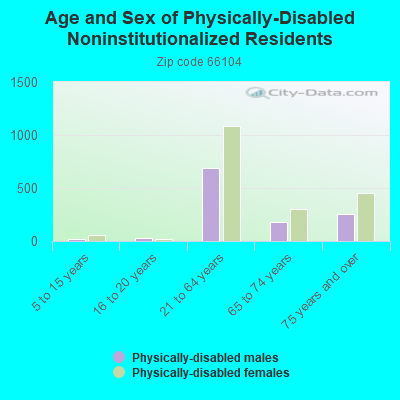
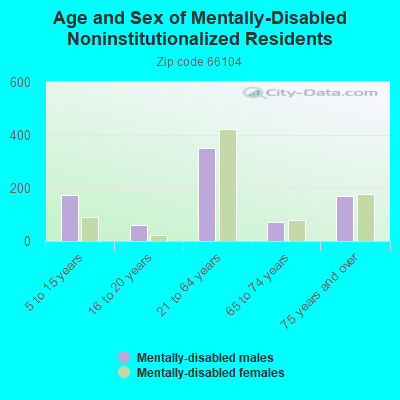
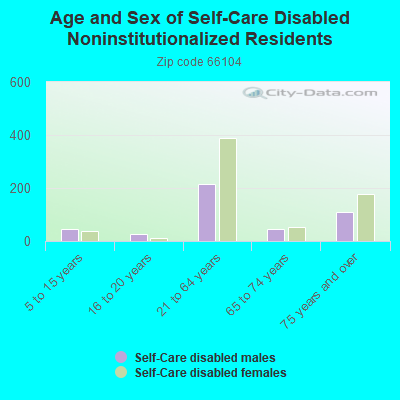

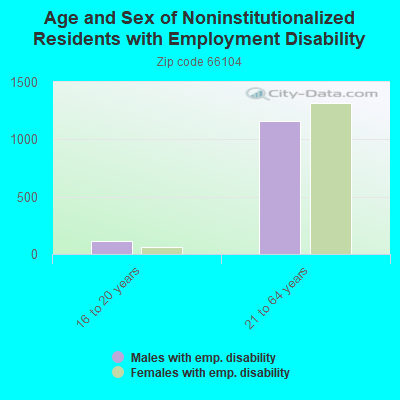
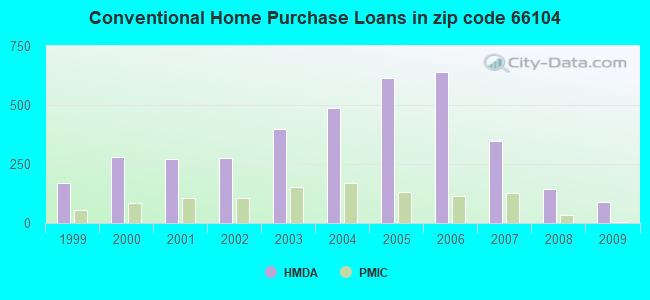
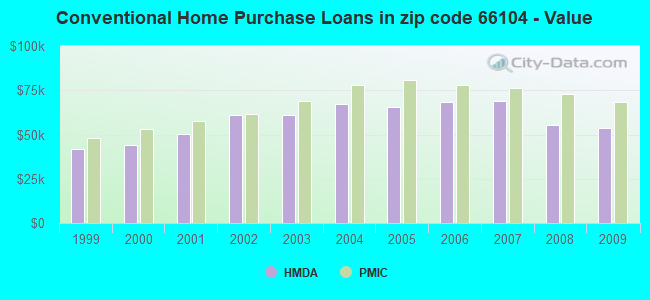
 Based on the data from the years 2002 - 2018 the average number of fires per year is 131. The highest number of reported fire incidents - 193 took place in 2002, and the least - 90 in 2016. The data has a dropping trend.
 When looking into fire subcategories, the most reports belonged to: Structure Fires (44.9%), and Mobile Property/Vehicle Fires (32.7%).