Estimated zip code population in 2022: 25,061 Zip code population in 2010: 24,368 Zip code population in 2000: 23,436
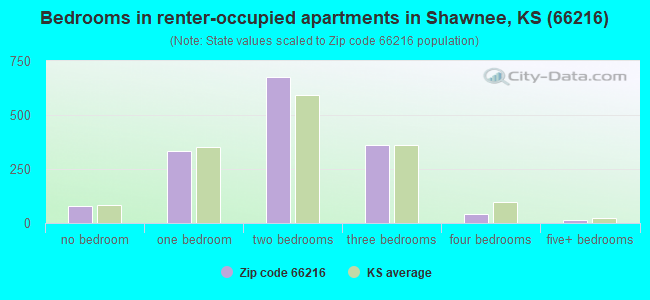
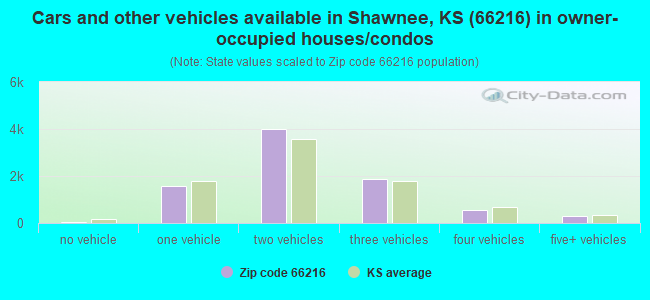
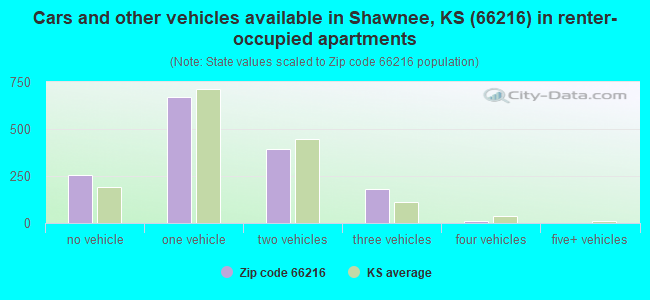
Houses and condos: 10,006 Renter-occupied apartments: 1,507
% of renters here:
15%
State:
32%
March 2022 cost of living index in zip code 66216: 87.2 (less than average, U.S. average is 100)
Land area: 7.8 sq. mi. Water area: 0.1 sq. mi.
Population density: 3,213 people per square mile
(average).
OSM Map
General Map
Google Map
MSN Map
OSM Map
General Map
Google Map
MSN Map
OSM Map
General Map
Google Map
MSN Map
OSM Map
General Map
Google Map
MSN Map
Please wait while loading the map...
Real estate property taxes paid for housing units in 2022:
This zip code:
1.1% ($3,581)
Kansas:
1.2% ($2,578)
Median real estate property taxes paid for housing units with mortgages in 2022: $3,588 (1.1%) Median real estate property taxes paid for housing units with no mortgage in 2022: $3,550 (1.1%)
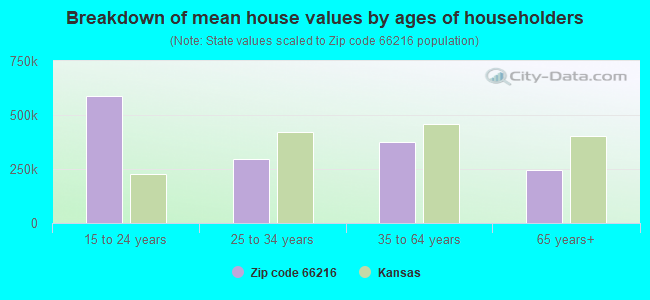
Estimated median house/condo value in 2022: $328,508
66216:
$328,508
Kansas:
$206,600
According to our research of Kansas and other state lists, there were 39 registered sex offenders living in 66216 zip code as of April 27, 2024. The ratio of all residents to sex offenders in zip code 66216 is 657 to 1. The ratio of registered sex offenders to all residents in this zip code is lower than the state average.
Median resident age:
This zip code:
43.1 years
Kansas median age:
37.6 years
Average household size:
This zip code:
2.5 people
Kansas:
2.4 people
Averages for the 2020 tax year for zip code 66216, filed in 2021:
Average Adjusted Gross Income (AGI) in 2020: $89,283 (Individual Income Tax Returns)
Here:
$89,283
State:
$72,721
Salary/wage: $75,831 (reported on 82.6% of returns)
Here:
$75,831
State:
$58,641
(% of AGI for various income ranges: 1217.5% for AGIs below $25k, 3742.0% for AGIs $25k-50k, 6567.5% for AGIs $50k-75k, 9662.9% for AGIs $75k-100k, 18396.2% for AGIs $100k-200k, 71338.8% for AGIs over 200k)
Taxable interest for individuals: $1,311 (reported on 40.9% of returns)
This zip code:
$1,311
Kansas:
$1,625
(% of AGI for various income ranges: 22.7% for AGIs below $25k, 33.5% for AGIs $25k-50k, 47.8% for AGIs $50k-75k, 80.8% for AGIs $75k-100k, 130.9% for AGIs $100k-200k, 685.6% for AGIs over 200k)
Ordinary dividends: $5,587 (reported on 29.6% of returns)
Here:
$5,587
State:
$7,290
(% of AGI for various income ranges: 39.9% for AGIs below $25k, 71.9% for AGIs $25k-50k, 128.1% for AGIs $50k-75k, 209.0% for AGIs $75k-100k, 411.9% for AGIs $100k-200k, 2609.1% for AGIs over 200k)
Net capital gain/loss in AGI: +$13,381 (reported on 26.7% of returns)
Here:
+$13,381
State:
+$20,511
(% of AGI for various income ranges: 14.4% for AGIs below $25k, 36.1% for AGIs $25k-50k, 96.8% for AGIs $50k-75k, 215.6% for AGIs $75k-100k, 561.7% for AGIs $100k-200k, 9502.4% for AGIs over 200k)
Profit/loss from business: +$17,569 (reported on 16.0% of returns)
Here:
+$17,569
State:
+$13,852
(% of AGI for various income ranges: 109.9% for AGIs below $25k, 173.9% for AGIs $25k-50k, 268.4% for AGIs $50k-75k, 395.1% for AGIs $75k-100k, 709.6% for AGIs $100k-200k, 3577.1% for AGIs over 200k)
Taxable individual retirement arrangement distribution: $25,395 (reported on 13.2% of returns)
66216:
$25,395
Kansas:
$19,921
(% of AGI for various income ranges: 82.0% for AGIs below $25k, 154.9% for AGIs $25k-50k, 309.6% for AGIs $50k-75k, 608.6% for AGIs $75k-100k, 1148.2% for AGIs $100k-200k, 3109.7% for AGIs over 200k)
Self-employed (Keogh) retirement plans: $25,582 (reported on 0.9% of returns)
66216:
$25,582
Kansas:
$25,388
(% of AGI for various income ranges: 44.2% for AGIs $100k-200k, 620.9% for AGIs over 200k)
Total itemized deductions: $34,758 (reported on 11.1% of returns)
Here:
$34,758
State:
$36,939
(% of AGI for various income ranges: 70.8% for AGIs below $25k, 158.5% for AGIs $25k-50k, 333.4% for AGIs $50k-75k, 541.2% for AGIs $75k-100k, 989.7% for AGIs $100k-200k, 5820.0% for AGIs over 200k)
Charity contributions: $13,280 (reported on 9.2% of returns)
Here:
$13,280
State:
$15,443
(% of AGI for various income ranges: 2.3% for AGIs below $25k, 14.0% for AGIs $25k-50k, 56.0% for AGIs $50k-75k, 95.0% for AGIs $75k-100k, 277.3% for AGIs $100k-200k, 2704.1% for AGIs over 200k)
Taxes paid: $8,316 (reported on 11.1% of returns)
66216:
$8,316
State:
$8,001
(% of AGI for various income ranges: 9.6% for AGIs below $25k, 27.3% for AGIs $25k-50k, 89.9% for AGIs $50k-75k, 169.5% for AGIs $75k-100k, 307.7% for AGIs $100k-200k, 1029.7% for AGIs over 200k)
Earned income credit: $1,984 (reported on 9.1% of returns)
Here:
$1,984
State:
$2,267
(% of AGI for various income ranges: 64.6% for AGIs below $25k, 48.0% for AGIs $25k-50k, 1.0% for AGIs $50k-75k)
Percentage of individuals using paid preparers for their 2020 taxes: 93.3%
Here:
93%
State:
95%
(% for various income ranges: 91.8% for AGIs below $25k, 93.1% for AGIs $25k-50k, 93.3% for AGIs $50k-75k, 93.9% for AGIs $75k-100k, 94.1% for AGIs $100k-200k, 95.0% for AGIs over 200k)
Averages for the 2012 tax year for zip code 66216, filed in 2013:
Average Adjusted Gross Income (AGI) in 2012: $76,454 (Individual Income Tax Returns)
Here:
$76,454
State:
$60,095
Salary/wage: $65,400 (reported on 85.7% of returns)
Here:
$65,400
State:
$48,770
(% of AGI for various income ranges: 77.9% for AGIs below $25k, 77.5% for AGIs $25k-50k, 72.9% for AGIs $50k-75k, 74.1% for AGIs $75k-100k, 79.0% for AGIs $100k-200k, 64.8% for AGIs over 200k)
Taxable interest for individuals: $1,291 (reported on 43.8% of returns)
This zip code:
$1,291
Kansas:
$1,506
(% of AGI for various income ranges: 1.5% for AGIs below $25k, 0.8% for AGIs $25k-50k, 0.8% for AGIs $50k-75k, 0.6% for AGIs $75k-100k, 0.6% for AGIs $100k-200k, 0.8% for AGIs over 200k)
Ordinary dividends: $4,463 (reported on 30.2% of returns)
Here:
$4,463
State:
$6,093
(% of AGI for various income ranges: 1.9% for AGIs below $25k, 1.2% for AGIs $25k-50k, 1.4% for AGIs $50k-75k, 1.5% for AGIs $75k-100k, 1.2% for AGIs $100k-200k, 2.8% for AGIs over 200k)
Net capital gain/loss in AGI: +$9,136 (reported on 23.2% of returns)
Here:
+$9,136
State:
+$14,598
(% of AGI for various income ranges: 0.4% for AGIs $50k-75k, 0.6% for AGIs $75k-100k, 1.1% for AGIs $100k-200k, 7.8% for AGIs over 200k)
Profit/loss from business: +$16,609 (reported on 16.0% of returns)
Here:
+$16,609
State:
+$12,554
(% of AGI for various income ranges: 6.2% for AGIs below $25k, 4.7% for AGIs $25k-50k, 3.3% for AGIs $50k-75k, 2.6% for AGIs $75k-100k, 2.8% for AGIs $100k-200k, 3.9% for AGIs over 200k)
Taxable individual retirement arrangement distribution: $18,149 (reported on 13.5% of returns)
66216:
$18,149
Kansas:
$14,098
(% of AGI for various income ranges: 3.9% for AGIs below $25k, 3.3% for AGIs $25k-50k, 4.4% for AGIs $50k-75k, 4.1% for AGIs $75k-100k, 3.5% for AGIs $100k-200k, 1.9% for AGIs over 200k)
Self-employment retirement plans: $16,607 (reported on 1.2% of returns)
66216:
$16,607
Kansas:
$19,780
(% of AGI for various income ranges: 0.3% for AGIs $50k-75k, 0.2% for AGIs $100k-200k, 0.5% for AGIs over 200k)
Total itemized deductions: $23,165 (18% of AGI, reported on 48.1% of returns)
Here:
$23,165
State:
$23,678
Here:
18.4% of AGI
State:
18.9% of AGI
(% of AGI for various income ranges: 14.3% for AGIs below $25k, 13.0% for AGIs $25k-50k, 15.1% for AGIs $50k-75k, 16.0% for AGIs $75k-100k, 15.7% for AGIs $100k-200k, 13.0% for AGIs over 200k)
Charity contributions: $4,729 (reported on 41.7% of returns)
Here:
$4,729
State:
$5,321
(% of AGI for various income ranges: 1.2% for AGIs below $25k, 1.5% for AGIs $25k-50k, 2.2% for AGIs $50k-75k, 2.4% for AGIs $75k-100k, 2.7% for AGIs $100k-200k, 3.3% for AGIs over 200k)
Taxes paid: $9,781 (reported on 47.9% of returns)
66216:
$9,781
State:
$9,548
(% of AGI for various income ranges: 2.9% for AGIs below $25k, 3.5% for AGIs $25k-50k, 4.9% for AGIs $50k-75k, 5.9% for AGIs $75k-100k, 7.2% for AGIs $100k-200k, 6.8% for AGIs over 200k)
Earned income credit: $2,061 (reported on 10.0% of returns)
Here:
$2,061
State:
$2,212
(% of AGI for various income ranges: 4.3% for AGIs below $25k, 0.8% for AGIs $25k-50k)
Percentage of individuals using paid preparers for their 2012 taxes: 50.5%
Here:
51%
State:
56%
(% for various income ranges: 41.8% for AGIs below $25k, 48.9% for AGIs $25k-50k, 52.1% for AGIs $50k-75k, 56.2% for AGIs $75k-100k, 55.5% for AGIs $100k-200k, 70.9% for AGIs over 200k)
Averages for the 2004 tax year for zip code 66216, filed in 2005:
Average Adjusted Gross Income (AGI) in 2004: $64,041 (Individual Income Tax Returns)
Here:
$64,041
State:
$45,726
Salary/wage: $56,825 (reported on 87.8% of returns)
Here:
$56,825
State:
$40,112
(% of AGI for various income ranges: 136.3% for AGIs below $10k, 74.1% for AGIs $10k-25k, 78.1% for AGIs $25k-50k, 81.8% for AGIs $50k-75k, 82.6% for AGIs $75k-100k, 74.8% for AGIs over 100k)
Taxable interest for individuals: $1,352 (reported on 57.4% of returns)
This zip code:
$1,352
Kansas:
$1,749
(% of AGI for various income ranges: 5.9% for AGIs below $10k, 3.4% for AGIs $10k-25k, 1.6% for AGIs $25k-50k, 1.1% for AGIs $50k-75k, 0.8% for AGIs $75k-100k, 1.0% for AGIs over 100k)
Taxable dividends: $2,460 (reported on 36.9% of returns)
Here:
$2,460
State:
$3,066
(% of AGI for various income ranges: 4.4% for AGIs below $10k, 1.9% for AGIs $10k-25k, 1.2% for AGIs $25k-50k, 1.2% for AGIs $50k-75k, 1.0% for AGIs $75k-100k, 1.5% for AGIs over 100k)
Net capital gain/loss: +$9,046 (reported on 28.9% of returns)
Here:
+$9,046
State:
+$7,555
(% of AGI for various income ranges: -3.2% for AGIs below $10k, 0.3% for AGIs $10k-25k, 0.4% for AGIs $25k-50k, 0.5% for AGIs $50k-75k, 0.6% for AGIs $75k-100k, 7.2% for AGIs over 100k)
Profit/loss from business: +$13,886 (reported on 16.6% of returns)
Here:
+$13,886
State:
+$9,571
(% of AGI for various income ranges: 3.7% for AGIs below $10k, 6.1% for AGIs $10k-25k, 3.5% for AGIs $25k-50k, 3.8% for AGIs $50k-75k, 3.0% for AGIs $75k-100k, 3.6% for AGIs over 100k)
IRA payment deduction: $3,224 (reported on 3.3% of returns)
66216:
$3,224
Kansas:
$2,922
(% of AGI for various income ranges: 0.3% for AGIs $10k-25k, 0.4% for AGIs $25k-50k, 0.3% for AGIs $50k-75k, 0.2% for AGIs $75k-100k, 0.1% for AGIs over 100k)
Self-employed pension: $13,185 (reported on 1.6% of returns)
Here:
$13,185
Kansas:
$14,209
(% of AGI for various income ranges: 0.1% for AGIs $25k-50k, 0.2% for AGIs $50k-75k, 0.2% for AGIs $75k-100k, 0.5% for AGIs over 100k)
Total itemized deductions: $19,835 (20% of AGI, reported on 51.3% of returns)
Here:
$19,835
State:
$18,779
Here:
19.7% of AGI
State:
20.5% of AGI
(% of AGI for various income ranges: 17.3% for AGIs below $10k, 13.9% for AGIs $10k-25k, 15.7% for AGIs $25k-50k, 18.6% for AGIs $50k-75k, 18.1% for AGIs $75k-100k, 14.7% for AGIs over 100k)
Charity contributions deductions: $3,506 (3% of AGI, reported on 47.3% of returns)
Here:
$3,506
State:
$3,892
Here:
3.4% of AGI
State:
4.0% of AGI
(% of AGI for various income ranges: 1.1% for AGIs below $10k, 1.4% for AGIs $10k-25k, 2.0% for AGIs $25k-50k, 2.6% for AGIs $50k-75k, 2.9% for AGIs $75k-100k, 2.7% for AGIs over 100k)
Total tax: $10,559 (reported on 81.3% of returns)
66216:
$10,559
State:
$7,203
(% of AGI for various income ranges: 3.4% for AGIs below $10k, 4.8% for AGIs $10k-25k, 7.3% for AGIs $25k-50k, 8.9% for AGIs $50k-75k, 10.2% for AGIs $75k-100k, 17.6% for AGIs over 100k)
Earned income credit: $1,536 (reported on 6.7% of returns)
Here:
$1,536
State:
$1,674
Percentage of individuals using paid preparers for their 2004 taxes: 55.7%
Here:
56%
State:
63%
(% for various income ranges: 44.5% for AGIs below $10k, 55.4% for AGIs $10k-25k, 58.9% for AGIs $25k-50k, 58.1% for AGIs $50k-75k, 59.0% for AGIs $75k-100k, 60.8% for AGIs over 100k)
Likely homosexual households (counted as self-reported same-sex unmarried-partner households)
Lesbian couples: 0.0% of all households
Gay men: 0.3% of all households
Household received Food Stamps/SNAP in the past 12 months: 260 Household did not receive Food Stamps/SNAP in the past 12 months: 9,522
Women who had a birth in the past 12 months: 189 (172 now married, 18 unmarried) Women who did not have a birth in the past 12 months: 4,900 (2,269 now married, 2,630 unmarried)
Housing units in zip code 66216 with a mortgage: 5,309 (824 second mortgage, 22 home equity loan, 555 both second mortgage and home equity loan) Houses without a mortgage: 161
Median monthly owner costs for units with a mortgage: $1,965 Median monthly owner costs for units without a mortgage: $773
Residents with income below the poverty level in 2022:
This zip code:
7.2%
Whole state:
12.0%
Residents with income below 50% of the poverty level in 2022:
This zip code:
3.6%
Whole state:
6.4%
Median number of rooms in houses and condos:
Here:
7.9
State:
6.9
Median number of rooms in apartments:
Here:
4.8
State:
4.4
Notable locations in this zip code not listed on our city pages
Notable locations in zip code 66216: Camp Towanyak (A), Vickridge Park (B), Shawnee Parkway Plaza (C), Monrovia Shops (D), Shawnee Marketplace (E), Fenton Professional Plaza (F), Shawnee Center (G), Quivira Square (H), Shawnee Mission Northwest High School Police Department (I), Mahaffie Farmstead and Stagecoach Stop (J), Legler Barn Museum (K), Johnson County Historical Museum (L), The Sweet Life at Shawnee Assisted Living Facility (M), Shawnee Gardens Healthcare and Rehabilitation Center (N), The 1950's All - Electric House Museum (O), Shawnee Library (P). Display/hide their locations on the map
Shopping Centers: Millcreek Center Shopping Center (1), Quivira 63 Shopping Center (2), Westbrooke Village Shopping Center (3), Westbrook Village Shopping Center (4). Display/hide their locations on the map
Churches in zip code 66216 include: Shawnee Bible Church (A), Reform Presbyterian Church (B), Overland Park Bible Chapel (C), Kingdom Hall of Jehovah's Witnesses (D), Church of Christ Lenexa Kansas Shawnee Mission Kansas (E), Hope Lutheran Church (F), Merriam Church of Christ (G), Metropolitan Community Church (H), Midwest Sikh Association (I). Display/hide their locations on the map
4,297 married couples with children.
850 single-parent households (151 men, 699 women).
90.8% of residents of 66216 zip code speak English at home.
2.3% of residents speak Spanish at home (65% very well, 22% well, 5% not well, 8% not at all).
3.4% of residents speak other Indo-European language at home (66% very well, 31% well, 3% not well).
2.1% of residents speak Asian or Pacific Island language at home (62% very well, 12% well, 19% not well, 6% not at all).
1.4% of residents speak other language at home (84% very well, 16% not well).
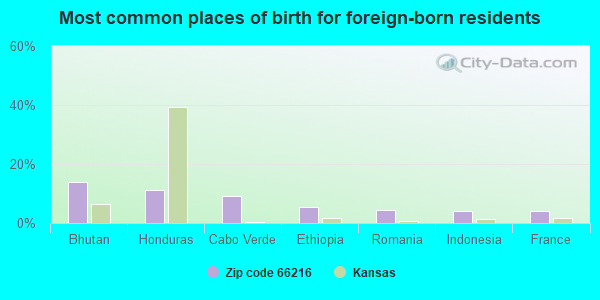
Foreign born population: 1,728 (6.9%) (64.5% of them are naturalized citizens)
This zip code:
6.9%
Whole state:
7.1%
14%Bhutan
11%Honduras
9%Cabo Verde
5%Ethiopia
4%Romania
4%Indonesia
4%France
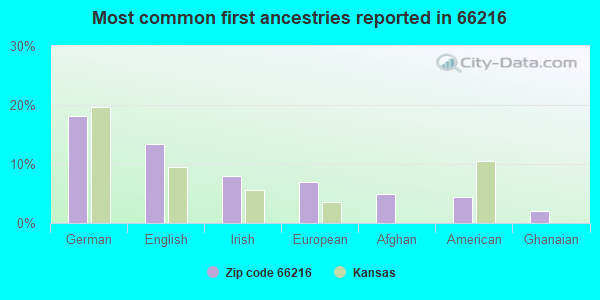
18%German
13%English
8%Irish
7%European
5%Afghan
4%American
2%Ghanaian
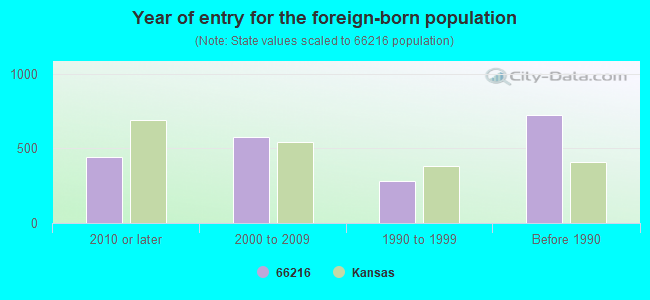
Year of entry for the foreign-born population
4452010 or later
5792000 to 2009
2791990 to 1999
723Before 1990
Major facilities with environmental interests located in this zip code:
INTERVET, INC. (12707 SHAWNEE MISSION PARKWAY in SHAWNEE, KS)
AIR MINOR (AIRS/AFS) STATE MASTER (Kansas Facility Profiler) - ISTEPS-09100188, AIR PROGRAM STATE MASTER (Kansas Facility Profiler) - ISTEPS-09100106, AIR PROGRAM, RTK-JO00723, EPCRA, TANKS-23621, UNDERGROUND STORAGE TANK PROGRAM, TANKS-40241, COMPLIANCE ACTIVITY (Tracking inspections of insecticide, fungicide, and rodenticide, and toxic substances) National Pollutant Discharge Elimination System NON-MAJOR (Tracking pollutant discharge elimination systems) - permit HAZARDOUS WASTE BIENNIAL REPORTER (Resource Conservation and Recovery Act (tracking hazardous waste)) Large Quantity Generators, more that 1000 kg of hazardous waste/month (Resource Conservation and Recovery Act (tracking hazardous waste)) - notification (Resource Conservation and Recovery Act (tracking hazardous waste)) TRI REPORTER (Tracking of toxic chemicals releasing facilities) Business SIC classification: BEEF CATTLE FEEDLOTS; PHARMACEUTICAL PREPARATIONS; BIOLOGICAL PRODUCTS, EXCEPT DIAGNOSTIC SUBSTANCES; PESTICIDES AND AGRICULTURAL CHEMICALS Business NAICS classification: PHARMACEUTICAL PREPARATION MANUFACTURING.; BIOLOGICAL PRODUCT (EXCEPT DIAGNOSTIC) MANUFACTURING. Organizations: BAYER HEALTHCARE-ANIMAL HEALTH, BAYER CORPORATION (CONTACT/OPERATOR)
, INTERVET INC (CONTACT/OPERATOR)
, BAYER CORP (CONTACT/OWNER)
, MOBAY CORP ANIMAL HEALTH DIV (OWNER/OPERATOR)
, BAYER HEALTHCARE LLC ANIMAL HE (OWNER/OPERATOR)
Alternative names: BAYER CORPORATION AG. DIV., BAYER CORP AGRICULTURE DIV, BAYER CORP AGRICULTURE DIV, BAYER HEALTH CARE, ANIMAL HEALTH DIV, BAYVET DIV MILES LABS, MILES INC, MOBAY CORP, ANIMAL HEALTH DIV
USD 512 SHAWNEE MISSION NORTHWEST H S (12701 W 67TH ST in SHAWNEE, KS)
STATE MASTER (Kansas Facility Profiler) - TANKS-25938, UNDERGROUND STORAGE TANK PROGRAM Conditionally Exempt Small Quantity Generators, less than 100 kg/month of hazardous waste (Resource Conservation and Recovery Act (tracking hazardous waste)) Organizations: USD 512, SHAWNEE MISSION (CONTACT/OPERATOR)
, USD #512 (OWNER/OPERATOR)
Alternative names: SHAWNEE MISSION NORTHWEST HIGH, USD #512 S M NORTHWEST HIGH
BROKEN ARROW ELEM (5901 ALDEN in SHAWNEE MISSION, KS)
(National Center for Education Statistics) - STATE ID-8787 Organizations: SHAWNEE MISSION PUB SCH (SCHOOL DISTRICT)
TRAILRIDGE MIDDLE (7500 QUIVIRA RD in SHAWNEE MISSION, KS)
(National Center for Education Statistics) - STATE ID-8884 Organizations: SHAWNEE MISSION PUB SCH (SCHOOL DISTRICT)
WESTLAKE HARDWARE INC (63RD & QUIVIRA in SHAWNEE, KS)
(Integrated Compliance Information System) - ICIS-07-1995-0160, FORMAL ENFORCEMENT ACTION
ARC ELEC INC (6209 RICHARDS in SHAWNEE, KS)
(Resource Conservation and Recovery Act (tracking hazardous waste)) Organizations: DONALD W. CARNAHAN (CONTACT/OWNER)
CINDYS BP (13515 W 63RD in SHAWNEE, KS)
(Resource Conservation and Recovery Act (tracking hazardous waste)) Organizations: INVESTMENTS LTD INC (CONTACT/OWNER)
Alternative names: ZARDA AMOCO 19
VEE VILLAGE WEST (6210 RICHARDS DRIVE in SHAWNEE, KS)
Conditionally Exempt Small Quantity Generators, less than 100 kg/month of hazardous waste (Resource Conservation and Recovery Act (tracking hazardous waste)) Business NAICS classification: GENERAL AUTOMOTIVE REPAIR. Organizations: STEVE SHEPHERD (CONTACT/OPERATOR)
, TIM PERKINS (CONTACT/OWNER)
Alternative names: VEE VILLAGE PARTS INC
XSIS ELECTRONICS INC (12620 W 63RD ST in SHAWNEE, KS)
(Resource Conservation and Recovery Act (tracking hazardous waste)) Organizations: ERIC SHATZ (CONTACT/OWNER)
Alternative names: ERICS ONE DOLLAR CLEANERS
KANSAS CITY ANALYTICAL SVC (12700 JOHNSON in SHAWNEE, KS)
(Resource Conservation and Recovery Act (tracking hazardous waste)) Organizations: WILLIAM D. MASON (CONTACT/OWNER)
KENNETH SMITH GOLF CLUBS (12931 W 71ST in SHAWNEE, KS)
Conditionally Exempt Small Quantity Generators, less than 100 kg/month of hazardous waste (Resource Conservation and Recovery Act (tracking hazardous waste)) Organizations: THE IRREVOCABLE TRUST OF EVA S. SMITH (CONTACT/OPERATOR)
, EVA S SMITH (CONTACT/OWNER)
AAI DEVELOPMENT SVCS (12400 SHAWNEE MISSION PKWY in SHAWNEE, KS)
Small Quantity Generators, between 100 kg and 1000 kg of hazardous waste/month (Resource Conservation and Recovery Act (tracking hazardous waste)) Organizations: AAI PHARMA INC (CONTACT/OWNER)
Alternative names: AAI INTERNATIONAL INC
Housing units lacking complete plumbing facilities: 0.9% Housing units lacking complete kitchen facilities: 0.9%
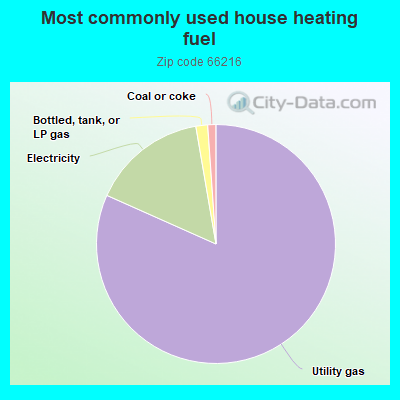
81.6%Utility gas
15.6%Electricity
1.6%Bottled, tank, or LP gas
1.1%Coal or coke
Population in 1990: 19,644. Population change in the 1990s: +3,792 (+19.3%).
Place of birth for U.S.-born residents:
This state: 11,635
Northeast: 911
Midwest: 6,999
South: 1,633
West: 1,718
58% of the 66216 zip code residents lived in the same house 5 years ago. Out of people who lived in different houses, 56% lived in this county. Out of people who lived in different counties, 50% lived in Kansas.
94% of the 66216 zip code residents lived in the same house 1 year ago. Out of people who lived in different houses, 65% moved from this county. Out of people who lived in different houses, 8% moved from different county within same state. Out of people who lived in different houses, 28% moved from different state. Out of people who lived in different houses, 3% moved from abroad.
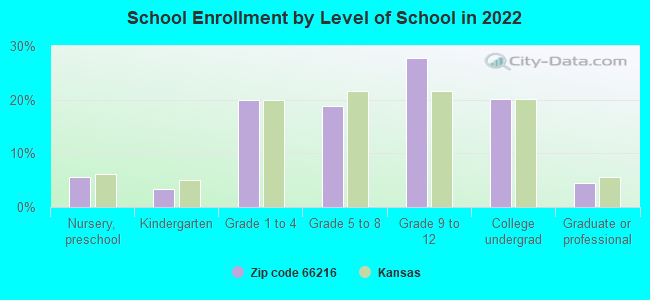
Private vs. public school enrollment:
Students in private schools in grades 1 to 8 (elementary and middle school): 749
Here:
31.8%
Kansas:
14.1%
Students in private schools in grades 9 to 12 (high school): 263
Here:
16.0%
Kansas:
10.8%
Students in private undergraduate colleges: 165
Here:
13.9%
Kansas:
15.4%
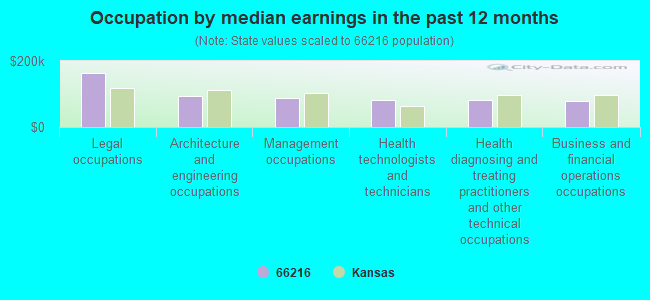
Occupation by median earnings in the past 12 months ($)
164,343Legal occupations
92,585Architecture and engineering occupations
88,047Management occupations
82,630Health technologists and technicians
82,014Health diagnosing and treating practitioners and other technical occupations
78,816Business and financial operations occupations
Companies with federal contracts located in this zip code:
XSIS ELECTRONICS INC (12620 W 63RD ST in SHAWNEE, KS; small business) : $50,470 in 7 contractsfrom 2004 to 2006
Contracts for Oscillators and Piezoelectric Crystals, Miscellaneous Electrical and Electronic Components by Navy, Defense Logistics Agency, Army Signed by year:2000: $0; 2001: $0; 2002: $0; 2003: $0; 2004: $11,579; 2005: $26,308; 2006: $12,583.
Biggest contracts:
$14,548 with Navy for Oscillators and Piezoelectric Crystals. Signed on 2005-03-16. Completion date: 2005-06-22.
$12,583, same as above.Signed on 2006-06-29. Completion date: 2006-09-14.
$11,760 with Navy for Miscellaneous Electrical and Electronic Components. Signed on 2005-08-08. Completion date: 2005-11-09.
$5,740, same as above.Signed on 2004-10-29. Completion date: 2005-01-14.
SHAWNEE POWER SYSTEMS INC (12480 W 62ND TERRACE in SHAWNEE MISSIO, KS; small business) : $29,232 in 2 contractsin 2005
$14,732 with Army for Electronic Modules. Signed on 2005-09-22. Completion date: 2005-12-31.
$14,500, same as above.Signed on 2005-02-01. Completion date: 2005-02-28.
SEMICHEM INCORPORATED (11913 W 49TH TERRACE in SHAWNEE, KS; small business) : $24,000 in 4 contractsfrom 2005 to 2006
$8,500 with Army for Invalid code: AD97. Signed on 2005-02-08. Completion date: 2006-02-10.
$5,500 with National Institutes of Health for Computer Aided Design/Computer Aided Manufacturing (CAD/CAM) Services. Taking place in MD. Signed on 2006-04-03. Completion date: 2007-03-10.
$5,000 with Army for Invalid code: AD97. Signed on 2006-06-05. Effective on 2006-02-11. Completion date: 2007-02-11.
$5,000 with National Institutes of Health for . Taking place in MD. Signed on 2005-01-26. Completion date: 2005-01-26.
APTOS ENGINEERING GROUP INC (13604 W 76TH TER in SHAWNEE MISSIO, KS; small business)
$7,970 with Army for Hazardous Substance Removal, Cleanup, and Disposal Services and Operational Support. Signed on 2002-07-05. Completion date: 2002-07-08.
Top industries in this zip code by the number of employees in 2005:
2002 - 2018 National Fire Incident Reporting System (NFIRS) incidents
According to the data from the years 2002 - 2018 the average number of fires per year is 58. The highest number of reported fires - 85 took place in 2005, and the least - 27 in 2011. The data has a dropping trend.
When looking into fire subcategories, the most incidents belonged to: Structure Fires (50.2%), and Outside Fires (31.0%).
Fire incident types reported to NFIRS in Zip Code 66216


 Nearest zip codes: 66203, 66217, 66214, 66215, 66204, 66106.


 According to the data from the years 2002 - 2018 the average number of fires per year is 58. The highest number of reported fires - 85 took place in 2005, and the least - 27 in 2011. The data has a dropping trend.
 When looking into fire subcategories, the most incidents belonged to: Structure Fires (50.2%), and Outside Fires (31.0%).