Estimated zip code population in 2022: 3,429 Zip code population in 2010: 3,493 Zip code population in 2000: 3,170
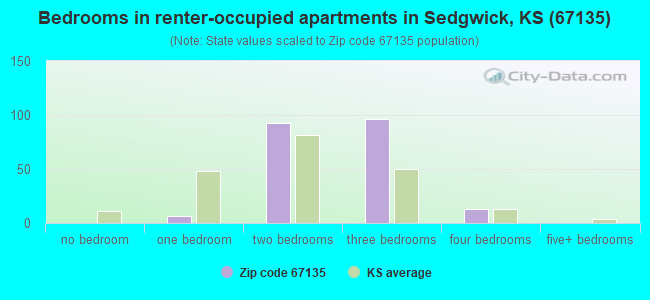
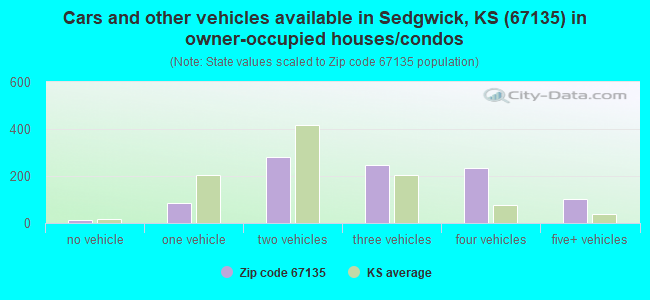
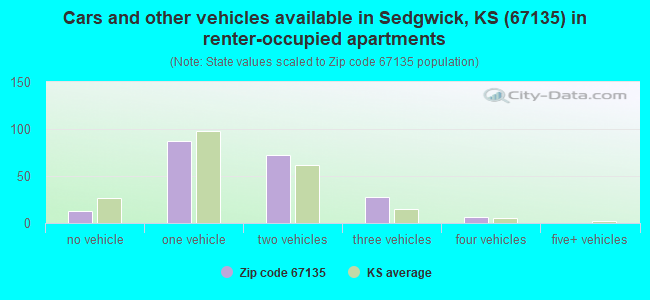
Houses and condos: 1,327 Renter-occupied apartments: 208
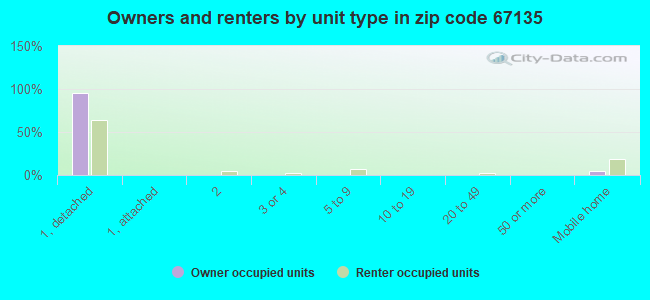
% of renters here:
18%
State:
32%
March 2022 cost of living index in zip code 67135: 80.3 (low, U.S. average is 100)
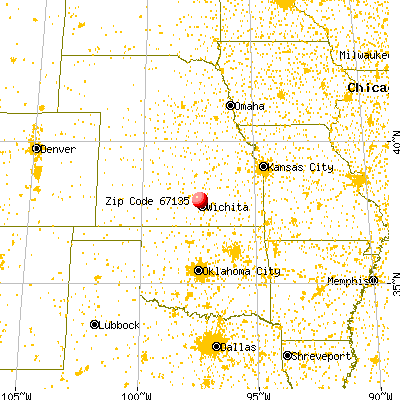
Land area: 103.2 sq. mi. Water area: 0.1 sq. mi.
Population density: 33 people per square mile
(very low).
OSM Map
General Map
Google Map
MSN Map
OSM Map
General Map
Google Map
MSN Map
OSM Map
General Map
Google Map
MSN Map
OSM Map
General Map
Google Map
MSN Map
Please wait while loading the map...
Real estate property taxes paid for housing units in 2022:
This zip code:
1.2% ($2,508)
Kansas:
1.2% ($2,578)
Median real estate property taxes paid for housing units with mortgages in 2022: $2,606 (1.2%) Median real estate property taxes paid for housing units with no mortgage in 2022: $2,195 (1.4%)
Business Search- 14 Million verified businesses
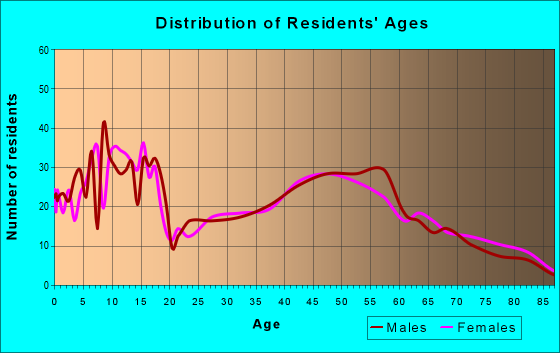
Males: 1,619
(47.2%)
Females: 1,809
(52.8%)
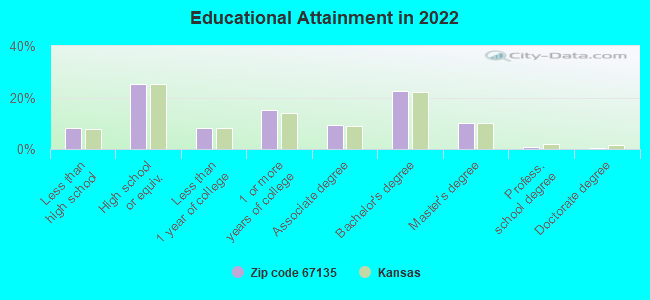
For population 25 years and over in 67135:
High school or higher: 92.0%
Bachelor's degree or higher: 33.9%
Graduate or professional degree: 11.5%
Unemployed: 0.3%
Mean travel time to work (commute): 24.0 minutes
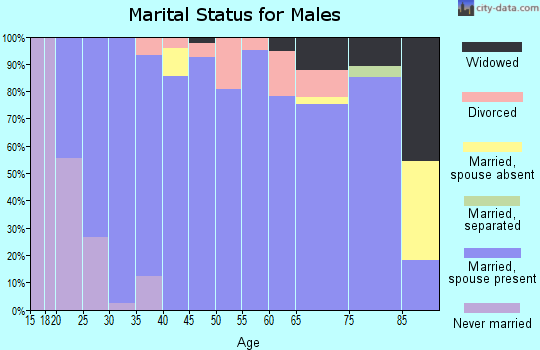
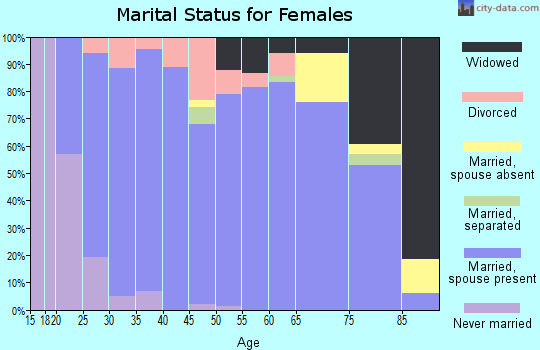
For population 15 years and over in 67135:
Never married: 29.3%
Now married: 58.8%
Separated: 0.2%
Widowed: 4.8%
Divorced: 6.9%
Zip code 67135 compared to state average:
Unemployed percentage significantly below state average.
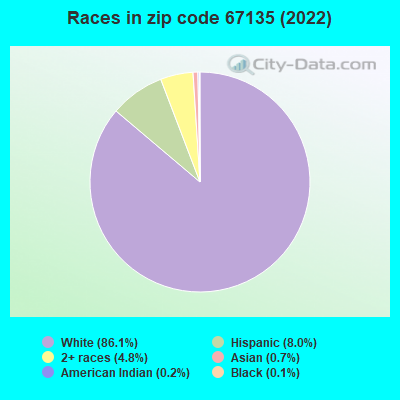
Black race population percentage significantly below state average.
Foreign-born population percentage significantly below state average.
Renting percentage below state average.
Length of stay since moving in significantly above state average.
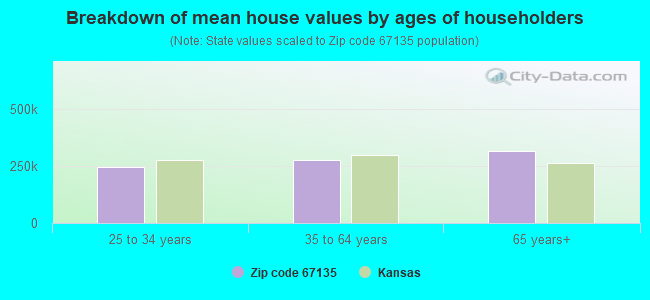
Estimated median house/condo value in 2022: $208,455
67135:
$208,455
Kansas:
$206,600
According to our research of Kansas and other state lists, there were 14 registered sex offenders living in 67135 zip code as of April 27, 2024. The ratio of all residents to sex offenders in zip code 67135 is 266 to 1. The ratio of registered sex offenders to all residents in this zip code is near the state average.
Median resident age:
This zip code:
36.3 years
Kansas median age:
37.6 years
Average household size:
This zip code:
2.9 people
Kansas:
2.4 people
Averages for the 2020 tax year for zip code 67135, filed in 2021:
Average Adjusted Gross Income (AGI) in 2020: $68,825 (Individual Income Tax Returns)
Here:
$68,825
State:
$72,721
Salary/wage: $60,291 (reported on 82.4% of returns)
Here:
$60,291
State:
$58,641
(% of AGI for various income ranges: 1253.8% for AGIs below $25k, 3986.2% for AGIs $25k-50k, 6856.9% for AGIs $50k-75k, 9183.8% for AGIs $75k-100k, 16368.8% for AGIs $100k-200k)
Taxable interest for individuals: $743 (reported on 34.6% of returns)
This zip code:
$743
Kansas:
$1,625
(% of AGI for various income ranges: 22.4% for AGIs below $25k, 9.6% for AGIs $25k-50k, 49.4% for AGIs $50k-75k, 22.3% for AGIs $75k-100k, 91.2% for AGIs $100k-200k)
Ordinary dividends: $2,321 (reported on 18.3% of returns)
Here:
$2,321
State:
$7,290
(% of AGI for various income ranges: 13.1% for AGIs below $25k, 18.8% for AGIs $25k-50k, 76.2% for AGIs $50k-75k, 86.2% for AGIs $75k-100k, 104.7% for AGIs $100k-200k)
Net capital gain/loss in AGI: +$9,700 (reported on 18.3% of returns)
Here:
+$9,700
State:
+$20,511
(% of AGI for various income ranges: 15.2% for AGIs below $25k, 39.6% for AGIs $25k-50k, 158.1% for AGIs $50k-75k, 54.6% for AGIs $75k-100k, 608.2% for AGIs $100k-200k)
Profit/loss from business: +$9,926 (reported on 15.0% of returns)
Here:
+$9,926
State:
+$13,852
(% of AGI for various income ranges: 87.9% for AGIs below $25k, 82.9% for AGIs $25k-50k, 316.9% for AGIs $50k-75k, 316.9% for AGIs $75k-100k, 535.3% for AGIs $100k-200k)
Taxable individual retirement arrangement distribution: $13,839 (reported on 11.8% of returns)
67135:
$13,839
Kansas:
$19,921
(% of AGI for various income ranges: 84.5% for AGIs below $25k, 130.4% for AGIs $25k-50k, 312.5% for AGIs $50k-75k, 304.6% for AGIs $75k-100k, 610.0% for AGIs $100k-200k)
Total itemized deductions: $31,733 (reported on 5.9% of returns)
Here:
$31,733
State:
$36,939
(% of AGI for various income ranges: 579.4% for AGIs $50k-75k, 639.4% for AGIs $100k-200k)
Charity contributions: $13,929 (reported on 4.6% of returns)
Here:
$13,929
State:
$15,443
(% of AGI for various income ranges: 43.8% for AGIs below $25k, 218.8% for AGIs $100k-200k)
Taxes paid: $7,656 (reported on 5.9% of returns)
67135:
$7,656
State:
$8,001
(% of AGI for various income ranges: 119.4% for AGIs $50k-75k, 175.3% for AGIs $100k-200k)
Earned income credit: $2,317 (reported on 11.8% of returns)
Here:
$2,317
State:
$2,267
(% of AGI for various income ranges: 80.0% for AGIs below $25k, 77.1% for AGIs $25k-50k)
Percentage of individuals using paid preparers for their 2020 taxes: 94.8%
Here:
95%
State:
95%
(% for various income ranges: 95.6% for AGIs below $25k, 97.0% for AGIs $25k-50k, 95.8% for AGIs $50k-75k, 94.4% for AGIs $75k-100k, 92.6% for AGIs $100k-200k, 83.3% for AGIs over 200k)
Averages for the 2012 tax year for zip code 67135, filed in 2013:
Average Adjusted Gross Income (AGI) in 2012: $58,031 (Individual Income Tax Returns)
Here:
$58,031
State:
$60,095
Salary/wage: $52,150 (reported on 83.7% of returns)
Here:
$52,150
State:
$48,770
(% of AGI for various income ranges: 69.5% for AGIs below $25k, 79.7% for AGIs $25k-50k, 74.7% for AGIs $50k-75k, 83.0% for AGIs $75k-100k, 78.8% for AGIs $100k-200k, 54.8% for AGIs over 200k)
Taxable interest for individuals: $589 (reported on 38.1% of returns)
This zip code:
$589
Kansas:
$1,506
(% of AGI for various income ranges: 0.9% for AGIs below $25k, 0.3% for AGIs $25k-50k, 0.4% for AGIs $50k-75k, 0.2% for AGIs $75k-100k, 0.3% for AGIs $100k-200k, 0.6% for AGIs over 200k)
Ordinary dividends: $1,862 (reported on 17.7% of returns)
Here:
$1,862
State:
$6,093
(% of AGI for various income ranges: 0.9% for AGIs below $25k, 0.5% for AGIs $25k-50k, 0.5% for AGIs $50k-75k, 0.3% for AGIs $75k-100k, 1.0% for AGIs $100k-200k)
Net capital gain/loss in AGI: +$6,000 (reported on 14.3% of returns)
Here:
+$6,000
State:
+$14,598
(% of AGI for various income ranges: 0.2% for AGIs below $25k, 0.4% for AGIs $25k-50k, 0.6% for AGIs $50k-75k, 0.2% for AGIs $75k-100k, 4.1% for AGIs $100k-200k)
Profit/loss from business: +$8,542 (reported on 16.3% of returns)
Here:
+$8,542
State:
+$12,554
(% of AGI for various income ranges: 6.5% for AGIs below $25k, 4.9% for AGIs $25k-50k, 3.4% for AGIs $50k-75k, 0.8% for AGIs $75k-100k, 1.9% for AGIs $100k-200k)
Taxable individual retirement arrangement distribution: $9,706 (reported on 11.6% of returns)
67135:
$9,706
Kansas:
$14,098
(% of AGI for various income ranges: 4.8% for AGIs below $25k, 2.1% for AGIs $25k-50k, 2.5% for AGIs $50k-75k, 1.8% for AGIs $75k-100k, 1.9% for AGIs $100k-200k)
Total itemized deductions: $20,317 (20% of AGI, reported on 32.0% of returns)
Here:
$20,317
State:
$23,678
Here:
19.5% of AGI
State:
18.9% of AGI
(% of AGI for various income ranges: 8.3% for AGIs below $25k, 10.6% for AGIs $25k-50k, 8.4% for AGIs $50k-75k, 9.4% for AGIs $75k-100k, 14.4% for AGIs $100k-200k, 11.8% for AGIs over 200k)
Charity contributions: $4,067 (reported on 26.5% of returns)
Here:
$4,067
State:
$5,321
(% of AGI for various income ranges: 1.3% for AGIs below $25k, 1.4% for AGIs $25k-50k, 1.2% for AGIs $50k-75k, 1.2% for AGIs $75k-100k, 2.8% for AGIs $100k-200k, 2.1% for AGIs over 200k)
Taxes paid: $7,837 (reported on 31.3% of returns)
67135:
$7,837
State:
$9,548
(% of AGI for various income ranges: 1.5% for AGIs below $25k, 2.5% for AGIs $25k-50k, 2.6% for AGIs $50k-75k, 3.7% for AGIs $75k-100k, 6.1% for AGIs $100k-200k, 5.7% for AGIs over 200k)
Earned income credit: $2,445 (reported on 13.6% of returns)
Here:
$2,445
State:
$2,212
(% of AGI for various income ranges: 6.4% for AGIs below $25k, 1.1% for AGIs $25k-50k)
Percentage of individuals using paid preparers for their 2012 taxes: 58.5%
Here:
59%
State:
56%
(% for various income ranges: 55.1% for AGIs below $25k, 56.2% for AGIs $25k-50k, 58.3% for AGIs $50k-75k, 61.1% for AGIs $75k-100k, 66.7% for AGIs $100k-200k, 66.7% for AGIs over 200k)
Averages for the 2004 tax year for zip code 67135, filed in 2005:
Average Adjusted Gross Income (AGI) in 2004: $43,762 (Individual Income Tax Returns)
Here:
$43,762
State:
$45,726
Salary/wage: $40,566 (reported on 85.9% of returns)
Here:
$40,566
State:
$40,112
(% of AGI for various income ranges: 191.3% for AGIs below $10k, 72.9% for AGIs $10k-25k, 82.6% for AGIs $25k-50k, 84.2% for AGIs $50k-75k, 88.2% for AGIs $75k-100k, 60.3% for AGIs over 100k)
Taxable interest for individuals: $828 (reported on 49.0% of returns)
This zip code:
$828
Kansas:
$1,749
(% of AGI for various income ranges: 10.5% for AGIs below $10k, 3.0% for AGIs $10k-25k, 0.9% for AGIs $25k-50k, 0.7% for AGIs $50k-75k, 0.3% for AGIs $75k-100k, 0.6% for AGIs over 100k)
Taxable dividends: $1,220 (reported on 23.0% of returns)
Here:
$1,220
State:
$3,066
(% of AGI for various income ranges: 3.0% for AGIs below $10k, 0.6% for AGIs $10k-25k, 0.6% for AGIs $25k-50k, 0.7% for AGIs $50k-75k, 0.3% for AGIs $75k-100k, 0.9% for AGIs over 100k)
Net capital gain/loss: +$3,969 (reported on 17.0% of returns)
Here:
+$3,969
State:
+$7,555
(% of AGI for various income ranges: 6.2% for AGIs below $10k, 0.1% for AGIs $10k-25k, 0.8% for AGIs $25k-50k, 0.9% for AGIs $50k-75k, 0.1% for AGIs $75k-100k, 4.8% for AGIs over 100k)
Profit/loss from business: +$4,097 (reported on 17.6% of returns)
Here:
+$4,097
State:
+$9,571
(% of AGI for various income ranges: -9.0% for AGIs below $10k, 2.8% for AGIs $10k-25k, 3.5% for AGIs $25k-50k, 2.1% for AGIs $50k-75k, 0.6% for AGIs $75k-100k, 0.1% for AGIs over 100k)
IRA payment deduction: $2,844 (reported on 2.4% of returns)
67135:
$2,844
Kansas:
$2,922
Total itemized deductions: $15,155 (22% of AGI, reported on 32.2% of returns)
Here:
$15,155
State:
$18,779
Here:
21.6% of AGI
State:
20.5% of AGI
(% of AGI for various income ranges: 11.8% for AGIs $10k-25k, 9.6% for AGIs $25k-50k, 11.7% for AGIs $50k-75k, 12.7% for AGIs $75k-100k, 10.7% for AGIs over 100k)
Charity contributions deductions: $2,672 (4% of AGI, reported on 28.1% of returns)
Here:
$2,672
State:
$3,892
Here:
3.6% of AGI
State:
4.0% of AGI
(% of AGI for various income ranges: 1.3% for AGIs $10k-25k, 1.5% for AGIs $25k-50k, 1.6% for AGIs $50k-75k, 2.4% for AGIs $75k-100k, 1.8% for AGIs over 100k)
Total tax: $5,563 (reported on 77.1% of returns)
67135:
$5,563
State:
$7,203
(% of AGI for various income ranges: 5.6% for AGIs below $10k, 4.3% for AGIs $10k-25k, 6.3% for AGIs $25k-50k, 8.0% for AGIs $50k-75k, 10.1% for AGIs $75k-100k, 17.9% for AGIs over 100k)
Earned income credit: $1,644 (reported on 10.9% of returns)
Here:
$1,644
State:
$1,674
Percentage of individuals using paid preparers for their 2004 taxes: 66.9%
Here:
67%
State:
63%
(% for various income ranges: 58.3% for AGIs below $10k, 69.4% for AGIs $10k-25k, 67.8% for AGIs $25k-50k, 67.5% for AGIs $50k-75k, 65.9% for AGIs $75k-100k, 78.5% for AGIs over 100k)
Household received Food Stamps/SNAP in the past 12 months: 33 Household did not receive Food Stamps/SNAP in the past 12 months: 1,140
Women who had a birth in the past 12 months: 19 (16 now married, 2 unmarried) Women who did not have a birth in the past 12 months: 995 (485 now married, 509 unmarried)
Housing units in zip code 67135 with a mortgage: 690 (55 second mortgage, 56 both second mortgage and home equity loan) Houses without a mortgage: 16
Median monthly owner costs for units with a mortgage: $1,582 Median monthly owner costs for units without a mortgage: $589
Residents with income below the poverty level in 2022:
This zip code:
5.8%
Whole state:
12.0%
Residents with income below 50% of the poverty level in 2022:
This zip code:
2.6%
Whole state:
6.4%
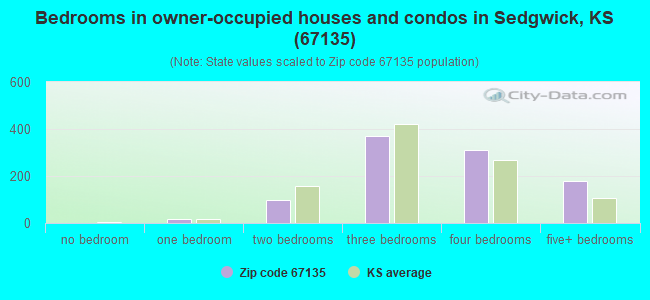
Median number of rooms in houses and condos:
Here:
7.8
State:
6.9
Median number of rooms in apartments:
Here:
4.9
State:
4.4
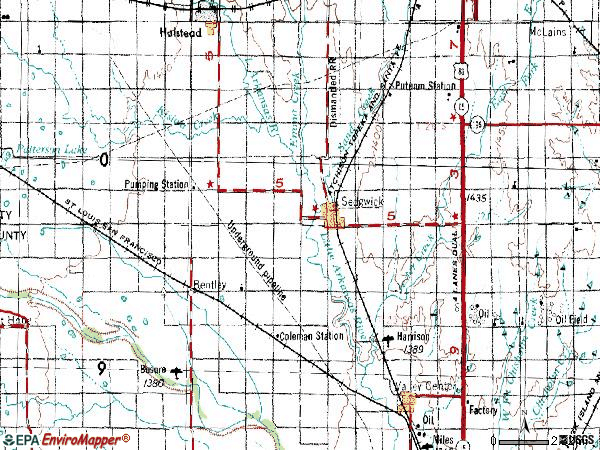
Notable locations in this zip code not listed on our city pages
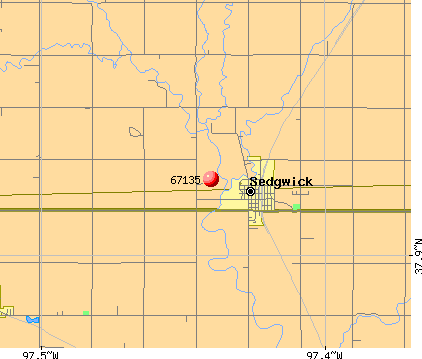
Notable locations in zip code 67135: Kansas Department of Transportation Harvey County Rest Stop (A), Sedgwick Wastewater Treatment Plant (B), Sedgwick Industrial Park (C), Bentley Police Department (D), Sedgwick Police Department (E), KMTW - TV (Wichita) (F), Sedgwick Volunteer Fire Department (G), Sedgwick Recreation Center (H), Lillian Tear Library (I), Bentley City Hall (J), Sedgwick Senior Center (K), City of Sedgwick Administrative Offices (L), City of Sedgwick Volunteer Ambulance Department (M), Bentley Fire and Emergency Management Services (N), Sedgwick Community Center (O). Display/hide their locations on the map
Churches in zip code 67135 include: Sedgwick United Methodist Church (A), First Christian Church (B), Plymouth Congregational Church (C), Bethany Baptist Church (D), Pleasant Valley Church (E), Bentley United Methodist Church (F). Display/hide their locations on the map
707 married couples with children.
138 single-parent households (10 men, 128 women).
93.7% of residents of 67135 zip code speak English at home.
5.4% of residents speak Spanish at home (97% very well, 3% not well).
0.3% of residents speak other Indo-European language at home (100% very well).
0.6% of residents speak Asian or Pacific Island language at home (100% very well).
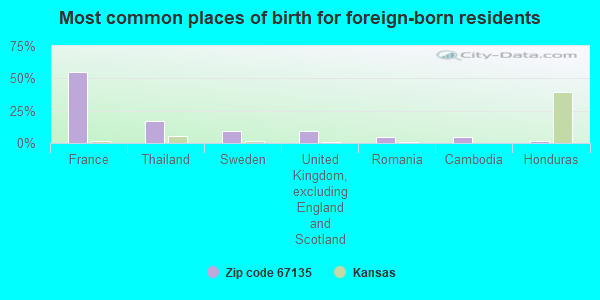
Foreign born population: 63 (1.9%) (100.0% of them are naturalized citizens)
This zip code:
1.9%
Whole state:
7.1%
55%France
17%Thailand
9%Sweden
9%United Kingdom, excluding England and Scotland
5%Romania
5%Cambodia
2%Honduras
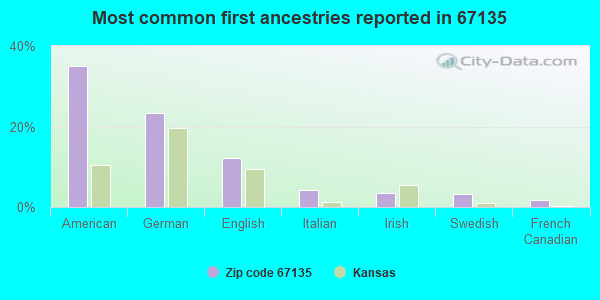
35%American
23%German
12%English
4%Italian
3%Irish
3%Swedish
2%French Canadian
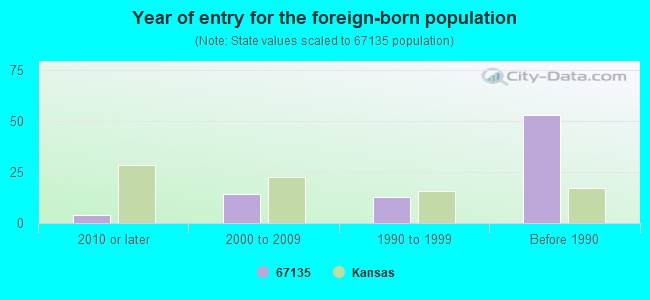
Year of entry for the foreign-born population
42010 or later
142000 to 2009
131990 to 1999
53Before 1990
Major facilities with environmental interests located in this zip code:
MORRIS, JERRY P. (8807 SOUTH SPRING LAKE ROAD in SEDGWICK, KS)
STATE MASTER (Kansas Facility Profiler) - CAFO-10973, LIVE STOCK WASTE CONTROL National Pollutant Discharge Elimination System NON-MAJOR (Tracking pollutant discharge elimination systems) - permit Business SIC classification: HOGS Alternative names: JERRY P MORRIS
COASTAL MART 9130 (401 N COMMERCIAL in SEDGWICK, KS)
(Resource Conservation and Recovery Act (tracking hazardous waste)) Conditionally Exempt Small Quantity Generators, less than 100 kg/month of hazardous waste (Resource Conservation and Recovery Act (tracking hazardous waste)) - notification Organizations: COASTAL MART INC (CONTACT/OWNER)
UNDERGROUND SOLUTIONS, L.L.C. (205 W 1ST in SEDGWICK, KS)
(Resource Conservation and Recovery Act (tracking hazardous waste)) Organizations: REX FARLEY (CONTACT/OPERATOR)
Alternative names: SUBSURFACE SYSTEMS INC, SUBSURFACE SYS INC
MT AVIATION CONSULTANTS LLC (301 S COMMERCIAL ST in SEDGWICK, KS)
ANDALE FARMERS COOPERATIVE CO. (EAST 4TH STREET AT NORTH JACKSON AVENUE in SEDGWICK, KS)
AIR MINOR (AIRS/AFS) Business SIC classification: GRAIN AND FIELD BEANS
BILL BLACK (1/2 ME 1 1/2 MN OF I34 & I25 in SEDGWICK, KS)
(Resource Conservation and Recovery Act (tracking hazardous waste))
BURRIS ENTERPRISES (408 E 4TH in SEDGWICK, KS)
(Resource Conservation and Recovery Act (tracking hazardous waste)) Organizations: G L MOSIMAN (CONTACT/OWNER)
MOBIL OIL CORP (RURAL in SEDGWICK, KS)
(Resource Conservation and Recovery Act (tracking hazardous waste)) Organizations: MOBIL OIL CORPORATION (CONTACT/OWNER)
BURRIS FABRICATION (612 N JACKSON in SEDGWICK, KS)
Conditionally Exempt Small Quantity Generators, less than 100 kg/month of hazardous waste (Resource Conservation and Recovery Act (tracking hazardous waste)) Organizations: MICHAEL BURRIS (CONTACT/OPERATOR)
, MICHAEL BURRIS (CONTACT/OWNER)
UNRUH FAB INC (100 INDUSTRIAL in SEDGWICK, KS)
Conditionally Exempt Small Quantity Generators, less than 100 kg/month of hazardous waste (Resource Conservation and Recovery Act (tracking hazardous waste)) Business NAICS classification: MOTOR VEHICLE BODY MANUFACTURING.; TRUCK TRAILER MANUFACTURING. Organizations: UNRUH FAB INC (CONTACT/OPERATOR)
MCGINN FARM (RURAL ROUTE 1 in SEDGWICK, KS)
National Pollutant Discharge Elimination System NON-MAJOR (Tracking pollutant discharge elimination systems) - permit Business SIC classification: HOGS
KURR CATTLE COMPANY (RURAL ROUTE 2 in SEDGWICK, KS)
National Pollutant Discharge Elimination System NON-MAJOR (Tracking pollutant discharge elimination systems) - permit Business SIC classification: BEEF CATTLE FEEDLOTS
ACCU RATE SERVICES (407 WEST 4TH STREET in SEDGWICK, KS)
COMPLIANCE ACTIVITY (Tracking inspections of insecticide, fungicide, and rodenticide, and toxic substances) Alternative names: ACCU-RATE
Housing units lacking complete plumbing facilities: 0.5% Housing units lacking complete kitchen facilities: 0.6%
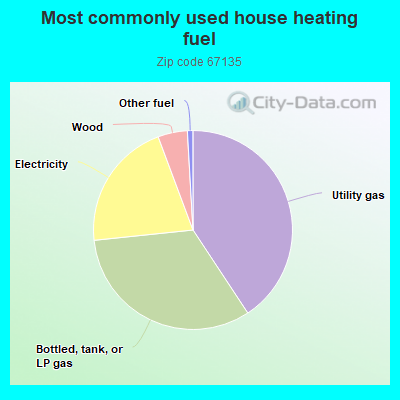
40.8%Utility gas
32.7%Bottled, tank, or LP gas
21.0%Electricity
4.8%Wood
0.9%Other fuel
Population in 1990: 7,706.
Place of birth for U.S.-born residents:
This state: 2,722
Northeast: 43
Midwest: 260
South: 191
West: 118
64% of the 67135 zip code residents lived in the same house 5 years ago. Out of people who lived in different houses, 41% lived in this county. Out of people who lived in different counties, 50% lived in Kansas.
93% of the 67135 zip code residents lived in the same house 1 year ago. Out of people who lived in different houses, 34% moved from this county. Out of people who lived in different houses, 33% moved from different county within same state. Out of people who lived in different houses, 32% moved from different state. Out of people who lived in different houses, 4% moved from abroad.
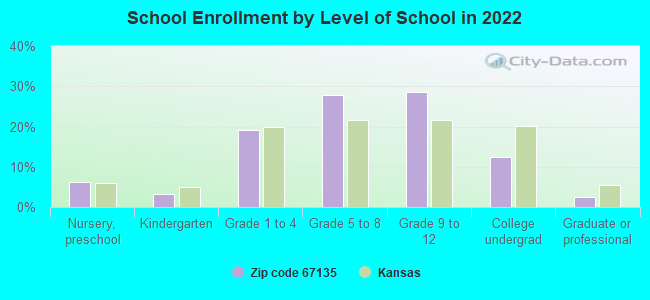
Private vs. public school enrollment:
Students in private schools in grades 1 to 8 (elementary and middle school): 62
Here:
14.7%
Kansas:
14.1%
Students in private schools in grades 9 to 12 (high school): 12
Here:
5.1%
Kansas:
10.8%
Students in private undergraduate colleges: 8
Here:
8.0%
Kansas:
15.4%
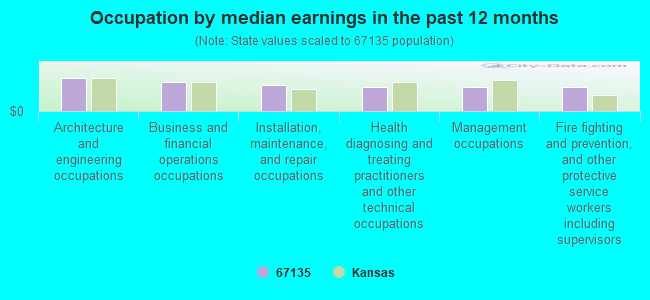
Occupation by median earnings in the past 12 months ($)
104,111Architecture and engineering occupations
93,316Business and financial operations occupations
82,434Installation, maintenance, and repair occupations
78,291Health diagnosing and treating practitioners and other technical occupations
76,410Management occupations
75,811Fire fighting and prevention, and other protective service workers including supervisors
Companies with federal contracts located in this zip code:
UNRUH FABRICATORS, INC (100 INDUSTRIAL DR in SEDGWICK, KS; small business)
$84,500 with Army for Fire Fighting Equipment. Signed on 2004-07-24. Completion date: 2004-08-20.
Top industries in this zip code by the number of employees in 2005:
Health Care and Social Assistance: Nursing Care Facilities (50-99 employees: 1 establishment)
Other Services (except Public Administration): Religious Organizations (5-9: 2, 1-4: 1)
Finance and Insurance: Commercial Banking (10-19: 1)
Wholesale Trade: Grain and Field Bean Merchant Wholesalers (10-19: 1)
Construction: New Single-Family Housing Construction (except Operative Builders) (1-4: 4)
Construction: Commercial and Institutional Building Construction (5-9: 1)
Professional, Scientific, and Technical Services: Veterinary Services (5-9: 1)
People in group quarters in 2010:
56 people in nursing facilities/skilled-nursing facilities
People in group quarters in 2000:
62 people in nursing homes
5 people in other group homes
Fatal accident statistics in 2012:
Fatal accident count: 1
Vehicles involved in fatal accidents: 2
Fatal accidents caused by drunken drivers: 0
Fatalities: 1
Persons involved in fatal accidents: 2
Pedestrians involved in fatal accidents: 0
Fatal accident statistics in 2011:
Fatal accident count: 1
Vehicles involved in fatal accidents: 1
Fatal accidents caused by drunken drivers: 0
Fatalities: 1
Persons involved in fatal accidents: 1
Pedestrians involved in fatal accidents: 0
Home Mortgage Disclosure Act Aggregated Statistics For Year 2009 (Based on 6 partial tracts)
A) FHA, FSA/RHS & VA Home Purchase Loans
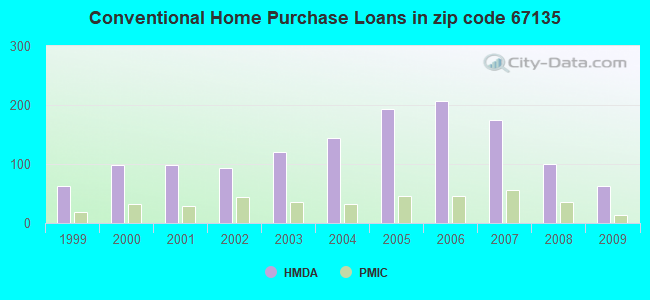
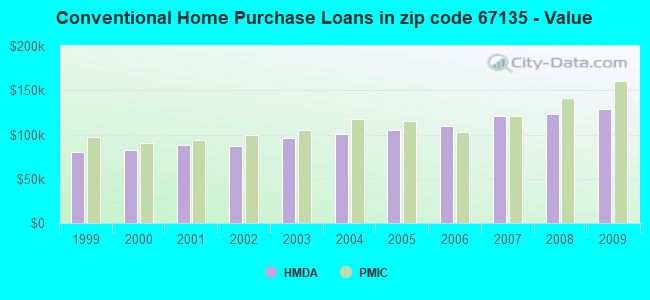
B) Conventional Home Purchase Loans
C) Refinancings
D) Home Improvement Loans
F) Non-occupant Loans on < 5 Family Dwellings (A B C & D)
G) Loans On Manufactured Home Dwelling (A B C & D)
Number
Average Value
Number
Average Value
Number
Average Value
Number
Average Value
Number
Average Value
Number
Average Value
LOANS ORIGINATED
67
$121,741
63
$129,267
254
$123,573
31
$31,227
24
$69,947
7
$68,437
APPLICATIONS APPROVED, NOT ACCEPTED
1
$177,810
7
$126,579
21
$118,348
2
$34,995
0
$0
5
$47,130
APPLICATIONS DENIED
22
$92,175
19
$96,451
78
$122,211
18
$35,330
6
$64,945
7
$63,490
APPLICATIONS WITHDRAWN
11
$132,351
4
$134,108
49
$147,841
4
$40,722
2
$143,350
0
$0
FILES CLOSED FOR INCOMPLETENESS
6
$81,403
1
$126,920
6
$234,242
3
$14,300
0
$0
1
$32,430
Aggregated Statistics For Year 2008 (Based on 6 partial tracts)
A) FHA, FSA/RHS & VA Home Purchase Loans
B) Conventional Home Purchase Loans
C) Refinancings
D) Home Improvement Loans
E) Loans on Dwellings For 5+ Families
F) Non-occupant Loans on < 5 Family Dwellings (A B C & D)
G) Loans On Manufactured Home Dwelling (A B C & D)
Number
Average Value
Number
Average Value
Number
Average Value
Number
Average Value
Number
Average Value
Number
Average Value
Number
Average Value
LOANS ORIGINATED
57
$117,415
100
$122,719
152
$120,024
43
$37,616
1
$1,523,590
36
$73,719
16
$60,399
APPLICATIONS APPROVED, NOT ACCEPTED
4
$88,528
12
$118,684
18
$147,963
7
$29,953
0
$0
2
$49,035
5
$64,370
APPLICATIONS DENIED
8
$97,655
25
$71,786
101
$116,368
34
$54,514
0
$0
6
$114,025
8
$50,566
APPLICATIONS WITHDRAWN
5
$97,544
7
$106,620
43
$148,584
5
$84,462
0
$0
3
$76,013
1
$14,730
FILES CLOSED FOR INCOMPLETENESS
1
$134,280
2
$45,095
8
$148,052
1
$36,260
0
$0
0
$0
0
$0
Aggregated Statistics For Year 2007 (Based on 6 partial tracts)
A) FHA, FSA/RHS & VA Home Purchase Loans
B) Conventional Home Purchase Loans
C) Refinancings
D) Home Improvement Loans
F) Non-occupant Loans on < 5 Family Dwellings (A B C & D)
G) Loans On Manufactured Home Dwelling (A B C & D)
Number
Average Value
Number
Average Value
Number
Average Value
Number
Average Value
Number
Average Value
Number
Average Value
LOANS ORIGINATED
36
$113,317
175
$121,059
153
$99,691
54
$30,856
33
$72,114
13
$72,016
APPLICATIONS APPROVED, NOT ACCEPTED
0
$0
16
$114,816
25
$124,685
6
$69,682
3
$103,617
5
$76,694
APPLICATIONS DENIED
7
$91,503
38
$104,897
122
$114,428
51
$53,155
10
$95,624
21
$69,383
APPLICATIONS WITHDRAWN
3
$61,417
14
$116,370
46
$105,079
7
$61,941
2
$88,560
2
$64,010
FILES CLOSED FOR INCOMPLETENESS
0
$0
1
$123,350
11
$126,279
2
$54,675
1
$40,800
1
$66,290
Aggregated Statistics For Year 2006 (Based on 6 partial tracts)
A) FHA, FSA/RHS & VA Home Purchase Loans
B) Conventional Home Purchase Loans
C) Refinancings
D) Home Improvement Loans
F) Non-occupant Loans on < 5 Family Dwellings (A B C & D)
G) Loans On Manufactured Home Dwelling (A B C & D)
Number
Average Value
Number
Average Value
Number
Average Value
Number
Average Value
Number
Average Value
Number
Average Value
LOANS ORIGINATED
28
$103,272
206
$109,554
175
$99,329
57
$30,363
37
$79,738
15
$61,583
APPLICATIONS APPROVED, NOT ACCEPTED
2
$70,190
21
$111,526
39
$100,732
6
$40,868
2
$87,590
5
$58,300
APPLICATIONS DENIED
2
$131,005
54
$89,611
140
$113,532
33
$41,949
16
$93,148
15
$50,500
APPLICATIONS WITHDRAWN
2
$99,155
12
$121,392
83
$117,015
6
$68,468
3
$94,940
5
$98,788
FILES CLOSED FOR INCOMPLETENESS
0
$0
5
$78,296
19
$115,685
0
$0
1
$194,340
0
$0
Aggregated Statistics For Year 2005 (Based on 6 partial tracts)
A) FHA, FSA/RHS & VA Home Purchase Loans
B) Conventional Home Purchase Loans
C) Refinancings
D) Home Improvement Loans
E) Loans on Dwellings For 5+ Families
F) Non-occupant Loans on < 5 Family Dwellings (A B C & D)
G) Loans On Manufactured Home Dwelling (A B C & D)
Number
Average Value
Number
Average Value
Number
Average Value
Number
Average Value
Number
Average Value
Number
Average Value
Number
Average Value
LOANS ORIGINATED
25
$125,909
194
$105,235
176
$96,142
49
$29,197
1
$532,600
35
$66,346
15
$54,253
APPLICATIONS APPROVED, NOT ACCEPTED
3
$67,410
24
$109,007
27
$103,923
5
$19,716
0
$0
1
$226,640
6
$54,770
APPLICATIONS DENIED
3
$98,950
48
$94,493
159
$92,744
30
$33,004
0
$0
9
$62,598
22
$62,900
APPLICATIONS WITHDRAWN
2
$89,630
22
$95,352
92
$110,570
10
$82,807
0
$0
4
$77,870
5
$73,492
FILES CLOSED FOR INCOMPLETENESS
0
$0
7
$104,757
15
$101,160
1
$45,560
0
$0
1
$95,760
1
$34,560
Aggregated Statistics For Year 2004 (Based on 6 partial tracts)
A) FHA, FSA/RHS & VA Home Purchase Loans
B) Conventional Home Purchase Loans
C) Refinancings
D) Home Improvement Loans
F) Non-occupant Loans on < 5 Family Dwellings (A B C & D)
G) Loans On Manufactured Home Dwelling (A B C & D)
Number
Average Value
Number
Average Value
Number
Average Value
Number
Average Value
Number
Average Value
Number
Average Value
LOANS ORIGINATED
24
$89,159
144
$100,631
230
$93,845
42
$25,481
32
$72,662
12
$47,261
APPLICATIONS APPROVED, NOT ACCEPTED
2
$109,565
19
$90,116
39
$99,881
6
$16,197
5
$65,576
6
$60,913
APPLICATIONS DENIED
4
$80,155
37
$82,654
144
$98,755
24
$36,802
7
$65,661
17
$61,104
APPLICATIONS WITHDRAWN
1
$59,790
9
$87,612
54
$94,179
7
$39,214
0
$0
2
$79,815
FILES CLOSED FOR INCOMPLETENESS
1
$60,900
3
$73,980
17
$99,112
1
$3,970
1
$73,660
0
$0
Aggregated Statistics For Year 2003 (Based on 6 partial tracts)
A) FHA, FSA/RHS & VA Home Purchase Loans
B) Conventional Home Purchase Loans
C) Refinancings
D) Home Improvement Loans
E) Loans on Dwellings For 5+ Families
F) Non-occupant Loans on < 5 Family Dwellings (A B C & D)
Number
Average Value
Number
Average Value
Number
Average Value
Number
Average Value
Number
Average Value
Number
Average Value
LOANS ORIGINATED
27
$92,507
121
$95,507
402
$92,491
40
$16,896
1
$210,780
23
$57,553
APPLICATIONS APPROVED, NOT ACCEPTED
1
$126,830
14
$93,134
49
$97,710
3
$15,023
0
$0
4
$53,018
APPLICATIONS DENIED
2
$101,735
37
$73,128
127
$82,316
12
$15,822
0
$0
4
$51,850
APPLICATIONS WITHDRAWN
2
$153,220
11
$105,174
62
$91,750
3
$39,467
0
$0
3
$69,983
FILES CLOSED FOR INCOMPLETENESS
1
$132,580
6
$81,298
12
$77,534
1
$28,330
0
$0
1
$57,080
Aggregated Statistics For Year 2002 (Based on 6 partial tracts)
A) FHA, FSA/RHS & VA Home Purchase Loans
B) Conventional Home Purchase Loans
C) Refinancings
D) Home Improvement Loans
F) Non-occupant Loans on < 5 Family Dwellings (A B C & D)
Number
Average Value
Number
Average Value
Number
Average Value
Number
Average Value
Number
Average Value
LOANS ORIGINATED
28
$89,425
94
$86,960
286
$91,781
34
$17,716
22
$55,511
APPLICATIONS APPROVED, NOT ACCEPTED
2
$75,500
18
$100,438
43
$86,308
7
$25,364
3
$239,487
APPLICATIONS DENIED
3
$89,747
35
$65,792
98
$79,268
20
$14,167
0
$0
APPLICATIONS WITHDRAWN
1
$88,390
10
$91,884
56
$91,311
2
$14,775
1
$18,130
FILES CLOSED FOR INCOMPLETENESS
1
$53,830
7
$64,813
15
$84,299
1
$84,990
1
$18,130
Aggregated Statistics For Year 2001 (Based on 6 partial tracts)
A) FHA, FSA/RHS & VA Home Purchase Loans
B) Conventional Home Purchase Loans
C) Refinancings
D) Home Improvement Loans
F) Non-occupant Loans on < 5 Family Dwellings (A B C & D)
Number
Average Value
Number
Average Value
Number
Average Value
Number
Average Value
Number
Average Value
LOANS ORIGINATED
33
$78,221
98
$87,817
242
$81,768
50
$19,907
26
$53,019
APPLICATIONS APPROVED, NOT ACCEPTED
0
$0
16
$63,972
31
$89,125
7
$13,681
1
$67,950
APPLICATIONS DENIED
3
$65,807
36
$60,005
79
$74,380
21
$13,877
2
$39,790
APPLICATIONS WITHDRAWN
1
$85,750
10
$96,524
52
$81,451
7
$15,780
2
$40,190
FILES CLOSED FOR INCOMPLETENESS
0
$0
2
$62,015
13
$75,791
1
$43,430
0
$0
Aggregated Statistics For Year 2000 (Based on 6 partial tracts)
A) FHA, FSA/RHS & VA Home Purchase Loans
B) Conventional Home Purchase Loans
C) Refinancings
D) Home Improvement Loans
F) Non-occupant Loans on < 5 Family Dwellings (A B C & D)
Number
Average Value
Number
Average Value
Number
Average Value
Number
Average Value
Number
Average Value
LOANS ORIGINATED
33
$75,205
99
$82,702
105
$72,017
46
$15,126
16
$45,509
APPLICATIONS APPROVED, NOT ACCEPTED
5
$59,908
23
$63,334
16
$83,793
12
$13,960
0
$0
APPLICATIONS DENIED
5
$34,562
48
$44,630
73
$60,636
19
$18,579
2
$26,575
APPLICATIONS WITHDRAWN
4
$68,340
10
$84,959
46
$59,310
3
$29,803
1
$43,060
FILES CLOSED FOR INCOMPLETENESS
0
$0
3
$65,957
8
$63,769
1
$3,970
0
$0
Aggregated Statistics For Year 1999 (Based on 3 partial tracts)
A) FHA, FSA/RHS & VA Home Purchase Loans
B) Conventional Home Purchase Loans
C) Refinancings
D) Home Improvement Loans
F) Non-occupant Loans on < 5 Family Dwellings (A B C & D)
2002 - 2018 National Fire Incident Reporting System (NFIRS) incidents
Based on the data from the years 2002 - 2018 the average number of fires per year is 22. The highest number of reported fires - 38 took place in 2017, and the least - 8 in 2008. The data has a growing trend.
When looking into fire subcategories, the most incidents belonged to: Outside Fires (64.9%), and Structure Fires (21.2%).
Fire incident types reported to NFIRS in Zip Code 67135


 Nearest zip codes: 67016, 67056, 67101, 67147, 67030, 67205.
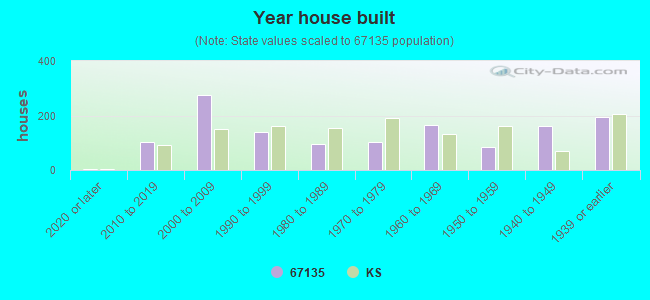


 Based on the data from the years 2002 - 2018 the average number of fires per year is 22. The highest number of reported fires - 38 took place in 2017, and the least - 8 in 2008. The data has a growing trend.
 When looking into fire subcategories, the most incidents belonged to: Outside Fires (64.9%), and Structure Fires (21.2%).