Estimated zip code population in 2022: 44,189 Zip code population in 2010: 44,707 Zip code population in 2000: 45,590
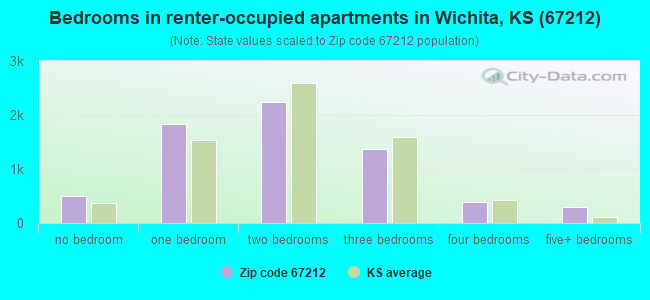
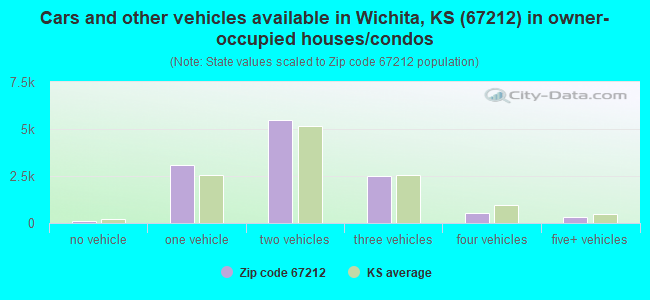
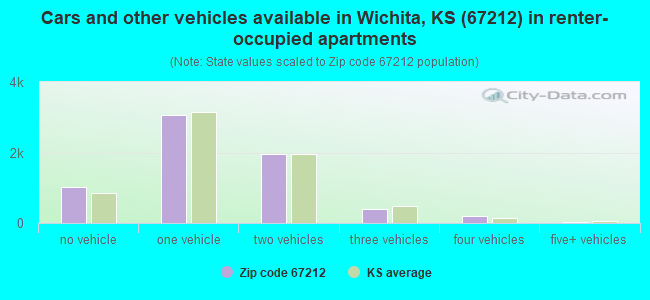
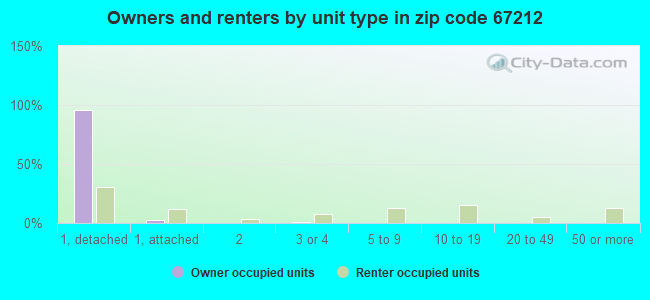
Houses and condos: 19,610 Renter-occupied apartments: 6,632
% of renters here:
36%
State:
32%
March 2022 cost of living index in zip code 67212: 82.7 (low, U.S. average is 100)
Land area: 12.7 sq. mi. Water area: 0.5 sq. mi.
Population density: 3,482 people per square mile
(average).
OSM Map
General Map
Google Map
MSN Map
OSM Map
General Map
Google Map
MSN Map
OSM Map
General Map
Google Map
MSN Map
OSM Map
General Map
Google Map
MSN Map
Please wait while loading the map...
Real estate property taxes paid for housing units in 2022:
This zip code:
1.1% ($2,183)
Kansas:
1.2% ($2,578)
Median real estate property taxes paid for housing units with mortgages in 2022: $2,211 (1.1%) Median real estate property taxes paid for housing units with no mortgage in 2022: $2,125 (1.1%)
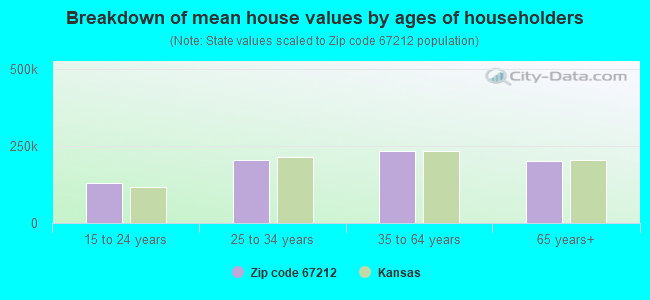
Estimated median house/condo value in 2022: $194,486
67212:
$194,486
Kansas:
$206,600
According to our research of Kansas and other state lists, there were 91 registered sex offenders living in 67212 zip code as of April 27, 2024. The ratio of all residents to sex offenders in zip code 67212 is 500 to 1. The ratio of registered sex offenders to all residents in this zip code is lower than the state average.
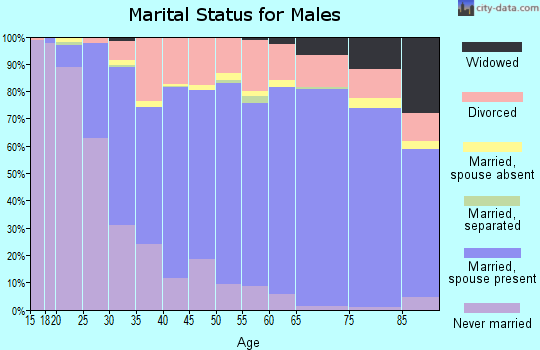
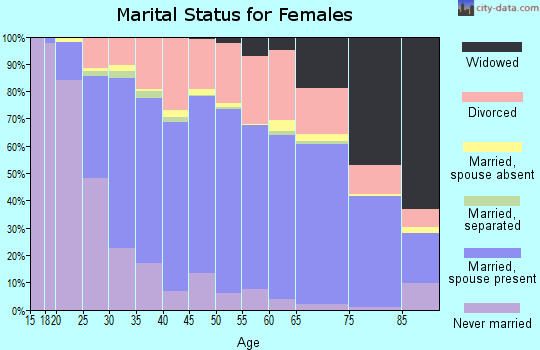
Median resident age:
This zip code:
36.0 years
Kansas median age:
37.6 years
Average household size:
This zip code:
2.4 people
Kansas:
2.4 people
Averages for the 2020 tax year for zip code 67212, filed in 2021:
Average Adjusted Gross Income (AGI) in 2020: $56,150 (Individual Income Tax Returns)
Here:
$56,150
State:
$72,721
Salary/wage: $48,072 (reported on 81.5% of returns)
Here:
$48,072
State:
$58,641
(% of AGI for various income ranges: 1190.2% for AGIs below $25k, 3605.1% for AGIs $25k-50k, 6372.3% for AGIs $50k-75k, 9377.5% for AGIs $75k-100k, 15901.0% for AGIs $100k-200k, 57766.0% for AGIs over 200k)
Taxable interest for individuals: $1,265 (reported on 33.3% of returns)
This zip code:
$1,265
Kansas:
$1,625
(% of AGI for various income ranges: 21.6% for AGIs below $25k, 24.8% for AGIs $25k-50k, 42.8% for AGIs $50k-75k, 63.3% for AGIs $75k-100k, 153.1% for AGIs $100k-200k, 2404.0% for AGIs over 200k)
Ordinary dividends: $3,592 (reported on 18.7% of returns)
Here:
$3,592
State:
$7,290
(% of AGI for various income ranges: 22.9% for AGIs below $25k, 36.2% for AGIs $25k-50k, 80.4% for AGIs $50k-75k, 140.1% for AGIs $75k-100k, 269.6% for AGIs $100k-200k, 3259.0% for AGIs over 200k)
Net capital gain/loss in AGI: +$7,801 (reported on 16.9% of returns)
Here:
+$7,801
State:
+$20,511
(% of AGI for various income ranges: 11.6% for AGIs below $25k, 29.0% for AGIs $25k-50k, 73.4% for AGIs $50k-75k, 191.9% for AGIs $75k-100k, 558.8% for AGIs $100k-200k, 12998.0% for AGIs over 200k)
Profit/loss from business: +$10,869 (reported on 12.4% of returns)
Here:
+$10,869
State:
+$13,852
(% of AGI for various income ranges: 82.7% for AGIs below $25k, 110.3% for AGIs $25k-50k, 207.9% for AGIs $50k-75k, 282.8% for AGIs $75k-100k, 408.3% for AGIs $100k-200k, 3683.0% for AGIs over 200k)
Taxable individual retirement arrangement distribution: $16,938 (reported on 12.5% of returns)
67212:
$16,938
Kansas:
$19,921
(% of AGI for various income ranges: 86.2% for AGIs below $25k, 121.3% for AGIs $25k-50k, 286.3% for AGIs $50k-75k, 532.6% for AGIs $75k-100k, 1001.0% for AGIs $100k-200k, 4268.0% for AGIs over 200k)
Self-employed (Keogh) retirement plans: $16,886 (reported on 0.3% of returns)
67212:
$16,886
Kansas:
$25,388
(% of AGI for various income ranges: 34.5% for AGIs $75k-100k, 664.0% for AGIs over 200k)
Total itemized deductions: $32,080 (reported on 4.7% of returns)
Here:
$32,080
State:
$36,939
(% of AGI for various income ranges: 34.0% for AGIs below $25k, 74.7% for AGIs $25k-50k, 163.6% for AGIs $50k-75k, 299.0% for AGIs $75k-100k, 673.8% for AGIs $100k-200k, 7874.0% for AGIs over 200k)
Charity contributions: $11,305 (reported on 4.0% of returns)
Here:
$11,305
State:
$15,443
(% of AGI for various income ranges: 3.6% for AGIs below $25k, 10.7% for AGIs $25k-50k, 35.5% for AGIs $50k-75k, 72.5% for AGIs $75k-100k, 244.7% for AGIs $100k-200k, 3097.0% for AGIs over 200k)
Taxes paid: $6,336 (reported on 4.6% of returns)
67212:
$6,336
State:
$8,001
(% of AGI for various income ranges: 3.9% for AGIs below $25k, 8.6% for AGIs $25k-50k, 32.4% for AGIs $50k-75k, 65.6% for AGIs $75k-100k, 169.0% for AGIs $100k-200k, 1234.0% for AGIs over 200k)
Earned income credit: $2,142 (reported on 13.5% of returns)
Here:
$2,142
State:
$2,267
(% of AGI for various income ranges: 72.9% for AGIs below $25k, 57.7% for AGIs $25k-50k, 1.4% for AGIs $50k-75k)
Percentage of individuals using paid preparers for their 2020 taxes: 95.1%
Here:
95%
State:
95%
(% for various income ranges: 94.7% for AGIs below $25k, 95.7% for AGIs $25k-50k, 94.7% for AGIs $50k-75k, 94.7% for AGIs $75k-100k, 95.4% for AGIs $100k-200k, 94.7% for AGIs over 200k)
Averages for the 2012 tax year for zip code 67212, filed in 2013:
Average Adjusted Gross Income (AGI) in 2012: $51,960 (Individual Income Tax Returns)
Here:
$51,960
State:
$60,095
Salary/wage: $45,476 (reported on 84.3% of returns)
Here:
$45,476
State:
$48,770
(% of AGI for various income ranges: 75.4% for AGIs below $25k, 79.1% for AGIs $25k-50k, 77.8% for AGIs $50k-75k, 77.1% for AGIs $75k-100k, 76.7% for AGIs $100k-200k, 42.4% for AGIs over 200k)
Taxable interest for individuals: $1,047 (reported on 39.8% of returns)
This zip code:
$1,047
Kansas:
$1,506
(% of AGI for various income ranges: 1.3% for AGIs below $25k, 0.7% for AGIs $25k-50k, 0.7% for AGIs $50k-75k, 0.7% for AGIs $75k-100k, 0.7% for AGIs $100k-200k, 1.1% for AGIs over 200k)
Ordinary dividends: $3,051 (reported on 20.9% of returns)
Here:
$3,051
State:
$6,093
(% of AGI for various income ranges: 1.4% for AGIs below $25k, 1.0% for AGIs $25k-50k, 0.9% for AGIs $50k-75k, 1.0% for AGIs $75k-100k, 1.2% for AGIs $100k-200k, 2.6% for AGIs over 200k)
Net capital gain/loss in AGI: +$3,852 (reported on 15.4% of returns)
Here:
+$3,852
State:
+$14,598
(% of AGI for various income ranges: 0.1% for AGIs below $25k, 0.2% for AGIs $25k-50k, 0.3% for AGIs $50k-75k, 0.5% for AGIs $75k-100k, 1.5% for AGIs $100k-200k, 5.4% for AGIs over 200k)
Profit/loss from business: +$10,686 (reported on 12.6% of returns)
Here:
+$10,686
State:
+$12,554
(% of AGI for various income ranges: 5.1% for AGIs below $25k, 2.4% for AGIs $25k-50k, 2.4% for AGIs $50k-75k, 2.1% for AGIs $75k-100k, 2.1% for AGIs $100k-200k, 3.4% for AGIs over 200k)
Taxable individual retirement arrangement distribution: $13,346 (reported on 13.0% of returns)
67212:
$13,346
Kansas:
$14,098
(% of AGI for various income ranges: 4.5% for AGIs below $25k, 3.2% for AGIs $25k-50k, 3.2% for AGIs $50k-75k, 3.3% for AGIs $75k-100k, 3.0% for AGIs $100k-200k, 3.7% for AGIs over 200k)
Self-employment retirement plans: $15,744 (reported on 0.4% of returns)
67212:
$15,744
Kansas:
$19,780
(% of AGI for various income ranges: 0.1% for AGIs $50k-75k, 0.1% for AGIs $100k-200k, 0.6% for AGIs over 200k)
Total itemized deductions: $18,428 (20% of AGI, reported on 32.2% of returns)
Here:
$18,428
State:
$23,678
Here:
20.4% of AGI
State:
18.9% of AGI
(% of AGI for various income ranges: 8.9% for AGIs below $25k, 9.1% for AGIs $25k-50k, 10.4% for AGIs $50k-75k, 11.7% for AGIs $75k-100k, 12.9% for AGIs $100k-200k, 14.8% for AGIs over 200k)
Charity contributions: $4,243 (reported on 27.3% of returns)
Here:
$4,243
State:
$5,321
(% of AGI for various income ranges: 1.0% for AGIs below $25k, 1.3% for AGIs $25k-50k, 1.9% for AGIs $50k-75k, 2.4% for AGIs $75k-100k, 3.0% for AGIs $100k-200k, 3.3% for AGIs over 200k)
Taxes paid: $6,518 (reported on 32.1% of returns)
67212:
$6,518
State:
$9,548
(% of AGI for various income ranges: 1.5% for AGIs below $25k, 2.3% for AGIs $25k-50k, 3.3% for AGIs $50k-75k, 4.2% for AGIs $75k-100k, 5.6% for AGIs $100k-200k, 6.1% for AGIs over 200k)
Earned income credit: $2,070 (reported on 14.0% of returns)
Here:
$2,070
State:
$2,212
(% of AGI for various income ranges: 4.8% for AGIs below $25k, 0.9% for AGIs $25k-50k)
Percentage of individuals using paid preparers for their 2012 taxes: 49.0%
Here:
49%
State:
56%
(% for various income ranges: 43.5% for AGIs below $25k, 49.8% for AGIs $25k-50k, 52.6% for AGIs $50k-75k, 52.0% for AGIs $75k-100k, 53.9% for AGIs $100k-200k, 71.9% for AGIs over 200k)
Averages for the 2004 tax year for zip code 67212, filed in 2005:
Average Adjusted Gross Income (AGI) in 2004: $44,718 (Individual Income Tax Returns)
Here:
$44,718
State:
$45,726
Salary/wage: $41,583 (reported on 85.8% of returns)
Here:
$41,583
State:
$40,112
(% of AGI for various income ranges: 116.7% for AGIs below $10k, 75.6% for AGIs $10k-25k, 80.8% for AGIs $25k-50k, 82.9% for AGIs $50k-75k, 85.7% for AGIs $75k-100k, 70.8% for AGIs over 100k)
Taxable interest for individuals: $1,363 (reported on 50.0% of returns)
This zip code:
$1,363
Kansas:
$1,749
(% of AGI for various income ranges: 6.7% for AGIs below $10k, 2.9% for AGIs $10k-25k, 1.7% for AGIs $25k-50k, 1.1% for AGIs $50k-75k, 1.0% for AGIs $75k-100k, 1.6% for AGIs over 100k)
Taxable dividends: $1,890 (reported on 27.8% of returns)
Here:
$1,890
State:
$3,066
(% of AGI for various income ranges: 3.3% for AGIs below $10k, 1.6% for AGIs $10k-25k, 1.0% for AGIs $25k-50k, 0.9% for AGIs $50k-75k, 0.7% for AGIs $75k-100k, 1.7% for AGIs over 100k)
Net capital gain/loss: +$2,839 (reported on 21.2% of returns)
Here:
+$2,839
State:
+$7,555
(% of AGI for various income ranges: -2.5% for AGIs below $10k, 0.2% for AGIs $10k-25k, 0.3% for AGIs $25k-50k, 0.4% for AGIs $50k-75k, 0.8% for AGIs $75k-100k, 4.0% for AGIs over 100k)
Profit/loss from business: +$8,966 (reported on 14.3% of returns)
Here:
+$8,966
State:
+$9,571
(% of AGI for various income ranges: 0.3% for AGIs below $10k, 3.3% for AGIs $10k-25k, 2.5% for AGIs $25k-50k, 2.1% for AGIs $50k-75k, 2.1% for AGIs $75k-100k, 4.5% for AGIs over 100k)
IRA payment deduction: $2,982 (reported on 3.0% of returns)
67212:
$2,982
Kansas:
$2,922
(% of AGI for various income ranges: 0.3% for AGIs below $10k, 0.3% for AGIs $10k-25k, 0.3% for AGIs $25k-50k, 0.2% for AGIs $50k-75k, 0.1% for AGIs $75k-100k, 0.2% for AGIs over 100k)
Self-employed pension: $10,846 (reported on 0.7% of returns)
Here:
$10,846
Kansas:
$14,209
(% of AGI for various income ranges: 0.0% for AGIs $25k-50k, 0.1% for AGIs $50k-75k, 0.1% for AGIs $75k-100k, 0.5% for AGIs over 100k)
Total itemized deductions: $15,209 (21% of AGI, reported on 38.6% of returns)
Here:
$15,209
State:
$18,779
Here:
20.7% of AGI
State:
20.5% of AGI
(% of AGI for various income ranges: 21.5% for AGIs below $10k, 9.5% for AGIs $10k-25k, 11.7% for AGIs $25k-50k, 13.3% for AGIs $50k-75k, 14.3% for AGIs $75k-100k, 13.8% for AGIs over 100k)
Charity contributions deductions: $3,421 (4% of AGI, reported on 34.6% of returns)
Here:
$3,421
State:
$3,892
Here:
4.5% of AGI
State:
4.0% of AGI
(% of AGI for various income ranges: 1.2% for AGIs below $10k, 1.3% for AGIs $10k-25k, 1.9% for AGIs $25k-50k, 2.6% for AGIs $50k-75k, 3.0% for AGIs $75k-100k, 3.6% for AGIs over 100k)
Total tax: $5,813 (reported on 78.5% of returns)
67212:
$5,813
State:
$7,203
(% of AGI for various income ranges: 2.9% for AGIs below $10k, 4.2% for AGIs $10k-25k, 7.2% for AGIs $25k-50k, 8.7% for AGIs $50k-75k, 10.2% for AGIs $75k-100k, 16.4% for AGIs over 100k)
Earned income credit: $1,546 (reported on 10.5% of returns)
Here:
$1,546
State:
$1,674
Percentage of individuals using paid preparers for their 2004 taxes: 53.5%
Here:
54%
State:
63%
(% for various income ranges: 43.2% for AGIs below $10k, 54.8% for AGIs $10k-25k, 55.3% for AGIs $25k-50k, 56.7% for AGIs $50k-75k, 54.0% for AGIs $75k-100k, 60.8% for AGIs over 100k)
Likely homosexual households (counted as self-reported same-sex unmarried-partner households)
Lesbian couples: 0.1% of all households
Gay men: 0.2% of all households
Household received Food Stamps/SNAP in the past 12 months: 998 Household did not receive Food Stamps/SNAP in the past 12 months: 17,640
Women who had a birth in the past 12 months: 575 (523 now married, 55 unmarried) Women who did not have a birth in the past 12 months: 9,565 (4,043 now married, 5,526 unmarried)
Housing units in zip code 67212 with a mortgage: 7,381 (668 second mortgage, 536 both second mortgage and home equity loan) Houses without a mortgage: 207
Median monthly owner costs for units with a mortgage: $1,336 Median monthly owner costs for units without a mortgage: $559
Residents with income below the poverty level in 2022:
This zip code:
12.5%
Whole state:
12.0%
Residents with income below 50% of the poverty level in 2022:
This zip code:
4.6%
Whole state:
6.4%
Median number of rooms in houses and condos:
Here:
7.2
State:
6.9
Median number of rooms in apartments:
Here:
4.2
State:
4.4
Notable locations in this zip code not listed on our city pages
Notable locations in zip code 67212: Sedwick County Zoo (A), Rolling Hills Country Club (B), Wichita Police Department - West (C), Wichita Fire Department Station 8 (D), Wichita Fire Department Station 16 (E), Wichita Public Library - Westlink Branch (F), Vintage Park of Waterfront Assisted Living Facility (G), Sandpiper Bay Healthcare and Retirement Center (H), Park West Plaza Assisted Living Facility and Nursing Home (I), Orchard Park Recreation Center (J), Wichita Public Library - Orchard Park Branch (K), Wichita Presbyterian Manor Assisted Living Facility (L), Sedgwick County Emergency Medical Service Post 5 (M). Display/hide their locations on the map
Churches in zip code 67212 include: Central Community Church of God (A), Country Acres Baptist Church (B), The Church of Jesus Christ of Latter Day Saints (C), Saint Matthias Episcopal Church (D), Westlink Church of Christ (E), Saint Francis of Assisi Church (F), Westlink Regular Baptist Church (G), Ascension Lutheran Church - Tyler Campus (H), Westlink Christian Church (I). Display/hide their locations on the map
Parks in zip code 67212 include: Brown Thrush Park (1), Buffalo Park (2), Kiwanis Park (3), Red Barn Park (4), Swanson Tract Park (5). Display/hide their locations on the map
Tourist attraction (not listed on the city page) : Sedgwick County Zoo (Cultural Attractions- Events- & Facilities; 5555 West Zoo Boulevard).
6,448 married couples with children.
3,412 single-parent households (1,036 men, 2,376 women).
92.9% of residents of 67212 zip code speak English at home.
5.5% of residents speak Spanish at home (76% very well, 10% well, 12% not well, 3% not at all).
0.4% of residents speak other Indo-European language at home (100% very well).
1.3% of residents speak Asian or Pacific Island language at home (27% very well, 21% well, 40% not well, 12% not at all).
0.5% of residents speak other language at home (86% very well, 14% not well).
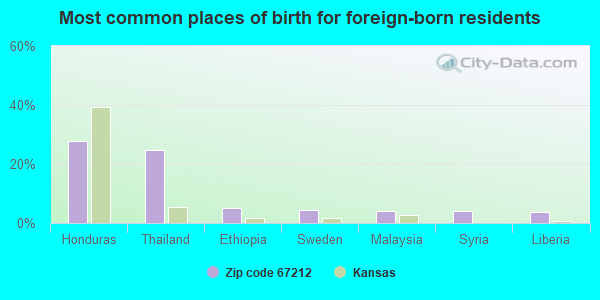
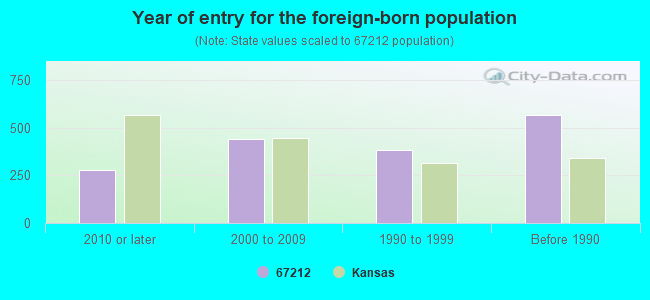
Foreign born population: 1,587 (3.6%) (64.9% of them are naturalized citizens)
Major facilities with environmental interests located in this zip code:
US $1.89 CLEANERS (8428 W 13TH ST N STE 130 in WICHITA, KS)
STATE MASTER (Kansas Facility Profiler) - DRYCLEAN-0271 STATE MASTER (Kansas Facility Profiler) - DRYCLEAN-0300 (Resource Conservation and Recovery Act (tracking hazardous waste)) Organizations: MCFADDEN ENTERPRISES DBA US $1.89 CLNRS (CONTACT/OWNER)
, JOHN D HOLTZCLAW (CONTACT/OWNER)
, J L US $1.89 INC (DRY CLEANER EQUIPMENT OWNER)
, MAFADDEN ENT INC (DRY CLEANER EQUIPMENT OWNER)
Alternative names: J L US $1.89 INC, MCFADDEN ENT INC--US $1.89 CLEANERS, MCFADDEN ENT INC US $1.89 CLNRS, MCFADDEN ENT INC US $1.89 CLNRS
KANSASLAND TIRE (1452 N MAIZE ROAD in WICHITA, KS)
AIR MINOR (AIRS/AFS) ENFORCEMENT/COMPLIANCE ACTIVITY (Integrated Compliance Information System) - ICIS-07-2003-0112, FORMAL ENFORCEMENT ACTION (Integrated Compliance Information System) - ICIS-07-2003-0112, FORMAL ENFORCEMENT ACTION Business SIC classification: GENERAL AUTOMOTIVE REPAIR SHOPS
JOHN S SLUDGE POND (29TH ST NE OF HYDRAULIC in WICHITA, KS)
SUPERFUND NPL (Superfund database) (Integrated Compliance Information System) - ICIS-07-1985-0134, FORMAL ENFORCEMENT ACTION STATE MASTER (Kansas Facility Profiler) - ISL-C208700047, STATE CLEANUP SITE Organizations: CITY OF WICHITA - DEPT. OF PUBLIC WORKS (CONTACT/OWNER)
, CITY OF WICHITA (CONTACT/OWNER)
Alternative names: JOHNS OIL SLUDGE PIT, JOHNS' SLUDGE POND
LEVY SPECIAL EDUCATION CENTER (400 N WOODCHUCK ST in WICHITA, KS)
STATE MASTER (Kansas Facility Profiler) - TANKS-08922, UNDERGROUND STORAGE TANK PROGRAM (National Center for Education Statistics) - STATE ID-1715 Organizations: USD #259 ATTN: M. LIBHART (OWNER/OPERATOR)
, WICHITA (SCHOOL DISTRICT)
BEST CLEANERS 2036 (10231 W 21ST ST N in WICHITA, KS)
AIR MINOR (AIRS/AFS) STATE MASTER (Kansas Facility Profiler) - ISTEPS-17300290, AIR PROGRAM, DRYCLEAN-0204 Small Quantity Generators, between 100 kg and 1000 kg of hazardous waste/month (Resource Conservation and Recovery Act (tracking hazardous waste)) - notification Business SIC classification: DRYCLEANING PLANTS, EXCEPT RUG CLEANING Organizations: PATRICIA ZIMMERMAN (CONTACT/OPERATOR)
, PRIDE CLEANERS INC (CONTACT/OWNER)
, NORTH POINTE DEVELOPMENT (CONTACT/OWNER)
, DCI MGMT (DRY CLEANER EQUIPMENT OWNER)
Alternative names: BEST CLEANERS (W. 21ST), BEST CLNRS 2036
WESTLINK AUTO SERVICE CENTER (1455 NORTH MAIZE ROAD in WICHITA, KS)
AIR MINOR (AIRS/AFS) ENFORCEMENT/COMPLIANCE ACTIVITY (Integrated Compliance Information System) STATE MASTER (Kansas Facility Profiler) - TANKS-29638, UNDERGROUND STORAGE TANK PROGRAM Conditionally Exempt Small Quantity Generators, less than 100 kg/month of hazardous waste (Resource Conservation and Recovery Act (tracking hazardous waste)) Business SIC classification: GENERAL AUTOMOTIVE REPAIR SHOPS Business NAICS classification: GENERAL AUTOMOTIVE REPAIR. Organizations: DON HOWELL (CONTACT/OPERATOR)
, DON HOWELL (CONTACT/OWNER)
ALIGNMENT SERV & REPA (5601 WEST CENTRAL AVENUE in WICHITA, KS)
STATE MASTER (Kansas Facility Profiler) - TANKS-19418, UNDERGROUND STORAGE TANK PROGRAM (Resource Conservation and Recovery Act (tracking hazardous waste)) Business NAICS classification: GENERAL AUTOMOTIVE REPAIR. Organizations: ROBERT J DULOHERY SR (CONTACT/OPERATOR)
, DULOHERY, ROBERT J SR (OWNER/OPERATOR)
Alternative names: ALIGNMENT SVC & RPR
WESLEY REHAB. HOSP./HEALTH SOU (8338 W 13TH ST N in WICHITA, KS)
STATE MASTER (Kansas Facility Profiler) - TANKS-29742, UNDERGROUND STORAGE TANK PROGRAM (Resource Conservation and Recovery Act (tracking hazardous waste)) Organizations: WESLEY REHABILITATION HOSPITAL (CONTACT/OPERATOR)
, WESLEY REHABILITATION HOSPITAL (CONTACT/OWNER)
Alternative names: WESLEY REHABILITATION HOSP
BEST CLEANERS (8526 WEST 13TH STREET NORTH in WICHITA, KS)
STATE MASTER (Kansas Facility Profiler) - ISL-C208770840, STATE CLEANUP SITE, DRYCLEAN-0137 (Resource Conservation and Recovery Act (tracking hazardous waste)) Organizations: PRIDE CLEANERS INC (CONTACT/OWNER)
, NORTHWEST CENTER LLC (CONTACT/OWNER)
, DCI MGMT (DRY CLEANER EQUIPMENT OWNER)
Alternative names: BEST CLEANERS - 13TH NORTH, PRIDE CLEANERS DBA BEST CLEANERS 2031, PRIDE CLNRS DBA BEST CLNRS 2031
BEST CLEANERS 2010 (7011 W CENTRAL STE 206 in WICHITA, KS)
STATE MASTER (Kansas Facility Profiler) - DRYCLEAN-0140 (Resource Conservation and Recovery Act (tracking hazardous waste)) Organizations: PRIDE CLEANERS INC (CONTACT/OWNER)
, DCI MGMT (DRY CLEANER EQUIPMENT OWNER)
Alternative names: PRIDE CLEANERS DBA BEST CLEANERS 2010, PRIDE CLNRS DBA BEST CLNRS 2010
BISHOP CARROLL HIGH SCHOOL (8101 W CENTRAL in WICHITA, KS)
STATE MASTER (Kansas Facility Profiler) - TANKS-27560, UNDERGROUND STORAGE TANK PROGRAM, WWT-I-AR94-CO64, WASTEWATER FACILITY COMPLIANCE ACTIVITY (Tracking inspections of insecticide, fungicide, and rodenticide, and toxic substances) Conditionally Exempt Small Quantity Generators, less than 100 kg/month of hazardous waste (Resource Conservation and Recovery Act (tracking hazardous waste)) - notification Business SIC classification: NONCLASSIFIABLE ESTABLISHMENTS Organizations: DIOCESE OF WICHITA (CONTACT/OWNER)
, DIOCESAN SUPERINTENDENT (OWNER/OPERATOR)
Alternative names: BISHOP CORROLL HIGH SCHOOL
WESTLINK AMOCO (9518 W CENTRAL in WICHITA, KS)
STATE MASTER (Kansas Facility Profiler) - TANKS-25206, UNDERGROUND STORAGE TANK PROGRAM Conditionally Exempt Small Quantity Generators, less than 100 kg/month of hazardous waste (Resource Conservation and Recovery Act (tracking hazardous waste)) Organizations: AMOCO OIL COMPANY (CONTACT/OPERATOR)
, AMOCO OIL CO (CONTACT/OWNER)
, HOWELL, DONALD B. (OWNER/OPERATOR)
Alternative names: WESTLINKAUTO SERVICE
WICHITA CONCRETE PIPE, INC. (700 E. 29TH ST. NORTH in WICHITA, KS)
AIR MINOR (AIRS/AFS) STATE MASTER (Kansas Facility Profiler) - ISTEPS-17300103, AIR PROGRAM Business SIC classification: CONCRETE PRODUCTS, EXCEPT BLOCK AND BRICK Business NAICS classification: CONCRETE PIPE MANUFACTURING.
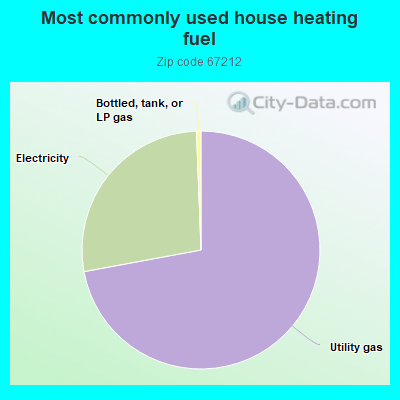
Housing units lacking complete plumbing facilities: 0.8% Housing units lacking complete kitchen facilities: 0.7%
71.8%Utility gas
27.2%Electricity
0.6%Bottled, tank, or LP gas
Population in 1990: 41,349. Population change in the 1990s: +4,241 (+10.3%).
Place of birth for U.S.-born residents:
This state: 31,047
Northeast: 807
Midwest: 3,964
South: 3,859
West: 2,827
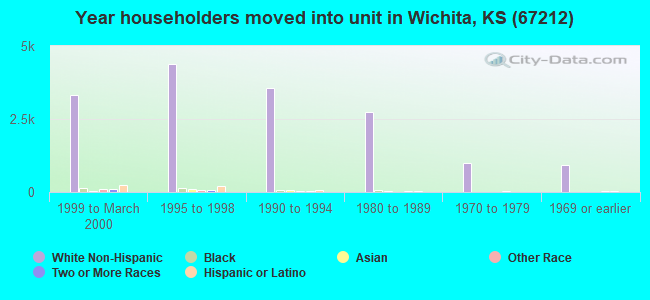
56% of the 67212 zip code residents lived in the same house 5 years ago. Out of people who lived in different houses, 67% lived in this county. Out of people who lived in different counties, 50% lived in Kansas.
87% of the 67212 zip code residents lived in the same house 1 year ago. Out of people who lived in different houses, 72% moved from this county. Out of people who lived in different houses, 11% moved from different county within same state. Out of people who lived in different houses, 14% moved from different state. Out of people who lived in different houses, 0% moved from abroad.
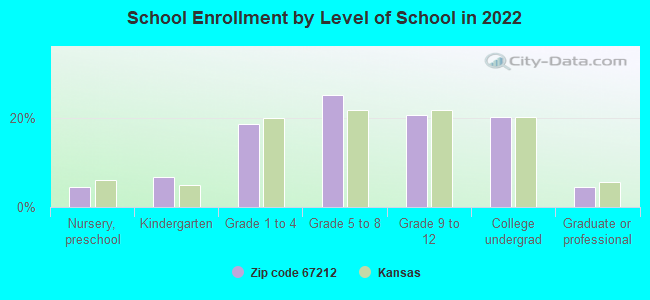
Private vs. public school enrollment:
Students in private schools in grades 1 to 8 (elementary and middle school): 959
Here:
21.9%
Kansas:
14.1%
Students in private schools in grades 9 to 12 (high school): 265
Here:
12.9%
Kansas:
10.8%
Students in private undergraduate colleges: 139
Here:
7.0%
Kansas:
15.4%
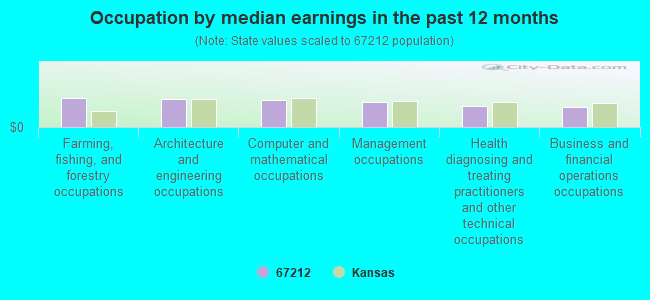
Occupation by median earnings in the past 12 months ($)
85,204Farming, fishing, and forestry occupations
80,964Architecture and engineering occupations
77,428Computer and mathematical occupations
72,777Management occupations
61,764Health diagnosing and treating practitioners and other technical occupations
58,374Business and financial operations occupations
Companies with federal contracts located in this zip code:
NEIL ENGINEERING CO (7208W 12TH in WICHITA, KS; small business) : $2,715,762 in 140 contractsfrom 1999 to 2006
Contracts for Facilities Operations Support Services, Maintenance, Repair and Rebuilding of Equipment -- Miscellaneous, Maintenance, Repair or Alteration of Real Property -- Other Warehouse Buildings, Maintenance, Repair and Rebuilding of Equipment -- Food Preparation and Serving Equipment, and moreby Navy, Army, Department of Defense, National Institutes of Health, and others Signed by year:2000: $376,985; 2001: $428,629; 2002: $446,488; 2003: $361,804; 2004: $505,475; 2005: $435,456; 2006: $116,925.
Biggest contracts:
$94,920 with Navy for Facilities Operations Support Services. Taking place in CA. Signed on 2002-10-25. Completion date: 2003-09-30.
$90,465, same as above.Signed on 2000-04-29. Completion date: 2001-04-30.
$83,520 with Army for Maintenance, Repair and Rebuilding of Equipment -- Miscellaneous. Taking place in HI. Signed on 2003-02-19. Completion date: 2003-04-30.
$81,970, same as above.Signed on 2002-10-30. Completion date: 2003-01-31.
B & T INDUSTRIES LLC (1262 SUNSET DR in WICHITA, KS; small business)
$52,615 with Army for Guns, through 30 mm. Signed on 2003-11-12. Completion date: 2004-03-31.
SWAT PATROLLED SECURITY (411 ACADIA in WICHITA, KS)
$5,640 with Defense Commissary Agency for Guard Services. Signed on 2005-02-25. Completion date: 2006-03-31.
Top industries in this zip code by the number of employees in 2005:
2002 - 2018 National Fire Incident Reporting System (NFIRS) incidents
According to the data from the years 2002 - 2018 the average number of fires per year is 150. The highest number of fires - 188 took place in 2012, and the least - 117 in 2008. The data has a dropping trend.
When looking into fire subcategories, the most reports belonged to: Outside Fires (42.7%), and Structure Fires (39.7%).
Fire incident types reported to NFIRS in Zip Code 67212


 Nearest zip codes: 67205, 67209, 67235, 67223, 67203, 67213.


 According to the data from the years 2002 - 2018 the average number of fires per year is 150. The highest number of fires - 188 took place in 2012, and the least - 117 in 2008. The data has a dropping trend.
 When looking into fire subcategories, the most reports belonged to: Outside Fires (42.7%), and Structure Fires (39.7%).